Fibo Candle Previous for MT5
- 指标
- Taras Slobodyanik
- 版本: 3.70
- 更新: 7 六月 2024
- 激活: 10
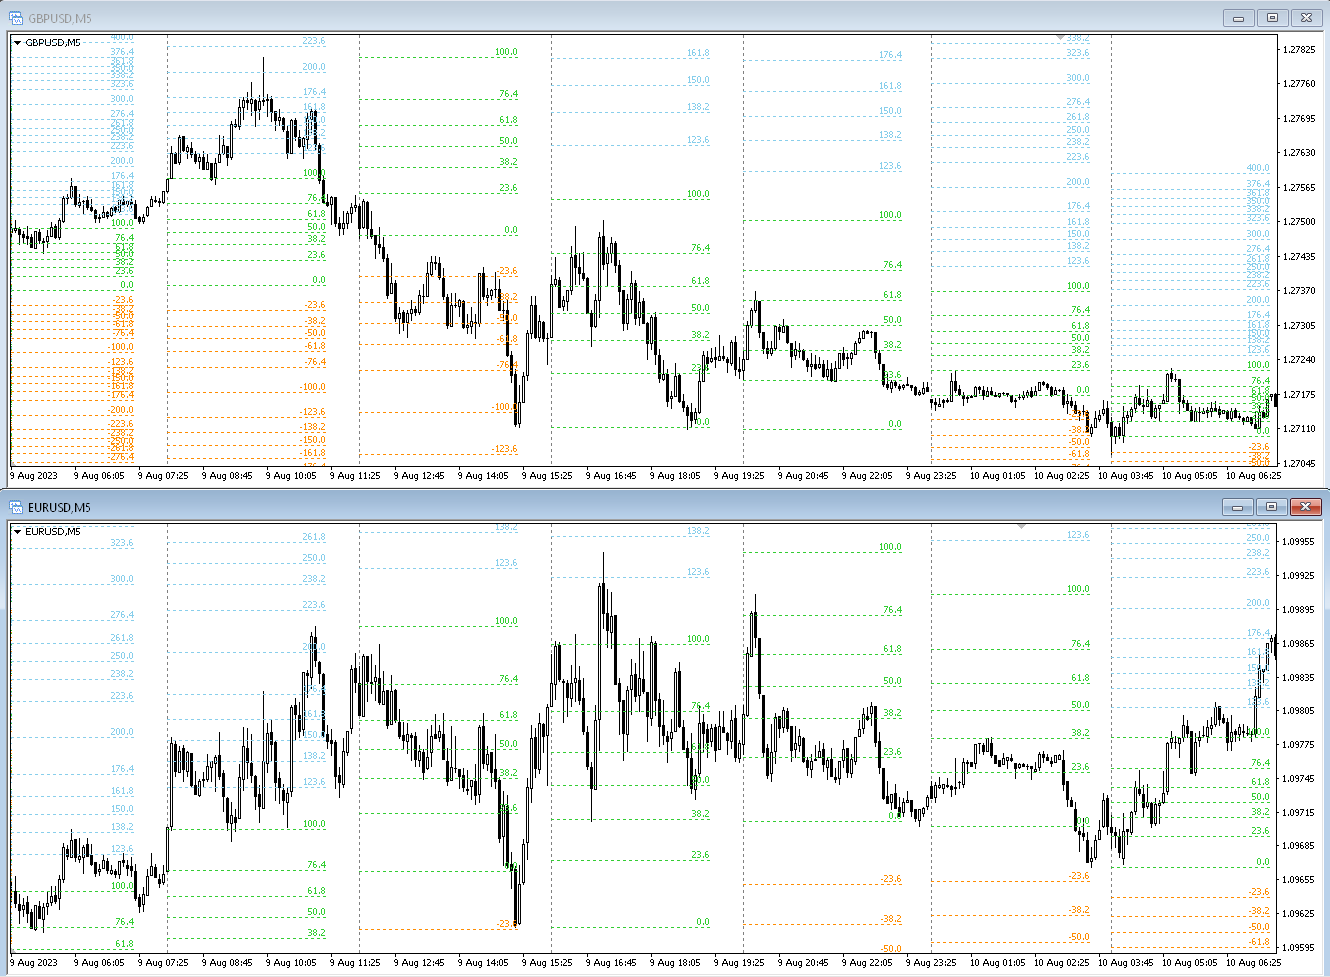
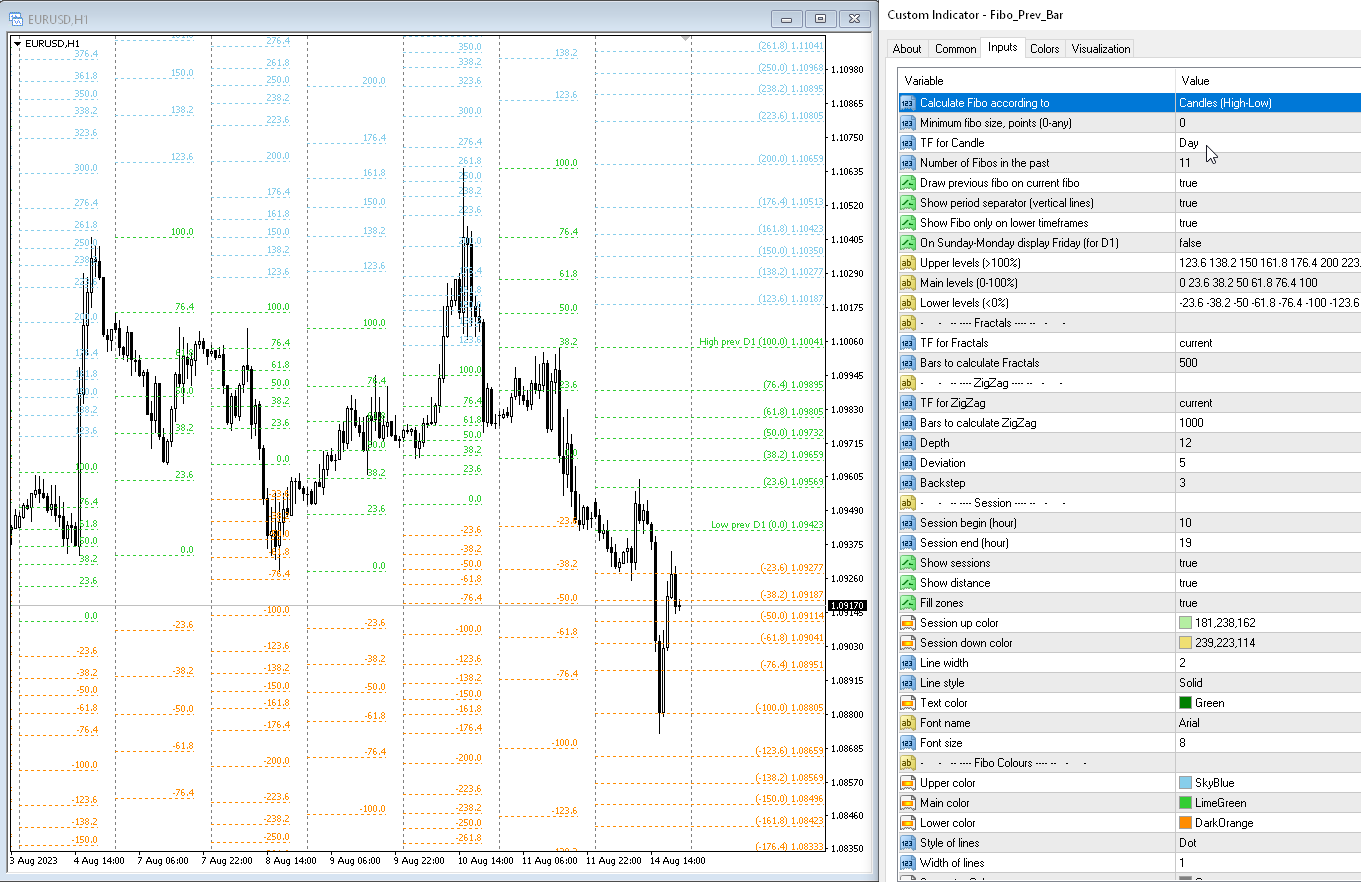
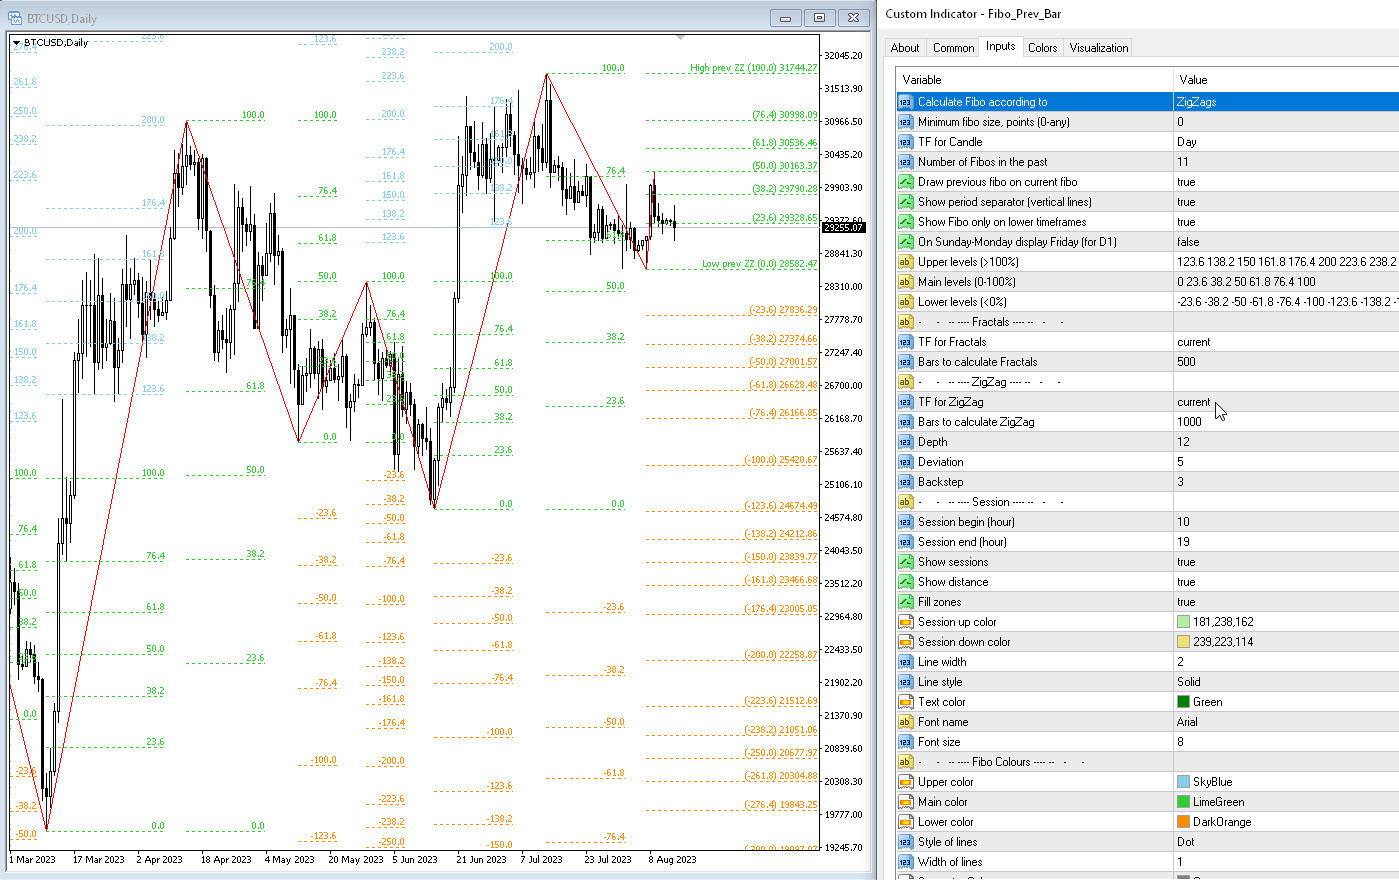
该指标根据 ZigZag 指标、交易时段、分形或蜡烛(包括非标准时间范围:年、6 个月、4 个月、3 个月、2 个月)自动绘制斐波那契水平(自动斐波那契回撤)。 您可以选择任何更高的时间范围进行斐波纳奇计算。
每次当前柱关闭时都会重新绘制级别。 当超过指定级别时可以启用警报。
您还可以分析历史水平。 为此,需要在“过去的斐波纳奇数”参数中指定斐波纳奇位的数量。
参数
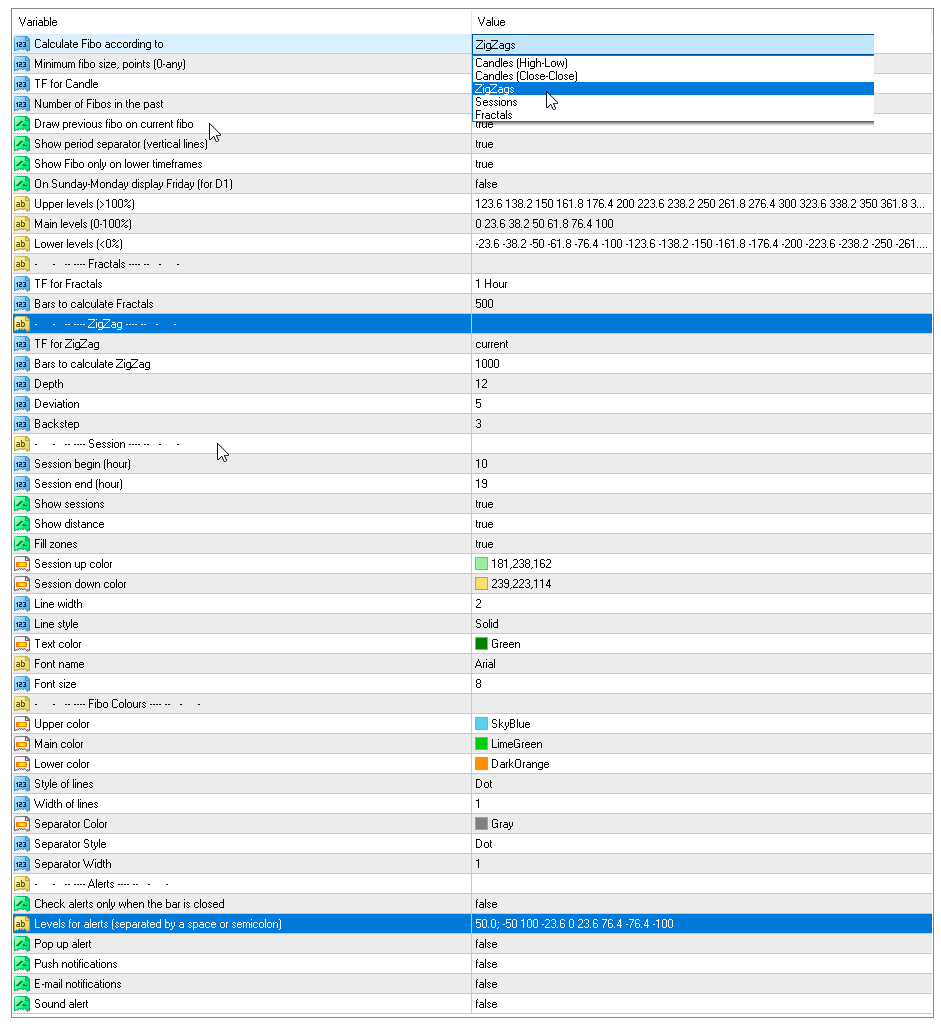
Calculate Fibo according to — 根据斐波那契搜索模式计算斐波那契:
- Candles (High-Low) — 根据最高价-最低价构建斐波那契;
- Candles (Close-Close) — 基于收盘价-收盘价构建斐波那契;
- ZigZags — 通过 ZigZag 点构建斐波那契;
- Sessions — 通过交易会话构建斐波那契;
- Fractals — 通过分形点构建斐波那契。
Minimum fibo size, points (0-any) — 最小斐波那契尺寸,以点为单位。 如果斐波那契尺寸小于此大小,则忽略它。
TF for Candle — 用于构建斐波那契水平的蜡烛时间范围;
Number of Fibo in the past — 历史上要绘制的斐波那契水平数;
Upper levels (>100%) — 上层级别,值必须大于 100(以空格或分号分隔);
Main levels (0-100%) — 中间级别,值必须在 0 到 100 之间(以空格或分号分隔);
Lower levels (<0%) — 较低级别,值必须小于 100(以空格或分号分隔);
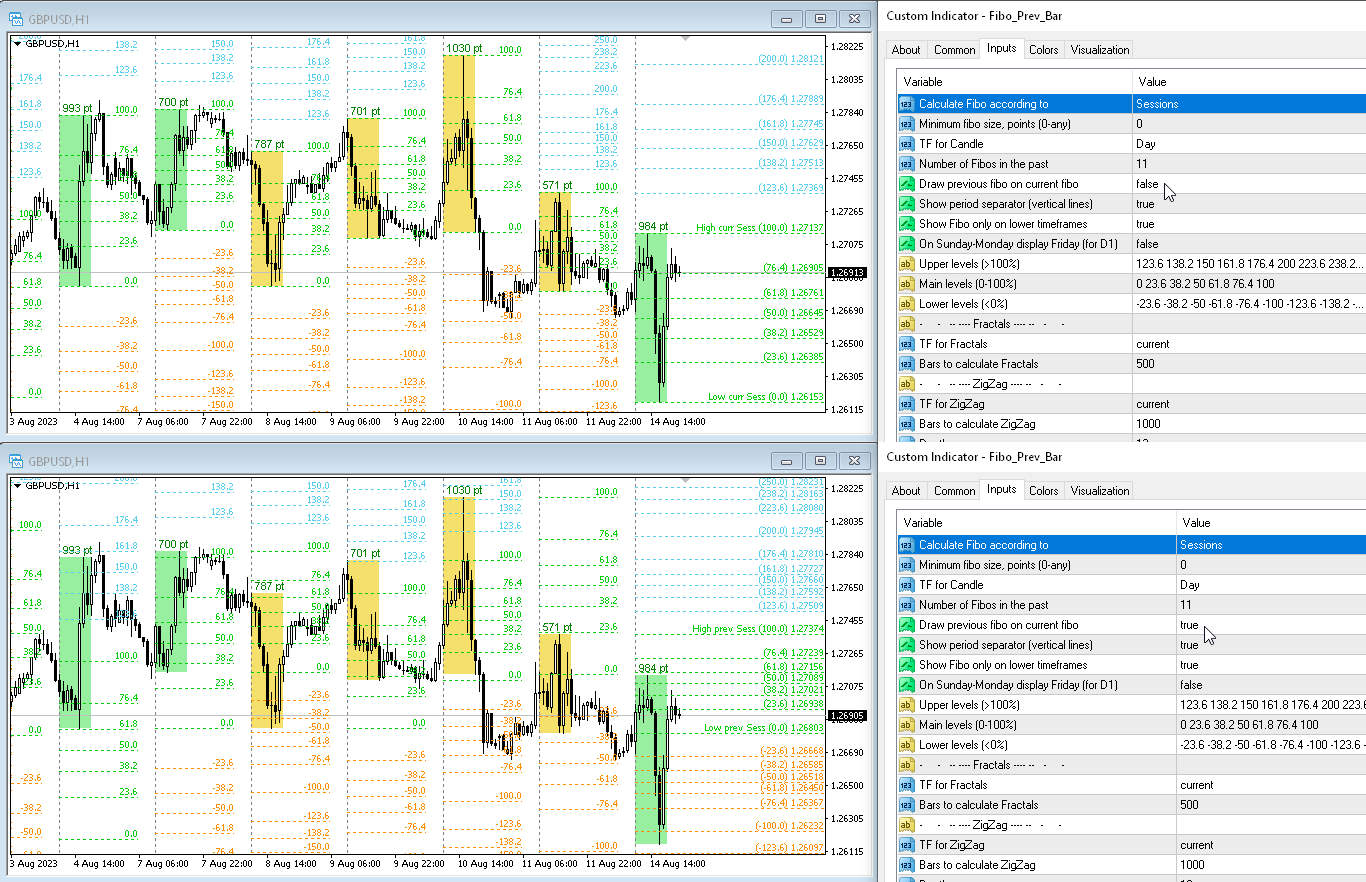
Draw previous fibo on current fibo — 绘制前一个斐波那契函数来代替当前的斐波那契函数。 如果禁用此参数,斐波那契函数将按照计算时的水平绘制。
On Sunday-Monday display Friday (for D1) — 如果周六至周日有报价,则绘制周五斐波那契。 仅适用于 D1 时段;
Show period separator (vertical lines) — 显示句点分隔符。 将在图表上显示为垂直线;
Show Fibo only on lower timeframes — 仅在较小的时间范围内绘制斐波那契;
Upper color — 上部线条的颜色;
Main color — 中间线的颜色;
Lower color — 下部线条的颜色;
Style of lines — 线条样式;
Width of lines — 线宽;
Min pause between signals (sec) — 警报之间的暂停时间(以秒为单位);
Levels for alerts (separated by a space or semicolon) — 警报级别,用空格或分号分隔;
Alerts — 启用弹出警报;
Push notification — 启用推送通知;
Send e-mail — 发送电子邮件。


This is one of the main indicators for my reviews, excellent the attentiveness of the developer to implement suggestions for improvements, great job!