Flow Of Lines
- 指标
- Roman Vashchilin
- 版本: 1.1
- 更新: 6 四月 2020
- 激活: 10
Flow Of Lines
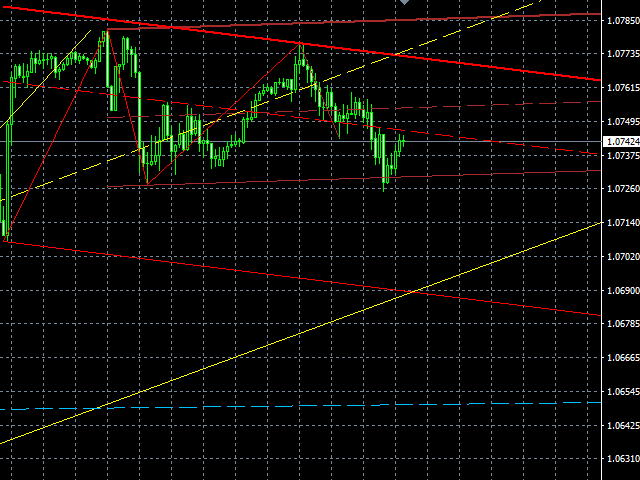
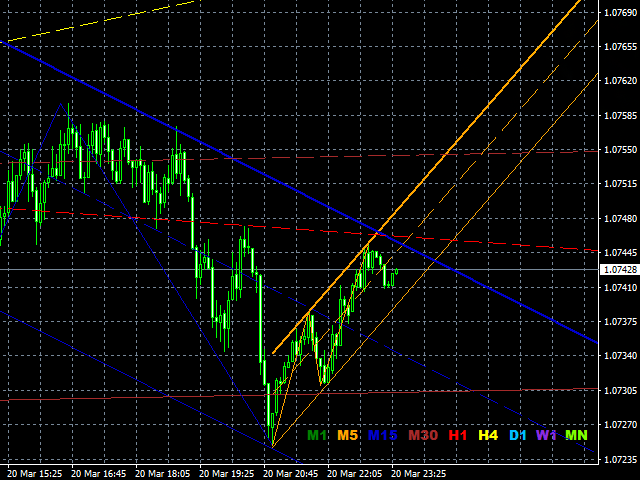
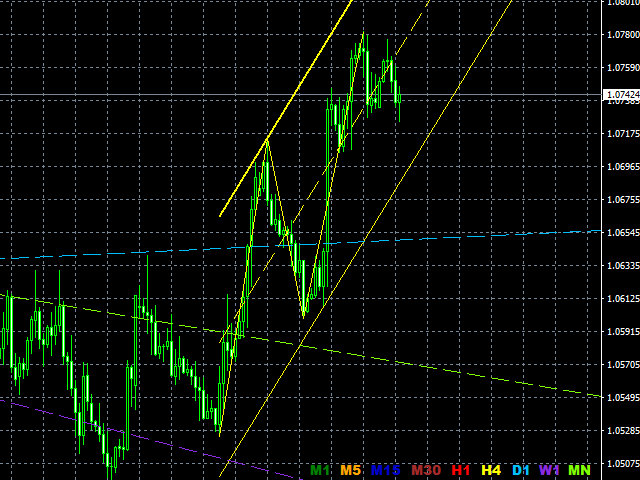
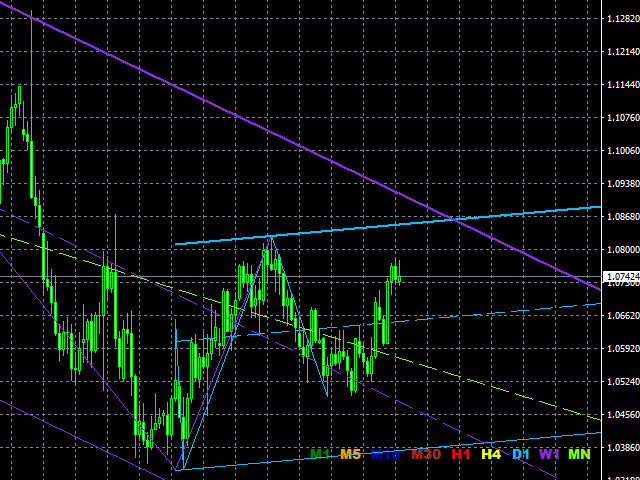
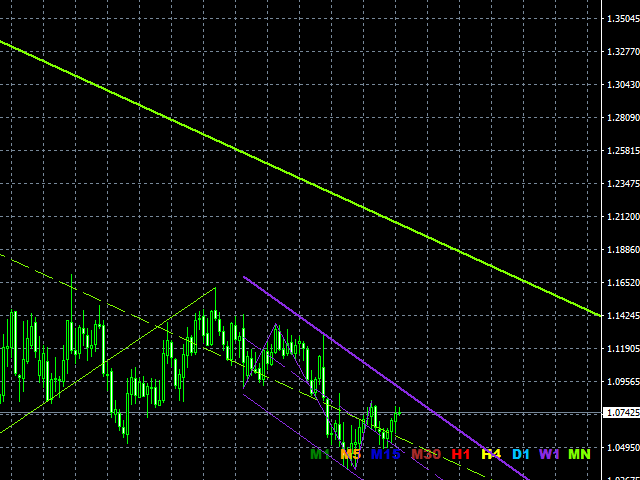
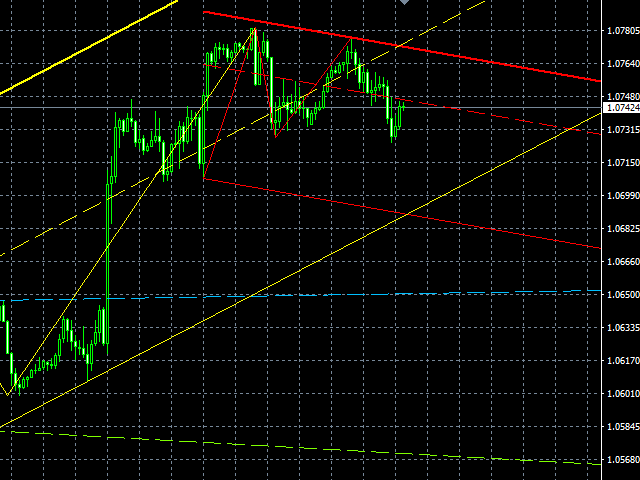
The indicator calculates and shows on a symbol chart trend channels, as well as the price movement channels, each of which corresponds to its specific timeframe. This method provides easy analysis of long- and short-term trend movement dynamics.
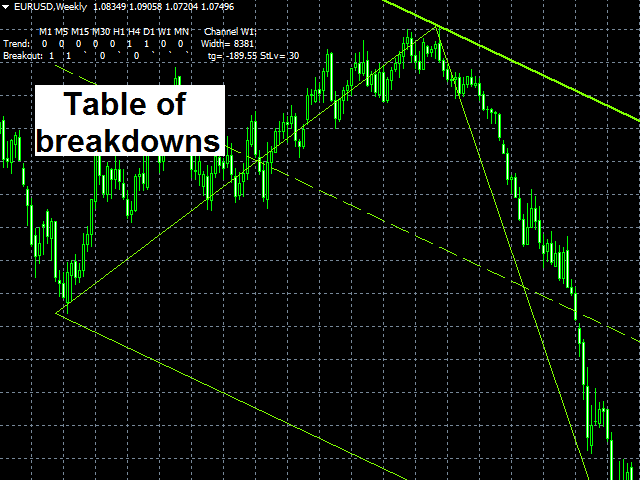
In addition to all of the above, the indicator displays breakouts and the presence of a strong trend in the digital format (on the right top of the table). The lines that serve as the channel borders, can be at the same time used as certain price levels and support/resistance levels. This feature provides the ability to use them to trade pending orders and trade using support/resistance levels.
Key features
- Automatically draws all trends in all timeframes and currency pairs;
- Possibility to trade based on the support/resistance levels;
- Possibility to trade breakouts;
- Trend following trading;
- Counter-trend trading;
- Fast market analysis;
- Shows channel borders for easy setup of support/resistance levels;
- It is extremely useful for both novice and experienced traders.
Indicator Parameters
Number of bars to draw on a chart (default values):
- Bars M1 = 7;
- Bars M5 = 7;
- Bars M15 = 7;
- Bars M30 = 7;
- Bars H1 = 7;
- Bars H4 = 7;
- Bars D1 = 7;
- Bars W1 = 7;
- Bars MN = 7.
Number of waves to analyze using ZigZag (default values):
- W Z-Z M1 = 3;
- W Z-Z M5 = 3;
- W Z-Z M15 = 3;
- W Z-Z M30 = 3;
- W Z-Z H1 = 3;
- W Z-Z H4 = 3;
- W Z-Z D1 = 3;
- W Z-Z W1 = 3;
- W Z-Z MN = 3.
- Common waves = 0 - the number of waves for the analysis on ALL timeframes using the ZigZag indicator (to be added to other wave parameters).
Trend line colors, timeframe (default colors):
- Color M1 = Green;
- Color M5 = Orange;
- Color M15 = MediumBlue;
- Color M30 = Brown;
- Color H1 = Red;
- Color H4 = Yellow;
- Color D1 = DeepSkyBlue;
- Color W1 = BlueViolet;
- Color MN = Orange.
You also have some customization options:
- % of half the channel of the additional line = 0.0 - % of additional lines between average trend lines;
- Output zig-zag to the screen = true - enable/disable the ZigZag indicator;
- Display comments on the screen №1 = true - show/hide trend breakout and trend existence comments;
- Display comments on the screen №2 = true - show/hide comments at the bottom right of the screen;
- Trend with a small timeframe show = true - remove/do not remove from the current chart the trends of timeframes lower than the current one (e.g. on H1 trends of M1, M5, M15, M30 will not be shown);
- Show monthly trend everywhere = true - show/hide monthly trend lines on lower timeframes.




Thanks for the update, been using it recently and is more helpful now. Would recommend.