• 概述
  • 评论 (13)
  • 评论 (49)
  • 新特性

Indicator Combine Merge by RunwiseFX

4.92

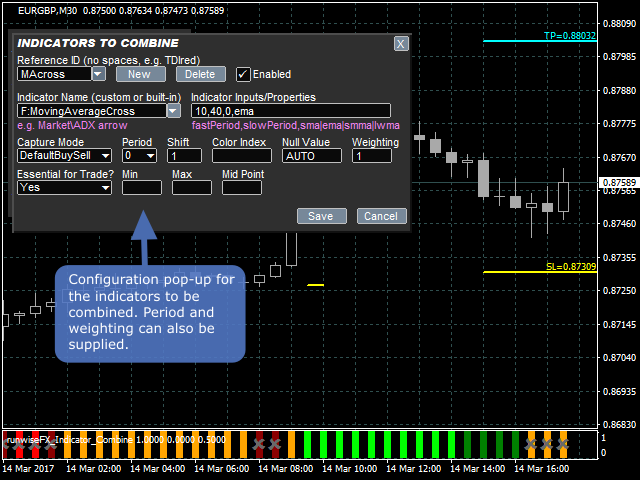
Allows multiple indicators to be combined into a single indicator, both visually and in terms of an alert. Indicators can include standard indicators, e.g. RSI, CCI, etc., and also Custom Indicators, even those purchased through Market, or where just have the ex4 file. An early alert is provided, say when 4 out 5 indicators have lined up, and a confirmed alert when all are in agreement.

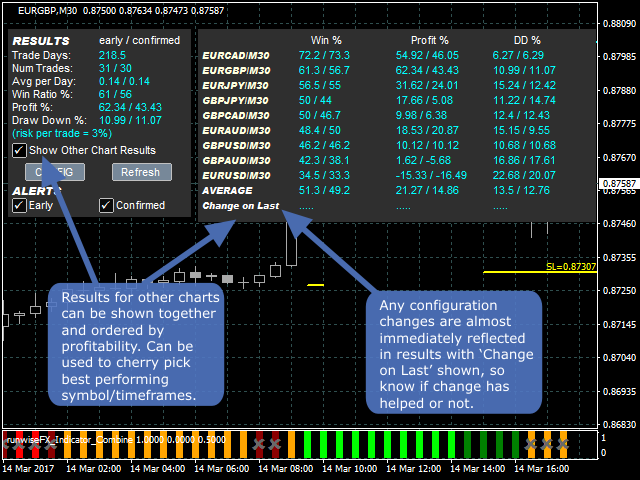
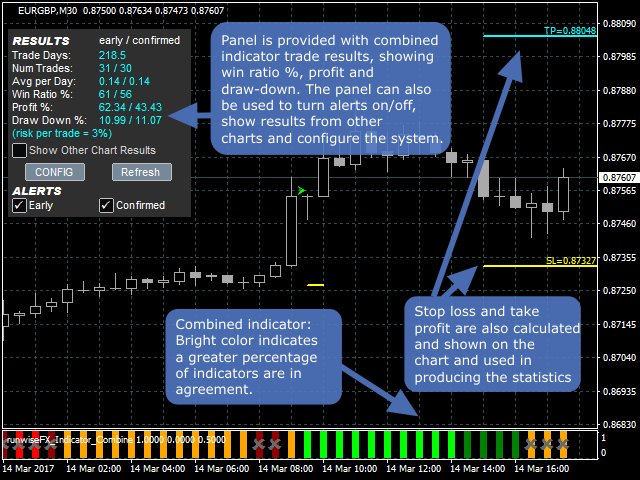
A‌lso features a statistics panel reporting the success of the combined indicator by examining the current chart. The win rate, profit and draw down are calculated, based on a selected stop loss and take profit/exit regime. Results from other charts can also be shown together and ordered with the best performing symbols shown first - allowing cherry picking of best symbols/timeframes.

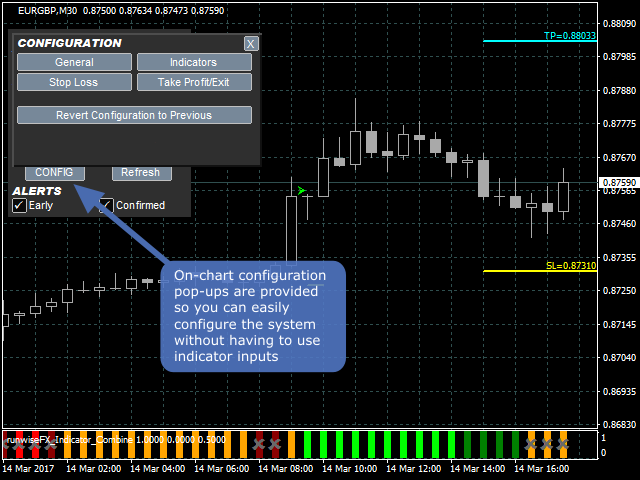
The product is easily configured using pop-up forms – see video. The product comes configured with example standard indicators.

Fully compatible with our range of EA panels, allowing easy conversion into an EA that can trade automatically.

‌‌Please see Comments tab (first entry) for link to the manual.


Features

  • Combines multiple indicators both visually and in terms of an alert
  • Works with standard indicators and Custom Indicators, even if just have ex4 file or those purchased from market
  • Indicators are examined on candle close, by default, so no repainting
  • Choice of two configurable alert levels - early (say when 75% of indicators lined-up) and confirmed (all lined-up)
  • Shows trade result statistics of combined indicators with win ratio, profit and draw down - calculated in real-time by examining the current chart
  • Option to show table of statistics from other charts/symbols that the indicator is loaded on to - ordered by profit
  • Results show outcome of both early and confirmed alert, so can see which is performing best
  • Option to automatically select early or confirmed alert, depending on which has the higher profit, or win ratio
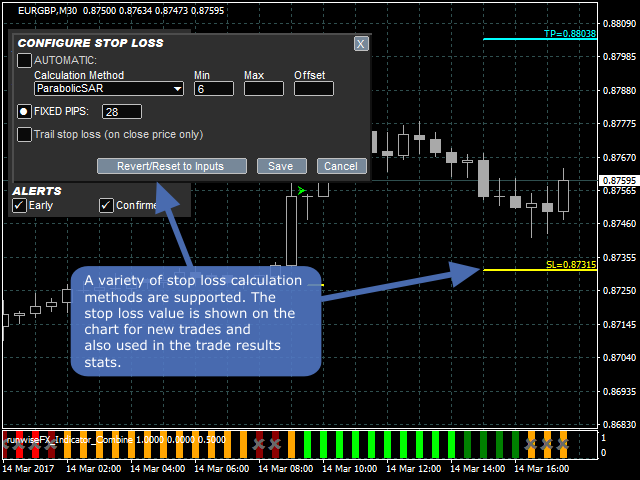
  • Realistic calculation of statistics by taking into consideration a selected stop loss, take profit/exit regime and spread
  • Stop loss can be specified either as fixed pips or using a variety of automatic calculation methods, including from a custom indicator
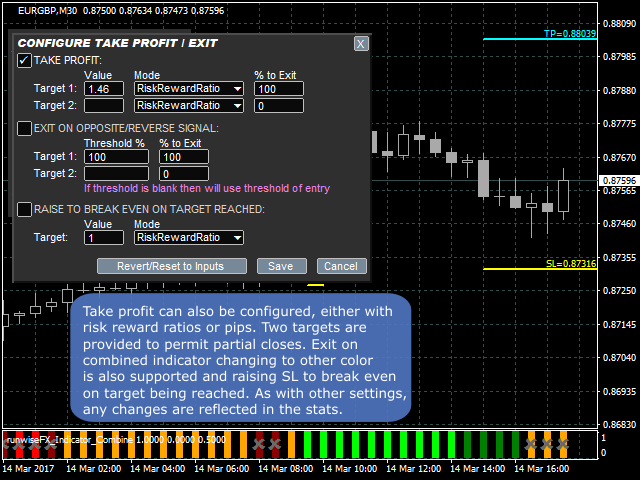
  • Statistics can also include effect of trading hours, partial take profit/exit, trailing stop loss and auto break even when target reached
  • Optional Binary Options mode where statistics are worked out with expiry rather than SL/TP
  • Take profit and break even targets can be specified as either risk reward ratios or in pips
  • Pips can be optionally specified as a percentage of the Average Daily True Range, allowing it to automatically scale depending on the symbol
  • Shows simulated trades on the chart with open price, stop loss used, close price and profit
  • Automatic recalculation of statistics upon configuration changes, showing the effect on win ratio, profit and draw-down
  • One-click restore of previous configuration if change was not beneficial
  • Configured stop loss, break even and take profit prices are shown on chart for use with new trades
  • Easy to use configuration pop-ups
  • Choice of display formats, i.e. bar or histogram
  • Choice of alert methods, e.g. pop-up, email or mobile notification
  • Easy integration with our EAs for automated trading


‌Indicator Inputs

Use the CONFIG button to configure the system. Inputs are provided as an alternative and are fully described in the manual - see Comments tab for link to manual. Key inputs are explained below:

  • Main_alertConfirmedPercentage - Percentage of indicators that need to have lined-up for confirmed alert to happen
  • Main_alertEarlyPercentage - Percentage of indicators that need to have lined-up for early alert to happen
  • Main_alertResetLevel - How much indicator needs to go to other direction of alert reset to happen
  • Main_binaryOptionModeBars - If > 0 then number of bars before trade closes to simulate Binary Options


Using the Strategy Tester / Demo Version

Make sure the test is running at least at market speed for the buttons on the panel to work. Alerts appear in the Journal tab.


Converting Into an EA

Can easily be converted into an EA that can trade automatically with our Ultimate Trade Manager product.

评论 13
joseanrod
95
joseanrod 2023.04.20 15:22 
 

To keep it short, a SENSATIONAL tool for backtesting, indicating when to buy/sell and exit based on your system. If you have a profitable and fully mechanical system based on indicators then this is a must have tool. It facilitates your backtesting so much and provides you statistics based on the chosen days, which boosts your confidence and saves you precious time. Very user friendly, the videos on Youtube are very useful, comprehensive manual to reference. Not to say about the support and customer service is OUTSTANDING. Any legitimate doubt that I’ve had, I received a prompt and comprehensive answer to my Qs. LASTLY, before you buy, make sure that this is the tool you are looking for. This is an indicator and even though you can build your mechanical strategy using this tool, you cannot automate it (run it as an EA) since it’s an indicator. Make sure you take a look to his products and ask support if they have them on their website since through them, you don’t have the hardware activation limit. If you are confused, just contact the support email, describe what you’re looking for and I hope you’ll end up satisfied as myself.

Nicola Pileri
347
Nicola Pileri 2020.04.01 19:21 
 

Mi stupisce che ci siano così poche valutazioni, tutti i commercianti dovrebbero avere questo sistema che fa risparmiare enorme tempo.

Fantastico sistema.

Trader mql5
1265
Trader mql5 2019.04.25 04:01 
 

Where do I start...

Most importantly, support is superb and this is a unique, one-of-a-kind "app". I call it an app as it assists you in guiding which indicators have some hope and which are just rubbish by quickly analyzing the buffers of the indicators.

I certainly have a love-hate relationship with it, as it exposes the indicators which I thought are profitable in the long run, but fail miserably. I could have bet my life on some indicators, but this app clearly trashed most of them. I am starting to realize that indicators are not my way forward in trading...

I literally tested 3000+ indicators over the last couple months. Most can be trashed immediately within a few seconds by inserting the buffers. Others seem extremely profitable, but then test them through Strategy Tester, just to realize they either repaint or back-paint, even subtly by changing color, arrow or angle within one candle. When this info is then fed to the app by shifting the confirmation to 2 bars i.l.o 1 bar - crash, boom, bang, kaputt. It will need some reading and studying the manual in DETAIL to be able to identify which capture modes to use, but you will get there, believe me I am not overly bright and my mind melts when I have to program anything even remotely simple, but the logic of this piece of software is fantastic, once you get the hang of it - no programming required, you just pick the appropriate capture options and set your TP, SL levels. Also appropriate time frame consideration is very important with different TP/SL for each TF.

Remember there are many options for Stop Loss and Take Profit. Some indys like quick TP without waiting for opposite signals, others need opposite signals to be profitable. Scaling in on some are also good instead of a blind TP level. Combinations of both scaling in and exit/reverse on opposite signals are also possible. Stop Loss levels for each pair is also sensitive due to the pair's volatility, play around.

If you are an indicator addict like me, it will save you thousands. I spend more on indicators than on my trading balance in the hope to find that one gem - AND THIS IS THAT VERY GEM. If you insert this indicator in strategy tester, then demo a market indicator within it without buying it, you can very quickly make up your mind. Test the top 20 indicators in demo here on MQL5, you will be shocked. Bear in mind, multi time frame indicators will not work properly in Strategy Tester, with or without Indicator Merge. Refer to the sellers of these indys and they may have a free "lite" version or limited demo version for you to test.

Just a final tip: Even if you found a indy or a combination of Indicators that look good, even after testing them in Strategy Tester and you found them not re- or backpaint - Try them yet again in Strategy Tester together with Indicator Merge to give you current stats. Many, many indicators appear not to repaint, but small changes are sometimes not noticed unless they run bar by bar.

I am a rehabilitated compulsive gambler, this software is helping me turn into a rehabilitated compulsive indicator user at a price that is low for its effectiveness. I have currently only a handful of indys (most of them are free!) which may be useful as confirmation, still optimizing them to make a final decision.

The grey matter with vast voids between our ears seems to be the greatest expert advisor of all.

Additional edit: Where this app shines with Indicators is what Strategy Tester does for Expert Advisors. With Strategy Tester you can optimise the parameters of your EA to review which settings are the most profitable. This is not possible with Indicators as they do not have actual trade signals for Strategy Tester to invoke trade stats. With Indicator Combine you can enter the parameter settings of your indicator and see what impact it has on the profit/loss e.g. calc lookback parameter default of an indicator is 13, but what happens if you set it at 9 or 5 or 15? These stats are updated instantly without running it through Strategy Tester. Just remember if it does re-/backpaint it would be wise to run (no pun intended) again through Strategy Tester with Indicator Merge running concurrently.

I actually now test EVERY indicator through Strategy Tester with IC, it is mind blowing how many programmers manipulate the signals to show great signals in the past, just to realise when running them live, the signals are not even close to what they indicated in history. There are very few exceptions..

推荐产品
VR Cub
Vladimir Pastushak
VR Cub 这是获得高质量切入点的指标。该指标的开发是为了促进数学计算并简化对仓位入场点的搜索。多年来,该指标所针对的交易策略已被证明其有效性。交易策略的简单性是其巨大的优势,即使是新手交易者也能成功进行交易。 VR Cub 计算开仓点以及获利和止损目标水平,这显着提高了效率和易用性。查看使用以下策略进行交易的屏幕截图,了解简单的交易规则。 设置、设置文件、演示版本、说明、问题解决,可以从以下位置获取 [博客] 您可以在以下位置阅读或撰写评论 [关联] 版本为 [MetaTrader 5] 计算入场点的规则 开仓 要计算入场点,您需要将 VR Cub 工具从最后一个高点拉伸到最后一个低点。 如果第一个点在时间上早于第二个点,交易者等待柱线收于中线上方。 如果第一个点在时间上晚于第二个点,交易者等待柱线收于中线下方。 根据上述条件,严格在 柱线收盘 后建仓。 换句话说,如果我们在小时图上进行交易,那么从最高点到最低点的时间距离必须超过24小时,最高点和最低点之间的点数必须大于或等于平均价格变动每天。 维持和改变市场地位 可以有多个未平仓头寸;每个头寸都可以单独修改。 VR Cub
Alpha Trend sign Alpha Trend sign 是我么长期以来非常受欢迎的交易工具,它可以验证我们的交易系统,并且明确的提示交易信号,并且信号不会漂移。 主要功能: •  根据市场显示活跃区域,根据指标可以很直观的判断当前行情是属于趋势行情,还是震荡行情。    并根据指标的指示箭头切入市场,绿色箭头提示买入,红色箭头提示卖出。 •  建议使用5分钟以上的时间周期进行交易,避免因为小周期波动出现频繁的交易信号。 •  您也可以开启信号提示,以免错过最佳的交易时机。 •  本指标不但可以很好的预测趋势行情,也可以在宽幅震荡行情中获利。 •  本指标本着大道至简的原则,适合不同阶段的交易者使用。 注意事项: •  Alpha Trend sign 有明确的进出场信号,不建议逆势操作,以免造成损失。 •  Alpha Trend sign 是特别成熟的指标,我们团队人手一个,使用它可以实现稳定盈利。     
Infinity Trend Pro
Yaroslav Varankin
1 (1)
This is a trend indicator without redrawing Developed instead of the binary options strategy (by the color of the Martingale candlestick) Also works well in forex trading When to open trades (binary options) A signal will appear in the place with a candle signaling the current candle It is recommended to open a deal for one candle of the current timeframe M1 and M5 When a blue dot appears, open a deal up When a red dot appears, open a trade down. How to open trades on Forex. When a signal is rec
ProTrading Arrow
Nedyalka Zhelyazkova
5 (1)
" A NEW TRADING METHOD… AN AMAZING TRADING INDICATOR! " Additional Bonus : You get the Forex Trend Commander indicator for FREE! It should not be forgotten that trading is not an event, but a process. This process has no end, i.e. it should never stop completely and completely. To lock in a profit from market movements you need to implement the strategy in practice, in most cases it takes much longer than planning it. ProTrading Arrow indicator is an advanced reversal system that can be played
Chart Patterns Detect 15 patterns (Ascending Triangle, Descending Triangle, Rising Wedge, Falling Wedge, Bullish Flag, Bearish Flag, Bullish Rectangle, Bearish Rectangle Symmetrical triangle, Head and Shoulders, Inverted Head and Shoulders, Triple top, Triple Bottom, Double Top, Double Bottom) Use historical data to calculate the probability of each pattern to succeed (possibility to filter notification according to the chance of success) gives graphic indication about the invalidation level and
CISD FVG and IFVG ICT Indicator MT4 The CISD – CSD + FVG – IFVG indicator is an advanced ICT-based tool designed to identify CISD levels using Fair Value Gap (FVG) and Inverse Fair Value Gap (IFVG) . Built for MetaTrader 4 , this liquidity indicator dynamically maps CISD zones with directional arrow signals. These Change in Delivery Price (CISD) levels help traders understand market shifts and trend developments in real time.   CISD – CSD + FVG – IFVG Indicator Specifications Below is a summary
FREE
Owl smart levels
Sergey Ermolov
4.24 (37)
MT5版本  |  FAQ Owl Smart Levels Indicator   是一個完整的交易系統,包含   Bill Williams   的高級分形、構建正確的市場波浪結構的 Valable ZigZag 以及標記準確入場水平的斐波那契水平等流行的市場分析工具 進入市場和地方獲利。 策略的详细说明 指示灯使用说明 顾问-贸易猫头鹰助手助理 私人用户聊天 ->购买后写信给我,我会将您添加到私人聊天中,您可以在那里下载所有奖金 力量在於簡單! Owl Smart Levels   交易系統非常易於使用,因此適合專業人士和剛開始研究市場並為自己選擇交易策略的人。 策略和指標中沒有隱藏的秘密公式和計算方法,所有策略指標都是公開的。 Owl Smart Levels 允許您快速查看進入交易的信號,突出顯示下訂單的水平並向您發送有關已出現信號的通知。 優點很明顯: 清楚地顯示主要和更高時間框架的趨勢方向。 指示儀器信號的出現。 標記開單、止損設置和固定利潤的水平。 沒有多餘的,只有必要的結構! ZigZag   表示全球趨勢的方向,因此也表示貿易方向。 市場反轉點的短線清楚地表明在什
Insider Scalper Binary This tool is designed to trade binary options. for short temporary spends. to make a deal is worth the moment of receiving the signal and only 1 candle if it is m1 then only for a minute and so in accordance with the timeframe. for better results, you need to select well-volatile charts.... recommended currency pairs eur | usd, usd | jpy .... the indicator is already configured, you just have to add it to the chart and trade .... The indicator signals the next candle.
Trendiness Index
Libertas LLC
5 (3)
"The trend is your friend" is one of the best known sayings in investing, because capturing large trendy price movements can be extremely profitable. However, trading with the trend is often easier said than done, because many indicators are based on price reversals not trends. These aren't very effective at identifying trendy periods, or predicting whether trends will continue. We developed the Trendiness Index to help address this problem by indicating the strength and direction of price trend
Indicador Taurus All4
Fabio Oliveira Magalhaes
Taurus All4 Taurus All4 is a high-performance indicator, it will tell you the strength of the trend, and you will be able to observe the strength of the candle. Our indicator has more than 4 trend confirmations. It is very simple and easy to use. Confirmation Modes Candle Trend Confirmations: When the candle switches to light green the trend is high. When the candle switches to light red the trend is reverting down. When the candle changes to dark red the trend is low. Trendline Trend Confirm
PipFinite Trend PRO
Karlo Wilson Vendiola
4.88 (2247)
Breakthrough Solution For Trend Trading And Filtering With All Important Features Built Inside One Tool! Trend PRO's smart algorithm detects the trend, filters out market noise and gives entry signals with exit levels. The new features with enhanced rules for statistical calculation improved the overall performance of this indicator. Important Information Revealed Maximize the potential of Trend Pro, please visit www.mql5.com/en/blogs/post/713938 The Powerful Expert Advisor Version Automatin
Auto Fibo Pro m
DMITRII GRIDASOV
“Auto FIBO Pro” Crypto_Forex 指标 - 是交易中的绝佳辅助工具! - 指标自动计算并放置在图表斐波那契水平和局部趋势线(红色)上。 - 斐波那契水平指示价格可能反转的关键区域。 - 最重要的水平是 23.6%、38.2%、50% 和 61.8%。 - 您可以将其用于反转剥头皮或区域网格交易。 - 还有很多机会可以使用 Auto FIBO Pro 指标来改进您当前的系统。 - 它具有信息价差掉期显示 - 它显示所连接的外汇对的当前价差和掉期。 - 显示屏还显示账户余额、净值和保证金。 - 可以将信息价差掉期显示定位在图表的任何角落: 0 - 左上角,1 - 右上角,2 - 左下角,3 - 右下角。 // 出色的交易机器人和指标可在此处获得: https://www.mql5.com/en/users/def1380/seller 这是仅在此 MQL5 网站上提供的原创产品。
Alpha Trend
Evgeny Belyaev
3.33 (3)
Alpha Trend is a trend indicator for the MetaTrader 4 platform; it has been developed by a group of professional traders. The Alpha Trend indicator finds the most probable tendency reversal points, which allows making trades at the very beginning of a trend. This indicator features notifications, which are generated whenever a new signal appears (alert, email, push-notification). This allows you to open a position in a timely manner. Alpha Trend does not redraw, which makes it possible to evalua
Fourteen plus nine TD Sequential
MOHAMMED IMAD HUSSEIN BASSEE
Fourteen plus nine What is it for? Applying Tom DeMark’s TD Sequential serves the purpose of identifying a price point where an uptrend or a downtrend exhausts itself and reverses. . What are the main components of TD Sequential? TD Sequential has two parts – TD Setup and TD Countdown. The first phase of TD Sequential starts with a TD Setup and is completed with a 9 count. When the 9 count is completed, it is at that point, a price pause, price pullback, or reversal is likely. It is also at tha
Trend Oscillator mw
DMITRII GRIDASOV
趋势振荡器 - 是一种高级自定义 Crypto_Forex 指标,高效的交易工具! - 使用高级新计算方法 - 参数“计算价格”有 20 个选项。 - 有史以来最平滑的振荡器。 - 绿色表示上升趋势,红色表示下降趋势。 - 超卖值:低于 5,超买值:超过 95。 - 使用此指标,有很多机会升级标准策略。 - 具有 PC 和移动警报。 .................................................................................................................... // 出色的交易机器人和指标可在此处获取: https://www.mql5.com/en/users/def1380/seller 这是仅在此 MQL5 网站上提供的原创产品。
Mega Indicator MT4
Szymon Palczynski
Price reach indicator. It also serves as the perfect term for supports and resistance. I use it in two experts. The basic tool for professional trading. The indicator analyzes the last 500 bar and uses this to determine the levels ( but it doesn't predict the future ) . Personally, I use it on TF H1.  It is very simple. Four lines on chart and that's all. Only two input parameters.  Thousands of indicators. Why this? Is good ? No! Is very good. Please test the indicator prior to purchasing.
Smart Reversal Signal
Evgeny Belyaev
3 (2)
Smart Reversal Signal  is a professional indicator for the MetaTrader 4 platform; it has been developed by a group of professional traders. This indicator is designed for Forex and binary options trading. By purchasing this indicator, you will receive: Excellent indicator signals. Free product support. Regular updates. Various notification options: alert, push, emails. You can use it on any financial instrument (Forex, CFD, options) and timeframe. Indicator Parameters Perod - indicator calculat
WanaScalper MT4
Isaac Wanasolo
1 (1)
A scalping indicator based on mathematical patterns, which on average gives signals with relatively small SL, and also occasionally helps to catch big moves in the markets (more information in the video) This indicator has three main types of notifications: The first type warns of a possible/upcoming signal on the next bar The second type indicates the presence of a ready signal to enter the market/open a position The third type is for SL and TP levels - you will be notified every time price re
Next level of trend trading here. Possibility 75%, the indicator analyzes the current market to determine short (small dot), middle (circle with a dot inside) and long (cross with a circle and a dot inside) trends.  Wingdings characters of  Aqua color represents the beginning of the UP trend. Wingdings characters of  Orange color represents the beginning of the DOWN trend. Possibility 75% Indicator will improve your trading in the world of forex, commodities, cryptocurrencies and indices.
Stepping Trend
Mpendulo Chiliza
The Stepping Trend Indicator     The Steppi ng Trend indicator uses the  average true range  (ATR indicator) in its calculation. This gives you control to set your own average true range period, I set the Default as 10.   Indicator Details. Green Arrow Up: This means you are at the starting point of a new bullish trend, it’s time to buy.   Red  Arrow  Down : This means you are at the starting point of a new  bearish  trend, it’ s time to sell .   What if you miss the Arrow Signal?   No prob
ZhiBiCCI MT4
Qiuyang Zheng
【ZhiBiCCI】指标适合所有的周期使用,也适合所有的市场品种。 【ZhiBiCCI】绿色实线是逆转看涨背离。绿色虚线是经典的看涨背离。 【ZhiBiCCI】向红色实线是反向看跌背离。红色虚线是古典看跌背离。 【ZhiBiCCI】可以在参数里面设置(Alert、Send mail、Send notification),设置为(true)就可以发送即时信号到警报窗口、电子邮件、即时消息。 参数设置说明: 【displayAlert】:这是警报开关,设置成true,如果出现箭头就会自动警报提示;设置成false,则不会警报提示。 【sendmail_NO_OFF】:这是发送邮件的开关,设置成true,如果出现箭头就会发送邮件到你在MT4设置好的邮箱里面;设置成false,则不会发邮件。 【sendnotification_NO_OFF】:这是发送即时消息的开关,设置成true,如果出现箭头就会发送消息到你的移动设备;设置成false,则不会发消息。 更多好用的指标网址: https://www.mql5.com/en/users/zhengqiuyang/seller
Crypto_Forex 指标“带动态超卖/超买区域的强力指数”适用于 MT4,无需重绘。 - 强力指数是将价格和成交量数据合并为一个值的顶级指标之一。 - 从动态超买区域进行卖出交易,从动态超卖区域进行买入交易,效果非常好。 - 该指标非常适合将动量交易纳入趋势方向。 - 动态超买区域 - 高于黄线。 - 动态超卖区域 - 低于蓝线。 - 强力指数本身是强大的振荡器 - 可测量用于移动价格的能量。 - 带有 PC 和移动警报。 ................................................................................................................. // 出色的交易机器人和指标可在此处获得: https://www.mql5.com/en/users/def1380/seller 它是仅在此 MQL5 网站上提供的原创产品。
SystemBinaryM1
Andrey Spiridonov
SystemBinaryM1 - a professional indicator for trading short-term binary options, is a complete, self-contained author's strategy for working in the binary options market. The unique algorithm for analyzing the foreign exchange market is based on the calculation of reference points on three different time periods M15, M5. M1. Thus, the indicator simultaneously analyzes the long-term, medium-term and short-term price behavior before issuing a signal. The indicator is set in the usual way and work
Super Reversal Pattern
Parfait Mujinga Ndalika
Super Reversal Pattern Indicator Unlock the power of advanced pattern recognition with our Super Reversal Pattern Indicator. Designed for traders seeking precision and reliability, this indicator identifies one of the most effective reversal patterns in technical analysis, offering a significant edge in your trading strategy. Key Features: Non-Repainting Accuracy: Enjoy the confidence of non-repainting technology. Once a Super Reversal Pattern is detected, it remains static, providing consiste
The Th3Eng PipFinite indicator is based on a very excellent analysis of the right trend direction with perfect custom algorithms. It show the true direction and the best point to start trading. With StopLoss point and Three Take Profit points. Also it show the right pivot of the price and small points to order to replace the dynamic support and resistance channel, Which surrounds the price. And Finally it draws a very helpful Box on the left side on the chart includes (take profits and Stop loss
PABT Pattern Indicator - it's classical system one of the signal patterns. Indicator logic - the Hi & Lo of the bar is fully within the range of the preceding bar, look to trade them as pullback in trend. In the way if indicator found PABT pattern it's drawing two lines and arrow what showing trend way.  - First line - it's entry point and drawing at: 1. On the high of signal bar or on middle of the signal bar (depending from indicator mode) for buy; 2. On the low of signal bar or on middle of t
Advanced Trend Regime
Shellard Securities (Pty) Ltd
The indicator has been designed to function on any time-frame and any pair.   This regime filter will help the trader better evaluate whether the current market is trending, and in which direction. It quickly reacts to changes in market dynamics using a series of advanced calculations. The user is able to select whether the calculation remains standard, or if a further filter constraint is added to the calculation.   A Yellow moving average of the signal has been included for the trader to smoot
Laser Trend
Nicolas Zouein
The trend is your friend! This is what this indicator is all about. Follow this famous saying and be safe. Characteristics: Buy/Sell signals fixed on the close of a bar. Works on all symbols and all timeframes. Clear visual market trend laser line, Buy/Sell signal arrows, market strength meter, TP1 & TP2 boxes. Visual signals when to enter, when to exit the market. No repainting. Compatible with Flexible EA for trading automation. (Ask for a free set file optimized to perform 2010-2018) Parame
Atomic Analyst
Issam Kassas
5 (2)
首先值得强调的是,该交易指标是非重绘、非延迟的指标,这使其成为手动和机器人交易的理想选择。 用户手册:设置、输入和策略。 Atomic Analyst是一种PA价格行动指标,利用价格的力量和动量来寻找市场上更好的机会。配备了高级过滤器,可帮助去除噪音和假信号,并提高交易潜力。使用多层复杂的指标,Atomic Analyst扫描图表,并将复杂的数学计算转化为任何初学者都能理解并用来做出一致交易决策的简单信号和颜色。 “Atomic Analyst”是专为新手和经验丰富的交易者量身定制的综合交易解决方案。它将高级指标和一流功能融合为一体的交易策略,使其成为所有类型交易者的多功能选择。 日内交易和剥头皮策略:专为快速准确的日内交易和短期交易而设计。 日内和摆动交易策略:可用作追求价格大幅波动的日内和摆动交易者的可靠工具。 多货币和市场:凭借其可靠的精度,在不同的工具和市场上运作。 多个时间框架:可在多个时间框架上使用,性能良好。 稳定性:所有指标均不重绘、不重绘和不滞后,确保可靠的信号。 信号清晰度:提供箭头信号,用于清晰的入场和出场点。 实时警报:通过交易入场、SL和TP警报通知交易者
该产品的买家也购买
Cycle Maestro
Stefano Frisetti
NOTE: CYCLEMAESTRO is distributed only on this website, there are no other distributors. Demo version is for reference only and is not supported. Full versione is perfectly functional and it is supported CYCLEMAESTRO , the first and only indicator of Cyclic Analysis, useful for giving signals of TRADING, BUY, SELL, STOP LOSS, ADDING. Created on the logic of Serghei Istrati and programmed by Stefano Frisetti ; CYCLEMAESTRO is not an indicator like the others, the challenge was to interpret only t
TPSpro RFI Levels
Roman Podpora
4.85 (27)
反转区域 / 峰值交易量 / 主要参与者的活跃区域 =       TS TPSPRO系统 俄语使用说明     /       指示     英语     /       Version MT5 该指标的每位购买者还可免费获得: 6 个月内可访问 RFI SIGNALS 服务的交易信号 - 根据 TPSproSYSTEM 算法准备的切入点。 定期更新的培训材料 - 让您沉浸在策略中并提高您的专业水平。 工作日每天 24 小时提供支持,并可以访问封闭的交易者聊天室 - 沟通、协助和市场情况分析。 作者设定的文件——自动指标设置,无需额外努力即可实现最大效果。 主要功能: 显示卖家和买家的活跃区域! 指标显示所有正确的买入和卖出第一脉冲水平/区域。当这些水平/区域被激活时,即开始寻找切入点的地方,水平会改变颜色并填充特定颜色。还会出现箭头,以便更直观地了解情况。 LOGIC AI - 激活模板时显示用于搜索入口点的区域(圆圈) 为了提高视觉清晰度,添加了使用人工智能搜索入口点的显示区域的功能。 显示更高时间范围内的级别/区域(MTF 模式) 添加了使用更高时间间隔显示级别/区域的功能
目前八折优惠! 对任何新手或专家交易者来说都是最好的解决方案! 这个仪表板软件适用于28种货币对。它基于我们的两个主要指标(高级货币强度28和高级货币冲动)。它对整个外汇市场提供了一个伟大的概述。它显示高级货币强度值,货币运动速度和28个外汇对在所有(9)时间段的信号。想象一下,当你可以使用图表上的单一指标观察整个市场,以确定趋势和或剥头皮的机会时,你的交易将得到改善 我们已经在这个指标中建立了一些功能,使你更容易识别强势和弱势货币,同时识别和确认潜在的交易。该指标以图形方式显示货币的强势或弱势是增加还是减少,以及它在所有时间段的表现。 增加的新功能是动态市场斐波那契水平,它适应当前的市场条件变化,这是一个已经在我们的高级货币强度28和高级货币冲动指标中使用的成熟的加分项。 在交易时,总是将弱势货币和强势货币配对,这个新指标将帮助你做到这一点。 用户手册:点击这里  https://www.mql5.com/en/blogs/post/708783 特点  显示每个时间段的ACS28和GAP-speed(冲动)的货币强度值。 列:颜色代码以7种颜色显示货币强度:强势
StalkeR Arrow
Abdulkarim Karazon
5 (3)
StalkeR Arrow 是一个箭头指标,可在柱形开盘/柱内发出买入和卖出信号,该指标基于价格行为模式和分形 该指标为每个买入和卖出信号提供 tp 和 sl ,tp 和 sl 以线的形式出现在每个信号的上方和下方,它们会延伸直至形成新的信号。 该指标具有回溯测试面板/仪表板,可提供历史信号的赢/输统计数据,该指标不会重新绘制或背面绘制。 参数 : StalkeR 周期:箭头周期,数字越大,信号越少 spread : 将使用以点为单位的点差值来计算面板上的盈利和亏损 止损 ATR x : atr 乘法中的止损值 止盈 ATR x : atr 乘法中的 TP 值 ATR period : 用于计算 tp 和 sl 的 atr 周期 TP/SL 线颜色和宽度 箭头颜色和宽度 面板/仪表板位置。 警报/电子邮件/通知
Dynamic Forex28 Navigator
Bernhard Schweigert
5 (5)
Dynamic Forex28 Navigator - 下一代外汇交易工具。 当前 49% 折扣。 Dynamic Forex28 Navigator 是我们长期流行的指标的演变,将三种功能合二为一: 高级货币强度 28 指标 (695 条评论)+ 高级货币 IMPULSE 带警报 (520 条评论)+ CS28 组合信号(奖励)。 有关指标的详细信息 https://www.mql5.com/en/blogs/post/758844 下一代强度指标提供什么? 您喜欢的原始指标的一切,现在通过新功能和更高的精度进行了增强。 主要特点: 专有货币强度公式。  所有时间范围内的平滑和准确的强度线。 非常适合识别趋势和精确进入。 动态市场斐波那契水平(市场斐波那契)。  此指标独有的独特功能。 斐波那契应用于货币强度,而不是价格图表。 适应实时市场活动以获得准确的反转区域。 实时市场动量。  第 9 行显示市场是活跃还是被动。 对于定时交易至关重要。 全面的警报和显示。  每种货币最强的买入和卖出动量。 ​​28 对的双重动量买入和卖出。 超买/超卖警告外部范围和止损。 反转
Hit Rate Top Bottom Signal
Martin Alejandro Bamonte
命中率顶部底部信号 命中率顶部底部信号 命中率顶部底部信号 提供了一种完全创新的方法。 它非常适合那些希望预先评估信号在特定 TP-SL 下的表现以及在哪些货币对/时间框架(TF)中效果最佳的人。 命中率顶部底部信号 策略是 任何交易员和任何交易类型 的重要工具,因为它不仅发出 精确且不重绘的信号 ,明确指示何时交易以及交易方向,而且还 详细记录每个货币对和时间框架的命中率 ,并预设止盈(TP)和止损(SL)。 这使得能够提前知道信号的有效性比率 ,对于良好的风险管理和精确的交易至关重要。 该策略的独特之处在于它专注于在波动的反转点进行检测,而不是在整个行情中,这使得信号的发出频率比传统的顶部底部信号更高,专注于 市场每一个重要波动的关键时刻。 这种以百分比显示 信号历史效果与SL/TP比率结合的能力 使得这项策略成为安全交易的最佳选择,让交易员能够基于数据做出决策。 依靠一个不仅清晰直接而且历史记录良好的信号,我们正在使用市场上最好的策略之一。 如何使用该系统进行交易? 打开多个货币对并在每个货币对上加载指标。现在,分析每个货币对,以确定哪些货币对和时间框架(TF)信号效果
System Trend Pro
Aleksandr Makarov
5 (2)
Special offer! https://www.mql5.com/ru/users/bossik2810 System Trend Pro - This is the best trend trading indicator!!! The indicator no repaint!!!  The indicator has   MTF   mode, which adds confidence to trading on the trend (   no repaint   ). How to trade? Everything is very simple, we wait for the first signal (big arrow), then wait for the second signal (small arrow) and enter the market in the direction of the arrow. (See screens 1 and 2.) Exit on the opposite signal or take 20-30 pips,
IQ Gold Gann Levels
INTRAQUOTES
5 (1)
IQ Gold Gann Levels a non-repainting, precision tool designed exclusively for XAUUSD/Gold intraday trading. It uses W.D. Gann’s square root method to plot real-time support and resistance levels, helping traders spot high-probability entries with confidence and clarity. William Delbert Gann (W.D. Gann) was an exceptional market analyst, whose trading technique was based on a complex blend of mathematics, geometry, astrology, and ancient mathematics which proved to be extremely accurate. Download
Introducing the Delta Volume Profile Indicator - Unleash the Power of Institutional Precision!  https://youtube.com/shorts/znUdz5PEBAY Technical Indicator: Are you ready to trade like the pros? The Delta Volume Profile Indicator is no ordinary tool. It’s a high-precision, cutting-edge indicator that puts the power of institutional-grade trading in your hands. This unique indicator analyses delta volume distribution in real-time, revealing the market's hidden buy/sell imbalances that the biggest
TrendMaestro
Stefano Frisetti
4 (4)
note: this indicator is for METATRADER4, if you want the version for METATRADER5 this is the link:  https://www.mql5.com/it/market/product/108106 TRENDMAESTRO ver 2.4 TRENDMAESTRO recognizes a new TREND in the bud, he never makes mistakes. The certainty of identifying a new TREND is priceless. DESCRIPTION TRENDMAESTRO identifies a new TREND in the bud, this indicator examines the volatility, volumes and momentum to identify the moment in which there is an explosion of one or more of these data a
Enigmera
Ivan Stefanov
5 (7)
ENIGMERA: 市场的核心 重要提示:MQL5.com 演示版本在策略测试器中运行,可能无法完全反映 Enigmera 的功能。请查看描述、截图和视频了解详细信息。如有任何问题,请随时联系我! 该指标的代码已完全重写。版本 3.0 增加了新功能并修复了自指标发布以来积累的错误。 简介 这个指标和交易系统是金融市场的一种独特方法。ENIGMERA 使用分形周期来精确计算支撑和阻力水平。它展示了真实的积累阶段,并提供了方向和目标。无论是在趋势中还是在修正中,这个系统都能工作。 它是如何工作的 指标的大部分功能通过图表左侧的按钮控制,使得能够快速响应不同的市场情况。 按钮 ON/OFF – 显示或隐藏整个指标。 Channel – 激活支撑通道,显示可接受的偏差范围。 Dev1 (第一偏差) – 指示价格在支撑偏差内的波动,信号表示市场正在整合或积累力量。 Dev2 (第二偏差) – 显示价格在偏差之间的波动,表示趋势形成和方向。 Dev3 (第三偏差) – 表示趋势的显著加速和高波动性。 45deg (45度) – 显示市场的节奏和相对于 45 度线的运动稳定性。 Tgt1/2
Smart Set up leve l is a very powerful indicator based on the concept of order blocks and set up entries with proper fvg and breakouts to make a very nice level to enter like a pro trader. Very easy to use interface and friendly to enter on buy and sell signals. Works Best on M15 Time frame on Gold, Bitcoin and Fx pairs. Daily 4-5 trades on each pair  Works great on gold like a pro on M15 It is non repainting nor lagging It is very powerful indicator giving precise entries and prop acts can be c
IQ FX Gann Levels
INTRAQUOTES
5 (2)
IQ FX Gann Levels a precision trading indicator based on W.D. Gann’s square root methods. It plots real-time, non-repainting support and resistance levels to help traders confidently spot intraday and scalping opportunities with high accuracy. William Delbert Gann (W.D. Gann) was an exceptional market analyst, whose trading technique was based on a complex blend of mathematics, geometry, astrology, and ancient mathematics which proved to be extremely accurate. Download the Metatrader 5 Version M
NAM Order Blocks
NAM TECH GROUP, CORP.
3 (2)
MT4多時限訂單塊檢測指示器。 特徵 -在圖表控制面板上完全可自定義,提供完整的交互。 -隨時隨地隱藏和顯示控制面板。 -在多個時間範圍內檢測OB。 -選擇要顯示的OB數量。 -不同的OB用戶界面。 -OB上的不同過濾器。 -OB接近警報。 -ADR高低線。 -通知服務(屏幕警報|推送通知)。 概括 訂單塊是一種市場行為,它指示從金融機構和銀行收取訂單。著名的金融機構和中央銀行帶動了外匯市場。因此,交易者必須知道他們在市場上正在做什麼。當市場建立訂單塊時,它會像發生大多數投資決策的範圍一樣移動。 訂單建立完成後,市場將朝著上升和縮小的方向發展。訂單大宗交易策略的關鍵術語是它包括機構交易者正在做的事情。由於它們是主要的價格驅動因素,因此包括機構交易在內的任何策略都可以。 您將在任何時間範圍內實時看到訂單塊,使用我們的控制面板,您將能夠在所選的歷史記錄週期內檢測常規,拒收和未大寫的訂單塊。 現在您可以接收到訂單塊接近警報,我們在MT4上顯示屏幕通知,並將通知推送到您的手機!
Binary Stalker
Abdulkarim Karazon
3.67 (3)
---> 价格上涨后,接下来的 5 位买家可享受 10% 折扣 <--- Binary Stalker 是一个基于 adx 的指标,可为任何到期的二元期权经纪商提供看涨期权和看跌期权信号,该指标不可重新绘制,并且附带一个仪表板,显示以下内容:1-胜率 - 2-赢家 - 3- 输家 - 4 - 获胜者排 - 5. 输家排 , 建议时间范围:任意 调用:绿点出现在新开盘蜡烛上,到期日为该蜡烛结束时 put : 橙色点出现在新开盘蜡烛上,到期日为该蜡烛结束时 请注意,在某些情况下,信号会在高波动期间延迟,因为 adx 交叉可能会在蜡烛期间稍后发生,请跳过这些信号。 ===================================================== =====================================================
Linear Trend Predictor — 结合切入点和方向支撑线的趋势指标。按照突破高/低价通道的原理运作。该指标算法过滤市场噪音,考虑波动性和市场动态。 指示器功能  使用平滑方法,显示市场趋势和开立买入或卖出订单的切入点。  适合通过分析任何时间范围内的图表来确定短期和长期的市场走势。  输入参数可适应任何市场和时间范围,允许交易者独立定制指标。  设定的指示信号不会消失,也不会重新绘制——它是在蜡烛收盘时确定的。  几种类型的通知以箭头组合。  该指标既可以作为独立的交易系统使用,也可以作为其他交易系统的补充。  可供任何经验水平的交易者使用。 主要参数 Volatility Smoothing Level - 指标的主要参数,允许您配置指标以实现舒适的操作。 它的数字范围是 1 到 100,从而增加了您可以获得更长趋势运动的平滑度。 通过少量的数字,您可以获得短期走势并快速退出交易。 使用指标进行交易的时刻:  红线和箭头表示下降趋势和卖出开盘信号。止损应根据前一个上分形来设置。  黄线和箭头表示上升趋势和买入开盘信号。止损应根据前一个下分形来设置。
RelicusRoad Pro
Relicus LLC
4.63 (104)
RelicusRoad 用户手册 + 培训视频 + 访问 Private Discord Group + VIP 身份 一种看待市场的新方式 RelicusRoad 是世界上最强大的外汇、期货、加密货币、股票和指数交易指标,为交易者提供保持盈利所需的所有信息和工具。我们提供技术分析和交易计划,帮助每一位交易者取得成功,从初学者到高级。它是一个关键的交易指标,可以提供足够的信息来预测未来的市场。我们相信一个完整的解决方案,而不是图表上几个没有意义的不同指标。这是一个多合一指标,显示无与伦比且非常准确的信号、箭头 + 价格行为信息。 RelicusRoad 基于强大的人工智能,提供缺失的信息和工具来教育您并使您成为交易专家,成为成功的交易者。 几乎所有技术指标都滞后,这意味着它们只能报告已经发生的事情。因此,他们只确认您过去可以看到的价格已经在哪里。我们相信领先指标可以预测未来价格,而无需重新绘制,也不要过度依赖可能改变并导致重新绘制的滞后指标。如果您根据滞后指标进行交易并建立头寸,您就知道您已经大部分时间在赌博。我们相信,在您考虑建仓之前,您需要了解市场并了解价格变动的位置和原
AT Forex Indicator MT4
Marzena Maria Szmit
5 (3)
The AT Forex Indicator MT4 is a sophisticated trading tool designed to provide traders with a comprehensive analysis of multiple currency pairs. This   powerful indicator   simplifies the complex nature of the forex market, making it accessible for both novice and experienced traders. AT Forex Indicator uses   advanced algorithms   to detect trends, patterns and is an essential tool for traders aiming to enhance their forex trading performance. With its robust features, ease of use, and reliabl
Binary Guru
Sahil Shokeen
1 (2)
Beast Super Signal
Dustin Vlok
4.73 (89)
正在寻找可以帮助您轻松识别有利可图的交易机会的强大外汇交易指标? Beast Super Signal 就是您的不二之选。 这个易于使用的基于趋势的指标持续监控市场状况,寻找新的发展趋势或跳入现有趋势。当所有内部策略一致且彼此 100% 融合时,Beast Super Signal 会发出买入或卖出信号,无需额外确认。当您收到信号箭头警报时,只需买入或卖出。 购买后给我留言,让我加入我的私人 VIP 群组! (仅限购买完整产品)。 购买后给我发消息以获取最新的优化设置文件。 此处提供 MT5 版本。 在此处 获取 Beast Super Signal EA。 查看评论部分以查看最新结果! Beast Super Signal 根据您偏好的 1:1、1:2 或 1:3 风险回报率建议入场价、止损和获利水平,让您放心交易。这个 Beast Super Signal 是 100% 不可重新绘制的,这意味着它永远不会重新计算或重新绘制,每次都能为您提供可靠的信号。 Beast Super Signal 指标适用于所有时间范围,包括货币对、指数、商品和加密货币对。 Beast Su
PTS Precision Index Oscillator V2
PrecisionTradingSystems
5 (1)
精密指数振荡器(Pi-Osc)由Precision Trading Systems的Roger Medcalf开发 版本2经过精心重新编码,以在您的图表上加载速度非常快,还加入了一些其他技术改进,以提高体验。 Pi-Osc旨在提供准确的交易定时信号,旨在找到极端的耗尽点,这些点是市场被迫去触及,以清理每个人的止损单。 该产品解决了一个古老的问题,即知道极端点在哪里,这使得交易员的生活变得更加简单。 这是一个高度复杂的共识指标,与行业标准的振荡器相比,具有一些强大的区别。 它使用的一些特征包括需求指数、资金流动、RSI、随机指标、模式识别、成交量分析、标准偏差极端点以及不同长度上述各种变化的分歧。 乍一看,对于未经培训的人来说,它似乎与任何其他振荡器没有什么不同,但当与其他振荡器(如RSI或动量等)相对比时,这个指标的真正威力开始显现。 据我所知,没有其他振荡器可以频繁地精确指出顶部和底部,具有相同的定期效率。 精密指数振荡器由许多不同的数学方程组成,用于测量多个时间框架采样中的价格和成交量变动,从而高度准确地预测趋势可能发生转折的位置。 PTS Pi-Osc V2非
Max Min Cycle
Vitalyi Belyh
Cyclical indicator for trading and predicting the direction of the market. Shows the cyclical behavior of the price in the form of an oscillator. Gives signals for opening deals when rebounding from the upper and lower boundaries of the oscillator. In the form of a histogram, it shows the smoothed strength of the trend. Will complement any trading strategy, from scalping to intraday. The indicator does not redraw. Suitable for use on all symbols/instruments. Suitable time frames for short-term t
Order Blocks ICT Multi TF MT4
Diego Arribas Lopez
5 (2)
[ MT5 Version ]  [ Kill Zones ]  [ SMT Divergences ] How to trade using Order Blocks:  Click here User Interface Performance:  During testing in the strategy tester, the UI may experience lag. Rest assured, this issue is specific to the testing environment and does not affect the indicator's performance in live trading. Elevate your trading strategy with the  Order Blocks ICT Multi TF  indicator, a cutting-edge tool designed to enhance your trading decisions through advanced order block analys
PTS Divergence Sell Finder V2
PrecisionTradingSystems
PTS Divergence Finder Sell Indicator(Roger Medcalf出品) - Precision Trading Systems。 该指标只提供看跌 - 卖出信号。 首先,我多次被问及为什么多年来一直提供买入信号的差异指标,而没有提供卖出差异指标。 我回答说,卖出差异信号不如买入差异信号可靠,这仍然是事实。 我们找到了一些解决办法,不是屈服于同行的压力,也不是修改我在十五年前制作的这个指标,而是通过更改默认设置来使其更加严格。 PTS差异查找器卖出指标是如何工作的? PTS差异查找器卖出指标准确测量了发生在需求指数中的差异数量,这是一个基于成交量的指标。由于MT4提供的是交易量而不是成交量,因此基础需求指数指标中发生的波动大约要小10倍,因此必须减小下面所述的差异输入。 这是一个子图二的柱状图样式指标,它绘制出看起来像是从底部升起的石笋一样的尖峰。 该指标检查了您指定的长度的基于成交量的需求指数指标的多个回溯期。它找到了价格中的高点,其中DI没有形成新的“局部”高点,并且与您输入的“差异”设置相差较远。 在众多人投票市场方向的流动市场中,效果最好。 每
PTS Divergence Buy Finder
PrecisionTradingSystems
PTS - Divergence Buy Finder 由Precision Trading Systems制作 Precision Divergence Finder旨在精确找到市场底部,并经常成功。在技术分析中,挑选底部通常比挑选顶部容易得多,这个工具正是为了完成这个任务而设计的。在识别出牛市背离后,等待趋势上升再购买是明智的。您可以使用10或20个周期的最高点进场,或者使用15-30周期的移动平均线上升来识别趋势变化。 这个复杂的算法会实时逐根柱状图寻找并计算活跃的需求指数背离的数量。 该模型观察市场价格何时创出新低,而需求指数未创新低,从而产生背离。 该指标使用两个设置。     • 需求指数(DI)长度,它将为指标提供寻找的对象,并将为您选择的长度上的任何DI背离进行查找。     • 差异,这是[DI值现在]与[DI值长达200个周期以前]之间的背离量,对于它从各种回望期间找到的每个背离,它将在指标窗口中生成[1]输出。 最多检查20个周期,最大输出值将显示为20。 建议的设置 需求指数长度从15到100都可以使用,但最佳范围在20到60之间。 背离的差异为0.1至20
POWR Rise Coming
Trade Indicators LLC
This indicator is SO SIMPLE… when the green Rise Coming arrow appears, a price drop may be on the way! Plain and easy profits! As you receive more than one 'Rise Coming' text signal in a downtrend, it means momentum is building larger for a bull run. HOW TO USE 1. When the green "Rise Coming" text appears, a price jump may be on the way! This indicator Never Repaints! To get the best setting it's a matter of tweaking the indicator until it gives you the best results. Our recommendation, and what
Price Action Sniper
Elmira Memish
5 (3)
Price Action Sniper is designed to trade the Price Action on the desired chart time frame. - Trend Reversals. - Trend Continuation. - Brekaouts. - Good tool for Binary Options Price action forms the basis for all technical analysis of a currency pair, commodity or other asset chart. Many short-term traders rely exclusively on price action and the formations and trends extrapolated from it to make trading decisions. Technical analysis as a practice is a derivative of price action since it uses p
交易水平指标是一个交易系统,旨在确定入场点、持有仓位和趋势方向。 包括在一个复合体中工作的多种机制、趋势方向的波浪分析、构建信号时的水平分析、显示可能的 TP 和 SL 目标。 指标能力 信号箭头出现在当前蜡烛上并且不会重新着色。 使用特殊算法来搜索价格反弹的水平。 根据趋势进行工作。 该系统具有通用性,可适用于各种交易工具。 箭头警报有多种类型。 信号箭头的输入参数在自动模式下配置和运行。 根据时间范围更改“趋势波周期”参数 “目标水平 SL TP”参数是针对主要货币对定义的;用于其他交易工具时,可以增加 10 或更多。 指标如何工作 判断趋势,该指标有一条波浪线;如果它高于价格,则趋势看跌;如果低于价格,则趋势看涨。 红色信号箭头用于购买,黄色信号箭头用于销售。 水平虚线是构建信号的电平;构建该线时,信号处于活动状态。 目标水平 SL 和 TP 的存在是为了方便技术分析和选择趋势参数。
MartingaleArrow
Abdulkarim Karazon
Martingale Arrow 是一种箭头型 mt4 指标,专为 Martingale 二元期权交易而设计,该箭头打印在柱开盘/柱内并发出警报。 如何使用:箭头出现时开始交易,如果交易获胜,则等待下一个信号并交易同一手数。如果交易在下一个信号时损失双倍手数并继续这样做直到信号获胜,则重置并使用第一个交易手数进行交易。 建议的时间范围:任意 最低存款:200 个单位。 此指示器实时不:重漆/背漆 -------------------------------------------------- ------------- 参数 : 指标周期:改变时会给出不同的信号 指标价格/类型 超买/超卖水平 警报输入 箭头样式 ===========================================
Introduction to Fractal Pattern Scanner Fractal Indicator refers to the technical indicator that makes use of the fractal geometry found in the financial market. Fractal Pattern Scanner is the advanced Fractal Indicator that brings the latest trading technology after the extensive research and development work in the fractal geometry in the financial market. The most important feature in Fractal Pattern Scanner is the ability to measure the turning point probability as well as the trend probabi
作者的更多信息
Displays multiple indicators, across multiple timeframes and symbols to give a comprehensive overview of the market. Uniquely, the indicators are configurable and can include custom indicators, even those where you just have the ex4 file or those purchased from Market. Standard indicators can also be selected, the default being ADX, CCI, market price above/below Moving Average (MA), Moving Average Cross (MAX), MACD, Momentum (MOM), OsMA, RSI, Parabolic SAR, William's Percentage Range (WPR). Use
Comprehensive on chart trade panel with the unique ability to be controllable from mobile as well. Plus has a library of downloadable configuration, e.g. exit rules, extra panel buttons, pending order setup and more. Please see our product video. Works with all symbols not just currency pairs. Features On chart panel plus controllable from free app for Windows, iPhone and Android Built-in script engine with library of downloadable configuration, e.g. add 'Close All Trades in Profit' button, exit
Fully functional manual trade panel with lot size calculation, one-click trading, hidden (virtual) stop loss/take profit and pending orders, scale in and out of trades (partial close), auto SL/TP and more. Works with all symbols not just currency pairs. Brings an incredible amount of functionality to MetaTrader for free and for both demo and live accounts. Features Lot size calculation - based on % of account to risk, fixed amount or dynamic lots Automatic take profit based on risk reward ratio
FREE
The indicator displays a matrix of indicators across multiple timeframes with a sum total and optional alert. Custom indicators can also be added to the matrix, in a highly configurable way. The alert threshold can be set to say what percentage of indicators need to be in agreement for an alert to happen. The alerts can turned on/off via on chart tick boxes and can be set to notify to mobile or sent to email, in addition to pop-up. The product offers a great way to create an alert when multiple
Comprehensive on chart trade panel with the unique ability to be controllable from mobile as well. Plus has a library of downloadable configuration, e.g. exit rules, extra panel buttons, pending order setup and more. Please see our product video. Works with all symbols not just currency pairs. Features On chart panel plus controllable from free app for Windows, iPhone and Android Built-in script engine with library of downloadable configuration, e.g. add 'Close All Trades in Profit' button, exit
Fully functional manual trade panel with risk/reward, auto SL, lot size calculation, one-click trading, hidden (virtual) stop loss/take profit and pending orders, scale in and out of trades (partial close), news events and more. Works with all symbols not just currency pairs. Brings an incredible amount of functionality to MetaTrader for free and for both demo and live accounts. Features Lot size calculation - based on % of account to risk, fixed amount or dynamic lots Automatic take profit base
FREE
The first currency based indicator to draw a distinction between map and strength. The map shows the currencies in terms of oversold/overbought levels and gives the direction of travel. The currency strength calculates and shows the strength of that move. Alerts are included for changes in currency direction on the map (confirmed over two bars) and also when the strength reached the appropriate level.  The currency map is useful for finding currency pairs to trade and in which direction. Look fo
The indicator displays a matrix of indicators across multiple timeframes with a sum total and optional alert. Custom indicators can also be added to the matrix, in a highly configurable way. The alert threshold can be set to say what percentage of indicators need to be in agreement for an alert to happen. The alerts can turned on/off via on chart tick boxes and can be set to notify to mobile or sent to email, in addition to pop-up. The product offers a great way to create an alert when multiple
Description Shows whether market is trending or not, to what extent, which direction, and if the trend is increasing. The indicator is very useful for trend following strategies. The indicator can also alert when the market transitions from being flat to trending, which can serve as a great entry point. The alert is controllable directly from the chart, with an on-chart tick box to enable the alert. Also includes bonus indicators of current spread and ask/bid prices in large text, color coded as
The indicator displays trend strength, including showing the transition from buy to sell and visa versa. It is ideal for trend following strategies and also highlights possible reversals/flattening trend with a yellow X on the indicator window. By default, the indicator does not repaint/flicker, however, there is an option to calculate on the live candle but even then the indicator will not repaint unduly. The indicator can also be used for exit. Usage Enter long/buy trade when the indicator tr
Allows symbols/currency pairs to be ordered based on a configured indicator, with the best performing symbols shown at the top. This helps you to select the symbol with better prospects from a given list of symbols. Can optionally alert when a symbol moves into the top two (configurable). Also shown is the number of pips that the symbol has moved in its current direction, allowing you to tell if you've 'missed the boat'. Further, a graph is shown, per symbol, of the indicator value over time all
Description Shows Heikin-Ashi candles (often misspelled Heiken-Ashi) on the chart and can alert when candles change color. The alert is useful for both entry and exit. The number of candles of the new color before an alert is raised can be set. The alert can be controlled interactively, directly from the chart. Also includes bonus indicators of current spread and ask/bid prices in large text, color coded as price changes. Usage Heikin-Ashi candles give a much better insight to the underlying tre
Description The product draws lines on the chart to show daily support, resistance and pivot plus weekly and monthly pivot. An alert can be set when the price reaches one of the lines or the price closes above/below it. This can be useful for both entry and exit. The alerts can be controlled interactively directly from the chart. The product also includes bonus indicators of Average Daily Range (or Average True Range - configurable), current spread and ask/bid prices in large text, color coded a
Provides the simplicity of binary options but addresses the shortcomings of regular binary options, namely: Poor risk reward ratio, fixed duration trades, poor broker choice, poor indicators/alerts, no hidden (stealth) stop loss/take profit, etc. Features 1 to 1 risk reward ratio, calculated automatically (configurable) Manual (with alert) or automatic trade entry (on alert conditions) Lot size calculation (money management) - based on % of account to risk or fixed amount Compact interactive on
The product combines a manual trade panel with the ability to perform actions automatically in a highly configurable way. Actions include capturing indicator values and then based on those values raising alerts, open/close or partially close trades, scale-in, setting up pending orders, adjusting stop loss, take profit and more. On-chart controls can be configured, such as tick boxes and buttons, so can be fully interactive. The EA also handles money management, news events, hidden stop loss, tak
Displays multiple indicators, across multiple timeframes and symbols to give a comprehensive overview of the market. Uniquely, the indicators are configurable and can include custom indicators, even those where you just have the ex4 file or those purchased from Market. Standard indicators can also be selected, the default being ADX, CCI, market price above/below Moving Average (MA), Moving Average Cross (MAX), MACD, Momentum (MOM), OsMA, RSI, Parabolic SAR, William's Percentage Range (WPR). Use
Strategy Builder offers an incredible amount of functionality. It combines a trade panel with configurable automation (covert indicators into an EA), real-time statistics (profit & draw down) plus automatic optimization of SL, TP/exit, trading hours, indicator inputs. Multiple indicators can be combined into an single alert/trade signal and can include custom indicators, even if just have ex4 file or purchased from Market. The system is easily configured via a CONFIG button and associated pop-up
The first currency based indicator to draw a distinction between map and strength. The map shows the currencies in terms of oversold/overbought levels and gives the direction of travel. The currency strength calculates and shows the strength of that move. Alerts are included for changes in currency direction on the map (confirmed over two bars) and also when the strength reached the appropriate level.  The currency map is useful for finding currency pairs to trade and in which direction. Look fo
The product combines a manual trade panel with the ability to perform actions automatically in a highly configurable way. Actions include capturing indicator values and then based on those values raising alerts, open/close or partially close trades, scale-in, setting up pending orders, adjusting stop loss, take profit and more. On-chart controls can be configured, such as tick boxes and buttons, so can be fully interactive. The EA also handles money management, news events, hidden stop loss, tak
Shows whether market is trending or not, to what extent, which direction, and if the trend is increasing. The indicator is very useful for trend following strategies, where it can filter out flat/choppy markets. The indicator can also alert when the market transitions from being flat to trending, which can serve as a great trade entry point. The alert is controllable directly from the chart, via a tick box. Also, the product includes bonus indicators of the current spread and ask/bid prices in l
Allows multiple indicators to be combined into a single indicator, both visually and in terms of an alert. Indicators can include standard indicators, e.g. RSI, CCI, etc., and also Custom Indicators, even those purchased through Market, or where just have the ex4 file. An early alert is provided, say when 4 out 5 indicators have lined up, and a confirmed alert when all are in agreement. A‌lso features a statistics panel reporting the success of the combined indicator by examining the current cha
Strategy Builder offers an incredible amount of functionality. It combines a trade panel with configurable automation (covert indicators into an EA), real-time statistics (profit & draw down) plus automatic optimization of SL, TP/exit, trading hours, indicator inputs. Multiple indicators can be combined into an single alert/trade signal and can include custom indicators, even if just have ex4 file or purchased from Market. The system is easily configured via a CONFIG button and associated pop-u
筛选:
Dorianmode
322
Dorianmode 2023.07.09 21:45 
 

用户没有留下任何评级信息

joseanrod
95
joseanrod 2023.04.20 15:22 
 

To keep it short, a SENSATIONAL tool for backtesting, indicating when to buy/sell and exit based on your system. If you have a profitable and fully mechanical system based on indicators then this is a must have tool. It facilitates your backtesting so much and provides you statistics based on the chosen days, which boosts your confidence and saves you precious time. Very user friendly, the videos on Youtube are very useful, comprehensive manual to reference. Not to say about the support and customer service is OUTSTANDING. Any legitimate doubt that I’ve had, I received a prompt and comprehensive answer to my Qs. LASTLY, before you buy, make sure that this is the tool you are looking for. This is an indicator and even though you can build your mechanical strategy using this tool, you cannot automate it (run it as an EA) since it’s an indicator. Make sure you take a look to his products and ask support if they have them on their website since through them, you don’t have the hardware activation limit. If you are confused, just contact the support email, describe what you’re looking for and I hope you’ll end up satisfied as myself.

Nicola Pileri
347
Nicola Pileri 2020.04.01 19:21 
 

Mi stupisce che ci siano così poche valutazioni, tutti i commercianti dovrebbero avere questo sistema che fa risparmiare enorme tempo.

Fantastico sistema.

Trader mql5
1265
Trader mql5 2019.04.25 04:01 
 

Where do I start...

Most importantly, support is superb and this is a unique, one-of-a-kind "app". I call it an app as it assists you in guiding which indicators have some hope and which are just rubbish by quickly analyzing the buffers of the indicators.

I certainly have a love-hate relationship with it, as it exposes the indicators which I thought are profitable in the long run, but fail miserably. I could have bet my life on some indicators, but this app clearly trashed most of them. I am starting to realize that indicators are not my way forward in trading...

I literally tested 3000+ indicators over the last couple months. Most can be trashed immediately within a few seconds by inserting the buffers. Others seem extremely profitable, but then test them through Strategy Tester, just to realize they either repaint or back-paint, even subtly by changing color, arrow or angle within one candle. When this info is then fed to the app by shifting the confirmation to 2 bars i.l.o 1 bar - crash, boom, bang, kaputt. It will need some reading and studying the manual in DETAIL to be able to identify which capture modes to use, but you will get there, believe me I am not overly bright and my mind melts when I have to program anything even remotely simple, but the logic of this piece of software is fantastic, once you get the hang of it - no programming required, you just pick the appropriate capture options and set your TP, SL levels. Also appropriate time frame consideration is very important with different TP/SL for each TF.

Remember there are many options for Stop Loss and Take Profit. Some indys like quick TP without waiting for opposite signals, others need opposite signals to be profitable. Scaling in on some are also good instead of a blind TP level. Combinations of both scaling in and exit/reverse on opposite signals are also possible. Stop Loss levels for each pair is also sensitive due to the pair's volatility, play around.

If you are an indicator addict like me, it will save you thousands. I spend more on indicators than on my trading balance in the hope to find that one gem - AND THIS IS THAT VERY GEM. If you insert this indicator in strategy tester, then demo a market indicator within it without buying it, you can very quickly make up your mind. Test the top 20 indicators in demo here on MQL5, you will be shocked. Bear in mind, multi time frame indicators will not work properly in Strategy Tester, with or without Indicator Merge. Refer to the sellers of these indys and they may have a free "lite" version or limited demo version for you to test.

Just a final tip: Even if you found a indy or a combination of Indicators that look good, even after testing them in Strategy Tester and you found them not re- or backpaint - Try them yet again in Strategy Tester together with Indicator Merge to give you current stats. Many, many indicators appear not to repaint, but small changes are sometimes not noticed unless they run bar by bar.

I am a rehabilitated compulsive gambler, this software is helping me turn into a rehabilitated compulsive indicator user at a price that is low for its effectiveness. I have currently only a handful of indys (most of them are free!) which may be useful as confirmation, still optimizing them to make a final decision.

The grey matter with vast voids between our ears seems to be the greatest expert advisor of all.

Additional edit: Where this app shines with Indicators is what Strategy Tester does for Expert Advisors. With Strategy Tester you can optimise the parameters of your EA to review which settings are the most profitable. This is not possible with Indicators as they do not have actual trade signals for Strategy Tester to invoke trade stats. With Indicator Combine you can enter the parameter settings of your indicator and see what impact it has on the profit/loss e.g. calc lookback parameter default of an indicator is 13, but what happens if you set it at 9 or 5 or 15? These stats are updated instantly without running it through Strategy Tester. Just remember if it does re-/backpaint it would be wise to run (no pun intended) again through Strategy Tester with Indicator Merge running concurrently.

I actually now test EVERY indicator through Strategy Tester with IC, it is mind blowing how many programmers manipulate the signals to show great signals in the past, just to realise when running them live, the signals are not even close to what they indicated in history. There are very few exceptions..

nicetees
154
nicetees 2018.08.23 14:26 
 

This indicator is the best investment I have made so far! I accidentally stumbled on it while searching for a MT4 programmer to combine some indicators into one, and this is far better. Excellent value and customer service! I am very pleased with my purchase.

sunnychow
9051
sunnychow 2018.08.08 17:40 
 

I am still study to understand the signal , edit the indicator, I will update my review later

Wang Chern Hoe
1022
Wang Chern Hoe 2018.03.22 02:33 
 

This indicator is the single best investment I made. It is a game changer for me. The support is fantastic as well!

Mujeeb Abdul
2272
Mujeeb Abdul 2017.11.14 08:22 
 

Excellent indicator good support

Marcel Wagner
535
Marcel Wagner 2017.09.12 14:49 
 

This is the most useful Tool i`ve ever purchased/tested on the MQL5 Market for sure, i created a reliable Signal with it and use it with the Strategy Automator also from RunwiseFX, it already payed off. Nothing more to say.

appropiate
1737
appropiate 2017.08.29 00:04 
 

Another magnificent tool from RunwiseFX! Able to analyze at a glance profitability, win/loss ratio and drawdown of strategies based on indicators/indicator combinations, SL, TP levels, trading hours and many other configurations, for all opened charts with different pairs/timeframes. All the statistics are summarized in one table for easy comparison. Huge time saver for backtesting and choosing best pair to trade. The Indicator Combine + Strategy Automator (their other excellent EA) will allow to analyze indicator-based strategies, choose the best strategy/configuration and convert it into an EA that can trade for you automatically. Functionality and configurability at its best. And customer support is beyond outstanding. I usually receive several emails per day, even on weekends. They are also open to modifying their tools upon reasonable/constructive feedback. Thanks a million Mark/RunwiseFX team!

Peter
1108
Peter 2017.07.25 12:27 
 

Fantastic indicator and works as promised. I'm never disappointed with products from RunwiseFX and the support is great.

Thanks Mark!

Alexander Dubenskiy
2134
Alexander Dubenskiy 2017.07.22 02:46 
 

I've been using this indicator for about I'd say 1 month if memory not deceiving me if not longer.

runwisefx products in general are products I use the most on mt4 platform. Overwhelming majority of indicators in my library being used with Indicator Combine or multiple indicator matrix. Various capture modes available and ability for the product to work with custom/third party proprietary stuff puts indicator combine in a whoooole new league in comparison to other utility products in a market.

As mentioned in automator review, indicator combine and automator especially reminds me of a product on ninjatrader side known as shark indicators bloodhound.

I'd say runwisefx producs similarly to tick data suite elevating capabilities of mt4 platform to a whole new level and substantially increasing mt4 potency . Taking different indicators "vanilla" and proprietary and morphing/combining them in variety of ways is absolutely supreme!!!

Let say you have 5 of your favorite indicators. cci, rsi, proprietary1, proprietary2, proprietary3 and let say you have a chart where you check for harmonic patterns or gann or astro, or eliott cycles or some similar way of generating a setup for a trade and using these 5 indicators as a trigger (an example).

Instead of having 5 indicators taking precious space on a chart you can merge them into 1 indicator which takes tiny space on a chart however provides highly compressed, *logistically dense*, valuable information on a chart which is combination of these 5 indicators.

After realizing the idea behind a product and what runwisefix did, pulled the plug on a purchase with "my eyes closed".

Also overall i believe prices on runwisefx products are complete bargain which just reinforces my belief people have to do the homework on mt4 market products very very carefully as indicators/eas most certainly not created equally and you may have 150$ product packing waaay more capabilities than let say 5000$ product etc.

Not saying runwisefix should increase the price haha however I.. I could see purchasing combine/matrix/automator product even if they costed 500$. The amount of brain power behind them is simply astounding.

3 flagship runwisefx products in my book unequivocally #1 utility products for mt4. If you use mt4, have tons of indicators and tons of eas it is my sincere belief you must have indicator combine, indicator matrix and if you would like to take trades off these automator.

Also would like to compliment runwisefx support. At the moment runwise pretty much focused on 3 main heavy hitter products. Matrix/combine and automator. Majority of support and improvement efforts focused on these 3 offers. Benefits are runwise business model is instead of spreading intellectual efforts on let say creating 20 different products with a twist they pretty much have only 3 flagship products hence more time for enhancements and supporting customers.

Support is top notch!

Do not think I or anyone else part of runwisefx cusomter base should expect a reply on weekends however few times Mark and runwisefx team replied to me on a weekends which pretty much blew my mind as I did not expected it at all.

Runwisefx is most certainly on the ball when it comes to supporting their flagship products and i have nothing but great things to mention and have nothing to complain about.

Fairly certain after 1 month (or may be longer) I'll be actively using combine/matrix and automator products for as long as mt4 is alive and supported.

Thank you runwisefx!! ^^

With best regards. Alex.

Yvonne
1094
Yvonne 2017.05.12 18:47 
 

This is a great tool to have if you want to get instant statistics on changes to your strategy. The stats update in real time so you can see, for example, what effect changing from a fixed stop loss to an ATR based stop loss would have on your profit. It can be as simple or as complex as you want to make it. You can use it with custom indicators and the support is excellent. Good for both newbies and pros alike.

回复评论
版本 6.90 2024.05.23
- Added new option in CONFIG | Options to only show arrows in the indicator window
版本 6.9 2023.07.29
- Added Max Bars box to CONFIG | Indicators, so can set how many bars/candles an indicator can provide a buy/sell signal. Can be used to ensure signal is close to when indicator changes direction.
版本 6.8 2022.05.12
- Fixed issue where not allowing functionality to be incorporated into Ultimate Trade Manager EA
版本 6.7 2021.07.08
- Fixed issue with previous simulated trades being left on chart

- Corrected default supplied configuration which had Capture Mode incorrectly set for ADX capture

- Fixed issue with 'Revert' text not being show on Refresh/Revert button
版本 6.6 2021.06.23
- Added support for our Ultimate Trade Manager EA, which allows trades to auto open/closed, rather than just alerts, plus adds auto optimization
版本 6.5 2021.03.07
- Fixed issue with previous version when indicators were captured with out Period box set to 0

- Fixed minor issue of panel not being deleted when Indictor Combine is removed from the chart
版本 6.4 2021.02.21
- Fixed issue with previous version where new arrows sometimes didn't appear and also could have got a critical error

- Added new built-in indicator for 3 moving averages crossing each other - F:MovingAverage3Cross (available to select in CONFIG | Indicators | Indicator Name selection list)
版本 6.1 2021.02.09
- Added two output buffers (7 buy and 8 sell) to display arrows when confirmed entry signal happens. This can be used by products that need to see arrows to take action. Set input Main_showArrowOnConfirmedEntry to false to turn new feature off.
版本 6.0 2020.12.26
- Add Color Index Tool that helps to configure indicators
版本 5.2 2019.12.27
- Fixed issue where BO bars couldn't be saved on per symbol/period basis
版本 5.1 2019.08.18
- Added support for looking at value achieved on CrossBuySell capture. Set Mid Point to value needs to be over.
版本 5.0 2019.08.10
- Added new capture mode OnCross for when indicator crosses certain value
版本 4.9 2019.01.12
- Added support for setting properties of the Heiken Ashi Smoothed Alert indicator
版本 4.8 2019.01.03
- Fixed issue with 'YesAndAtStart' mode where wouldn't work properly under certain circumstances
版本 4.7 2019.01.02
- Added work-around for when timer cannot be allocated due to MetaTrader being low on resources
版本 4.5 2018.12.10
- Fixed divide by zero error that could happen under certain circumstances

- Improved support for Price Action Real Power indicator, so that visualization could be turned off via inputs
版本 4.4 2018.10.21
- Added support for moving average crossing high and low moving average
版本 4.3 2018.09.29
- Added input Indi_checkErrorReturnFromICustom which can be set to true if you get an alert "can't find/initialise custom indicator...", but is actually fine. This can happen with certain indicators that are slow to initialise.
版本 4.2 2018.06.26
- Added compatibility with Awesome Oscillator indicator
版本 4.1 2018.06.18
- Fixed issue where excessive message logging in the Experts log could happen if using stop loss calculation method Custom Indicator
版本 4.0 2018.06.05
- Fixed issue where configuration could not be set on a per symbol/period basis

- Improved compatibility with indicators that draw colored objects on the chart, where the color represents the buy/sell indication
版本 3.4 2018.04.18
- Added support for indicators that use object colors to signify buy/sell.
版本 3.3 2018.03.27
- Improved compatibility with Tipu MACD indicator and MACD cross
版本 3.2 2018.02.27
- Improved support for indicator TFX_Directriz
版本 3.1 2017.12.25
- Fixed issue with Bollinger Band reversal not working
版本 3.0 2017.11.20
- Added support for indicators that display trend lines

- Added support for indicators that work on currencies rather than currency pairs

- Added support for indicators crossing other indicators
版本 2.9 2017.10.05
- Fixed bug when calculating combined indicator value when 'Essential for Trade' option set to 'Yes And At Start' for the sell direction
版本 2.8 2017.09.28
- Fixed issue with double alert/notification occurring under certain circumstances
版本 2.7 2017.09.19
- Fixed accuracy of statistics calculation with regard to spread when using Strategy Tester
版本 2.6 2017.09.13
- Fixed take profit calculation when using Median Renko charts
版本 2.5 2017.08.30
- Improved accuracy of shown statistics when using Median Renko charts
版本 2.4 2017.08.23
- Added support for indicators that display arrow objects on the chart
版本 2.3 2017.08.01
- Improved support for Price Action Strength Indicator custom indicator
版本 2.2 2017.06.21
- Added ability to handle price crossing indicator value

- Added ability to specify increment/decrement amount
版本 2.1 2017.05.15
- Fixed possible divide by zero error when Default Alert in General Settings is set to 'auto on win ratio' and there have been no trades found
版本 2.0 2017.05.05
- Added DeMarker and MFI as built-in indicators that can be added to the combination

- Added ability to include indicator where value is below set value
版本 1.8 2017.04.19
- Fixed issue setting Default Alert to confirmed in General Settings pop-up

- Fixed issue capturing different periods when interested in live candle value
版本 1.6 2017.04.04
- Fixed processing of indicators showing a point/arrow at the beginning of a move/trend

- Added "Delete All" button in the indicator setup window (confirmation will be required)

- Better convenience in the demo mode when run in the strategy tester

- Better profit value formatting - now profit is displayed with M or K where needed

- The default value of Main_statsBarsToCalcBack was changed to avoid hanging of charts with a large number of bars

- Added Stochastic

- Added support for over bought and over sold indicators