Gann Square of 144
- 指标
- Taras Slobodyanik
- 版本: 3.0
- 更新: 16 二月 2021
- 激活: 10
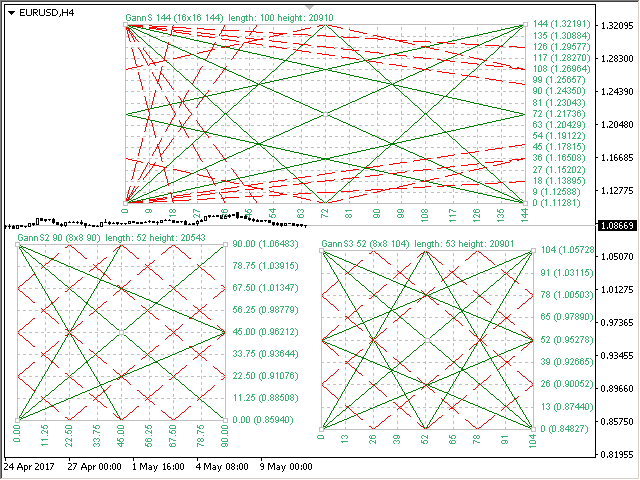
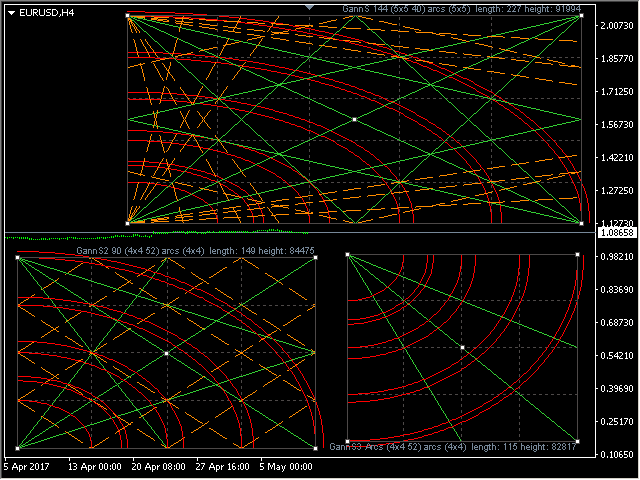
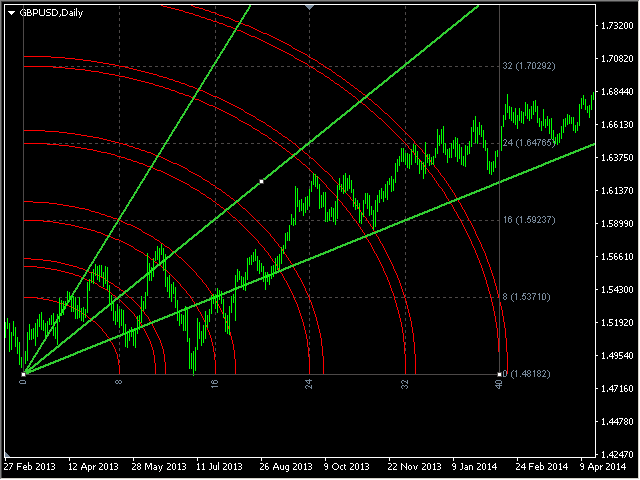
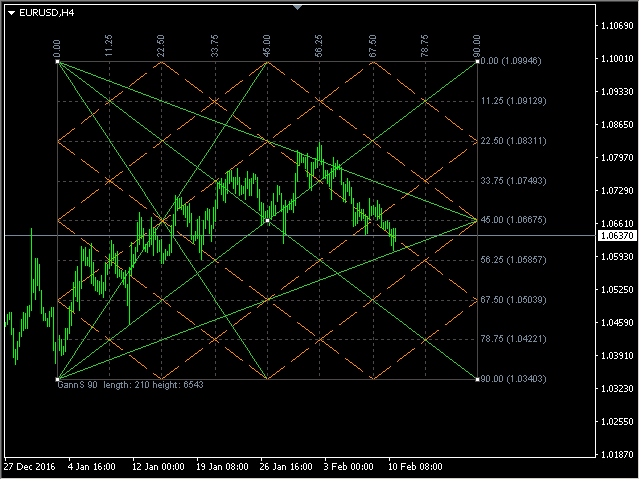
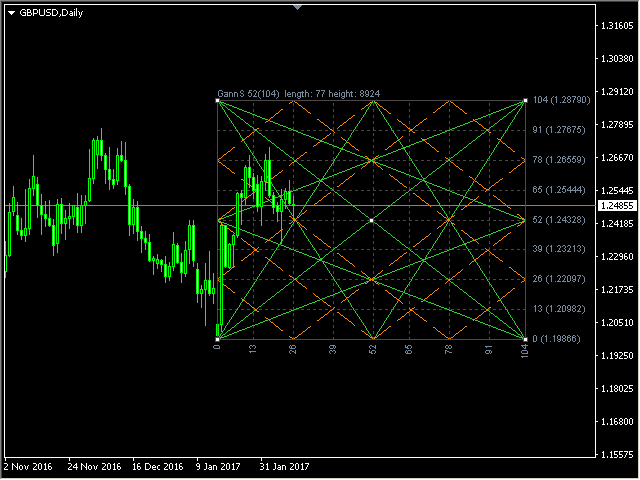
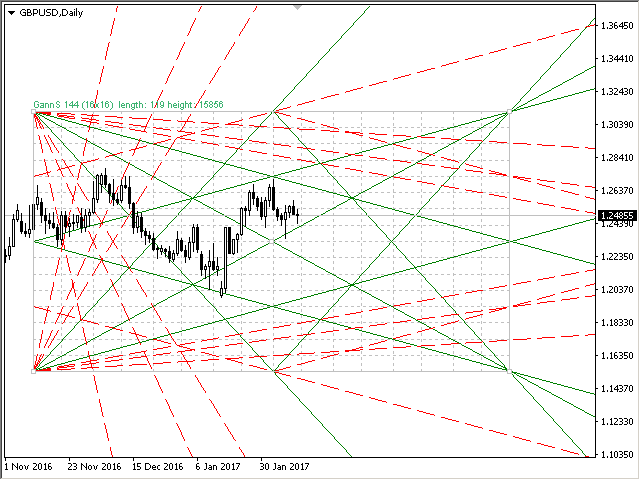
江恩箱(或江恩方)是一种基于 W.D. Gann 的“市场预测的数学公式”文章的市场分析方法。 该指标可以绘制三种正方形模型:90、52(104)、144。有六种网格变体和两种弧形变体。 您可以在一张图表上同时绘制多个方块。
参数
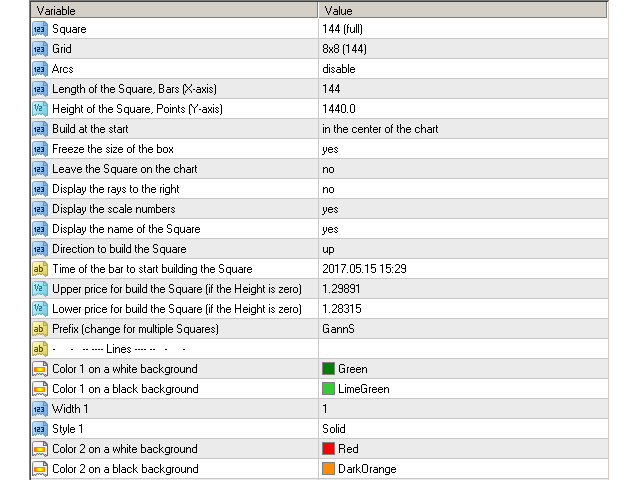
Square — 选择方形模型:
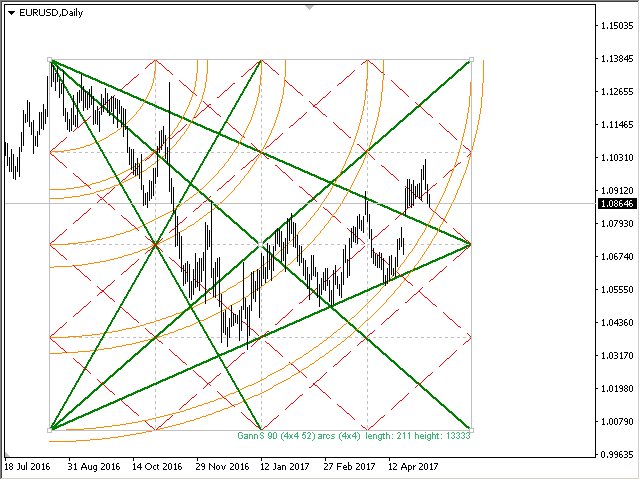
- 90 — 90 的平方(或 9 的平方);
- 52 (104) — 52(或 104)的平方;
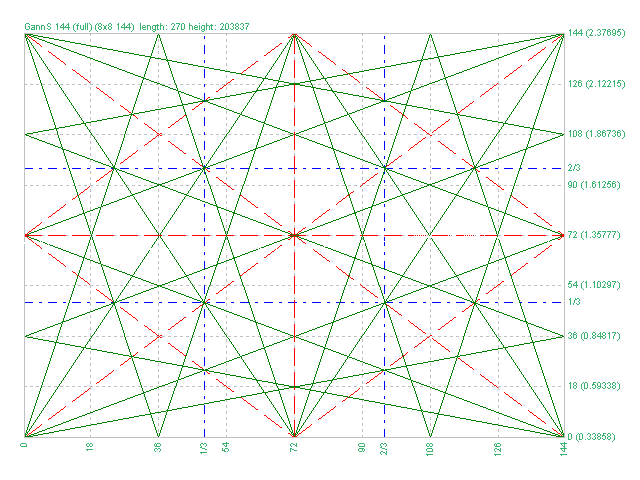
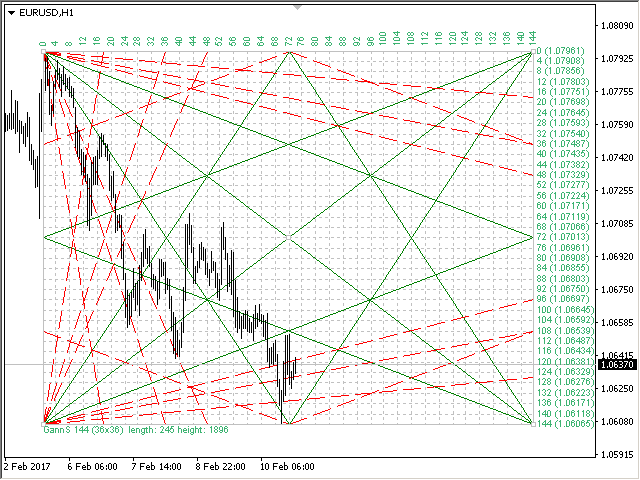
- 144 — 144的万能平方;
- 144 (full) — 正方形的“完整”版本,结合了其他正方形的线条。 据我们所知,W.D.江恩并没有这样的加价;
- for Arcs — 圆弧的简化正方形;
Grid — 网格的变体:
- 4x4 (52) — 4 x 4 网格,52 个标记;
- 5x5 (40);
- 8x8 (90);
- 8x8 (104);
- 8x8 (144);
- 16x16 (144);
- 36x36 (144);
- disable — 禁用网格;
Arcs — 弧线的变体:
- 4x4;
- 5x5;
- disable — 禁用弧;
开始时的方形参数:
Length of Square, Bars (X-axis) — 正方形的长度(以条为单位);
Height of Square, Points (Y-axis) — 正方形的高度(以点为单位);
Build at the start — 在开始时构建正方形:
— in the center of the chart — 在图表的中心;— at the specified time — 在指定时间;— to use the previous — 使用前一个方块(如果图表上存在);
Freeze the size of the box — 固定盒子的比例;
Leave the square on the chart — 移除指标时将方块保留在图表上;
Display the rays to the right — 将光线显示在右侧;
Display the scale numbers — 显示刻度编号;
Display the name of the Square — 显示方块名称;
Direction of Square — 构建正方形的方向,向上或向下;
Time of the bar to start building the Square — 开始绘制方框的条形时间;
Upper price for build the Square (if the Height is zero) — 盒子的上限价格,如果“Height of Square”参数为零,则根据这些价格绘制正方形;
Lower price for build the Square (if the Height is zero) — 盒子的较低价格,如果“正方形高度”参数为零,则根据这些价格绘制正方形;
Prefix (change for several boxes) — 盒子对象的前缀,如果同时使用多个方块则需要更改;
颜色
Color 1 on a white background — 白底色 1 — 白底线 1 的颜色;
Color 1 on a black background — 黑色背景上的颜色 1 — 黑色背景上第 1 条线的颜色;
Width 1 — 宽度1——线宽1;
Style 1 — 样式 1 — 线条样式 1;
Color 2 on a white background — 白底色 2 — 白底线 2 的颜色;
Color 2 on a black background — 黑色背景上的颜色 2 — 黑色背景上第 2 行的颜色;
Width 2 — 宽度2——线宽2;
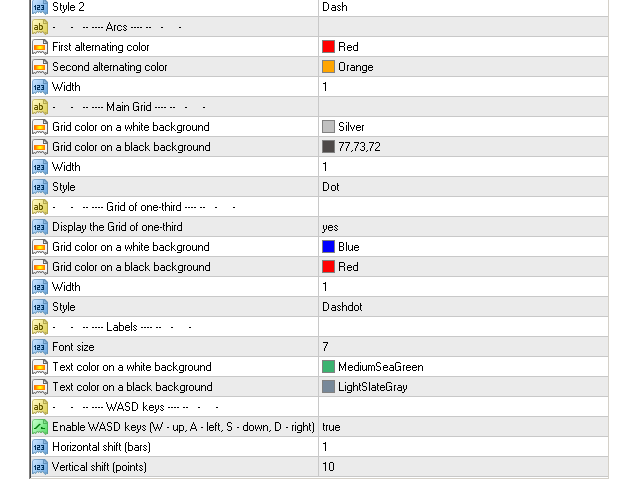
Style 2 — 样式 2 — 线条样式 2;
Arcs — 弧线
Color on a white background — 白色背景上的颜色;
Color on a black background — 黑色背景上的颜色;
Width — 弧线的宽度;
Grid — 网格
Grid color on a white background — 白色背景上的网格颜色;
Grid color on a black background — 黑色背景上的网格颜色;
Width lines — 网格线的宽度;
Style lines — 网格线的样式;
Lines 1/3 — 第 1/3 行
Display the Grid of one-third — 显示网格 1/3;
Font size — 字体大小;
Text color on a white background — 白色背景上的文本颜色;
Text color on a black background — 黑色背景上的文本颜色;
按键控制
Enable WASD keys — 使用“WASD”键激活控制。 “W”在上,“A”在左,“S”在下,“D”在右;
Horizontal shift (bars) — Square 的水平移动(bars);
Vertical shift (points) — 正方形的垂直位移(点);
All timeframes — 在图表的所有时间范围上显示一个正方形;
M1-MN1 — 在相应周期 M1-MN1 上显示一个方块。


Excelent tool.