Regression Momentum
- 指标
- Vladimir Komov
- 版本: 2.0
- 更新: 28 十一月 2021
- 激活: 5
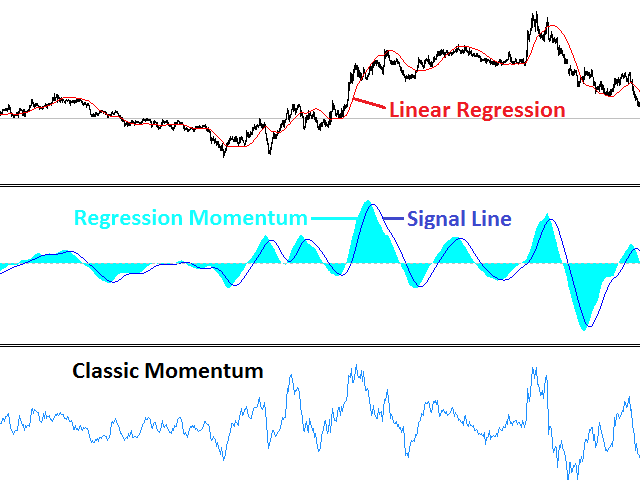
The Regression Momentum is an indicator of directional movement, built as the relative difference between the linear regression at the current moment and n bars ago. The indicator displays the calculated Momentum in a separate window as a histogram. The signal line is a simple average of the histogram.
The histogram value above 0 indicates an uptrend. The higher the value, the stronger the trend. A value below 0 indicates a downtrend. The lower the value, the stronger the downtrend.
Intersection of the histogram and signal line means either the weakening of the current trend or a reversal.
Formulas
Mlr=(Li - Li-n)/Li-n, where Li - value of the linear regression plotted on the i-th bar, Li-n - value of the linear regression plotted n bars back from the i-th bar.
Advantages
- Using the linear regression instead of the price when plotting the Momentum indicator allows to smooth out the random fluctuations and to determine the trend reversal moments with a greater accuracy.
- Defining areas where the trend is weakening, and areas where the directional movement is resumed.
- It works on any instrument.
- It works on all timeframes.
- No repaints, no recalculation.
Parameters
- Regression Period - linear regression calculation period. The longer the period, the more stable but more lagging it is.
- Momentum period - period of the Momentum indicator, i.e. the number of bars for calculating the difference of the linear regression
- SmoothPeriod - smoothing period when plotting the signal line.
Usage
The indicator can be used in multiple ways.
- As a trend indication: if the histogram is positive, the trend is growing, a negative value is a sign of a downtrend.
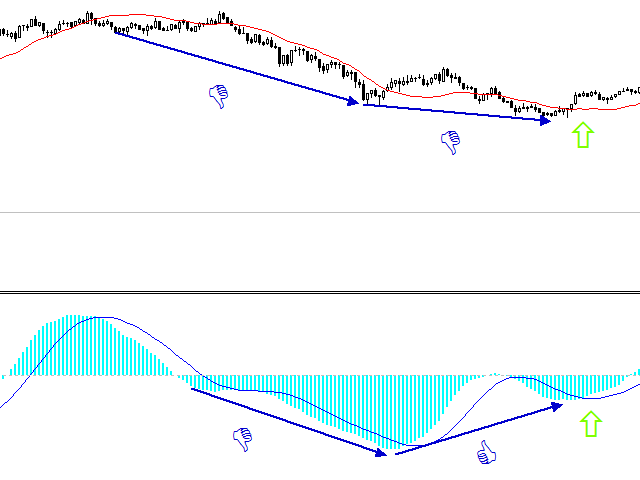
- To assess the trend strength: when the histogram is positive and above its signal line value - the uptrend is gaining momentum. If the histogram is below the signal line, but is greater than zero, the uptrend is weakening. When the histogram is negative and its value is below the signal line - the downtrend is gaining momentum. If the histogram is above the signal line, but is below zero, the downward trend is weakening.
- For signal generation: trend following buy/sell when the histogram crosses the zero level; buying against the downtrend at the intersection of the signal line from the bottom up in the negative zone, also in this case this is a signal to close a short position; selling against the uptrend at the intersection of the signal line from top to bottom with the uptrend, also in this is a signal to close a long position.
- Divergence of the price and indicator signalize an upcoming end of the trend.
Features
The smaller the Regression Period and Momentum period value, the more often the indicator will produce trend change signals.
The smaller the smoothing period SmoothPeriod, the more often the indicator will generate trend weakening signals.
Limit: SmoothPeriod < Regression Period, Momentum period < Regression Period.


