Fibo RSI Channels
- 指标
- Igor Semyonov
- 版本: 1.21
- 更新: 26 三月 2020
- 激活: 5
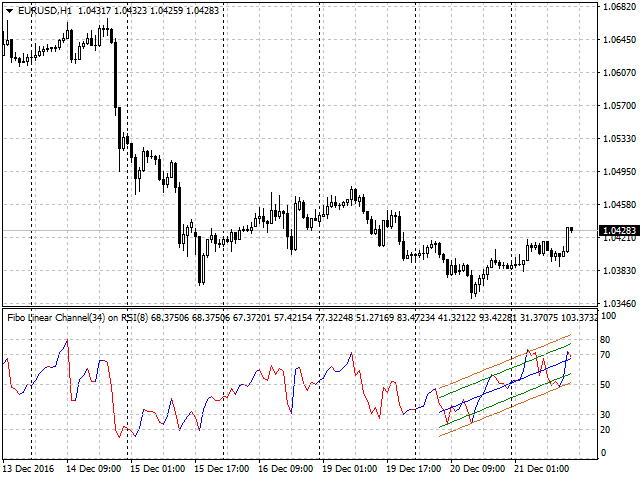
Colored indicator of the linear channels based on the Fibonacci sequence for the RSI. It is used for making trading decisions and analyzing market sentiment. The channel/channels boundaries represent strong support/resistance levels, as they are the Fibonacci proportion levels.
Users can select the number of displayed lines of channel boundaries on the chart by means of the input parameters.
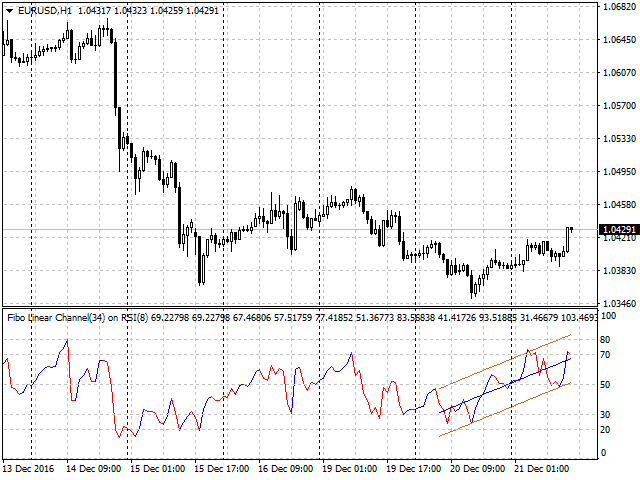
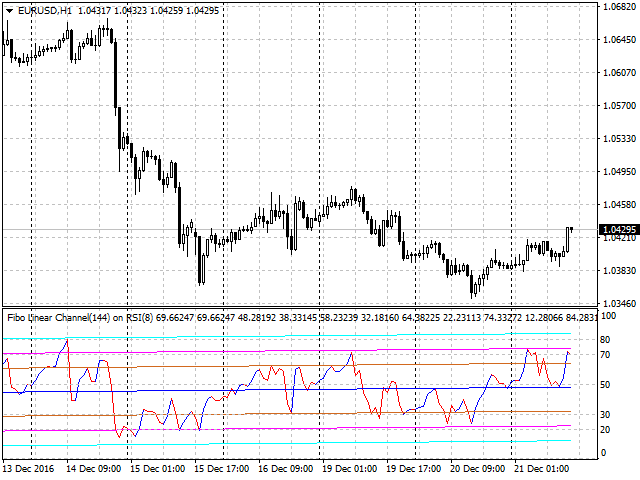
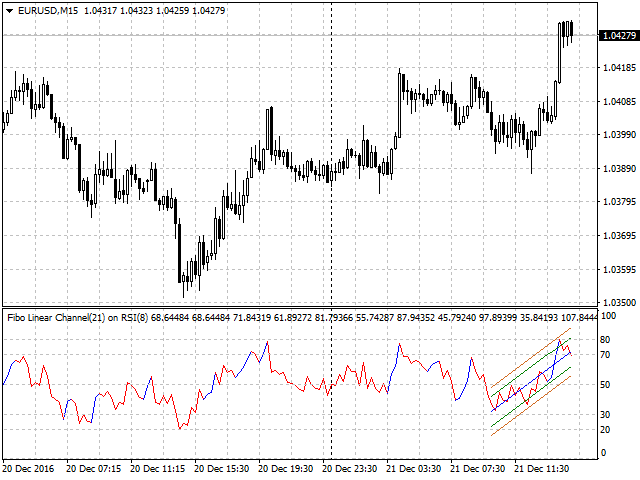
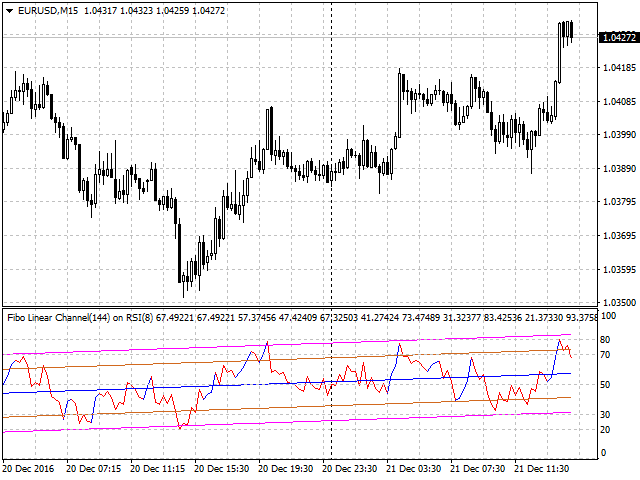
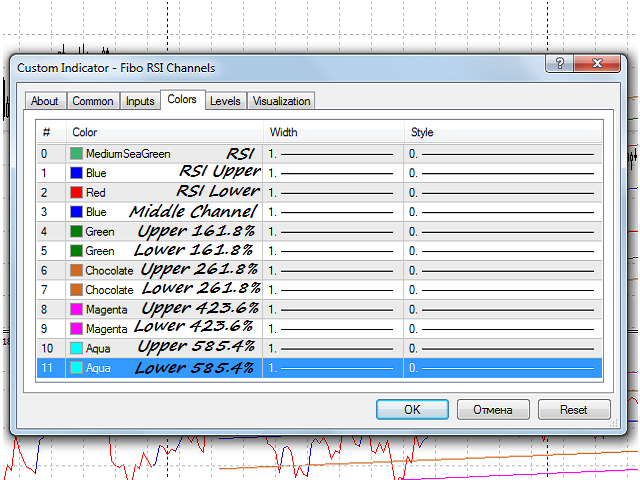
Various options for using the indicator are shown in the screenshots. The middle of the channel is shown in blue. The channel boundaries are displayed in individual color in pairs for each corresponding Fibonacci extension.
Purpose
The indicator can be used for manual or automated trading within an Expert Advisor. Values of indicator buffer of the double type can be used for automated trading:
- The line of the RSI indicator - buffer 0.
- The line of the bullish RSI - buffer 1.
- The line of the bearish RSI - buffer 2.
- Channel middle line - buffer 3.
- Upper 161.8% boundary line - buffer 4.
- Lower 161.8% boundary line - buffer 5.
- Upper 261.8% boundary line - buffer 6.
- Lower 261.8% boundary line - buffer 7.
- Upper 423.6% boundary line - buffer 8.
- Lower 423.6% boundary line - buffer 9.
- Upper 585.4% boundary line - buffer 10.
- Lower 585.4% boundary line - buffer 11.
Values of the buffers related to linear channels must not be equal to zero.
Values of the buffers related to the RSI indicator must not be equal to EMPTY_VALUE.
Input parameters
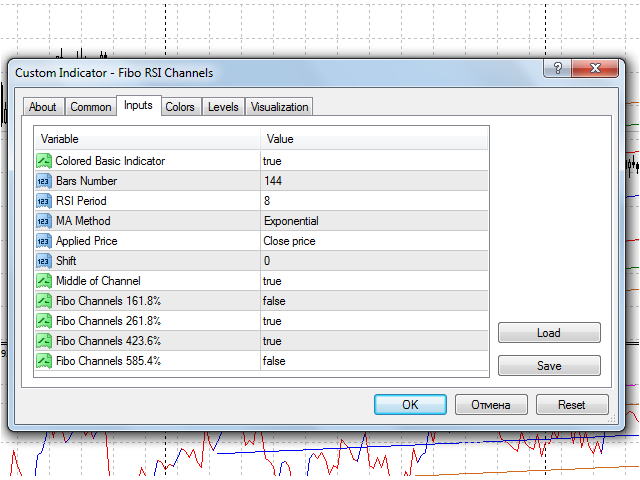
- Colored Basic Indicator - coloring for bullish and bearish RSI:
- true - yes.
- false - no.
- Bars_Number - number of bars for the indicator calculation.
- RSI Period - period for calculation of the RSI.
- MA Method - MA averaging method.
- Applied Price - price used for calculation.
- Shift - shift of the indicator in relation to the price chart.
- Middle of Channel - Display the channel middle on the chart:
- true - yes.
- false - no.
- Fibo Channels 161.8% ....... Fibo Channels 585.4% - Display the 161.8% ........ 585.4% channel boundaries on the chart:
- true - yes.
- false - no.









Great idea to apply Fib to RSI. If Fib channel is applied to RSI signal line the right way - one can find turning points easier. I bought this thing but still I think its more reliable to apply to RSI a free FIb channel available in metatrader. Its simply more accurate as this one plots a channel in a way similar to linear regression channel. So better to do it manually.