• 概述
  • 评论 (5)
  • 评论 (5)
  • 新特性

Octet

Octet


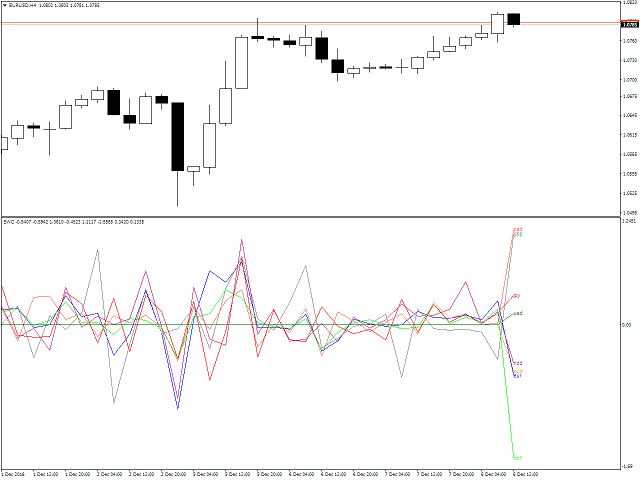
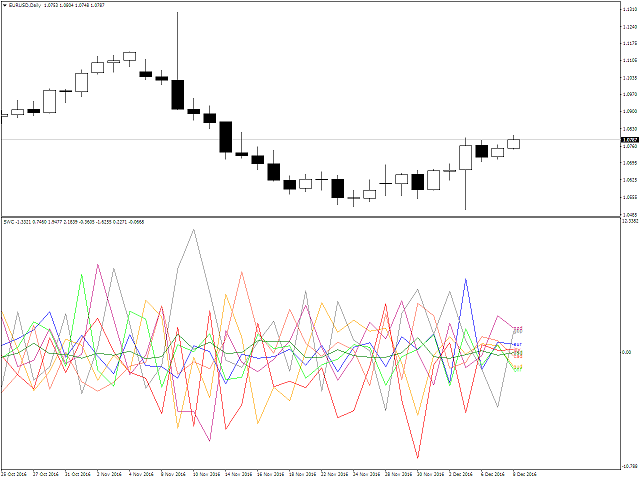
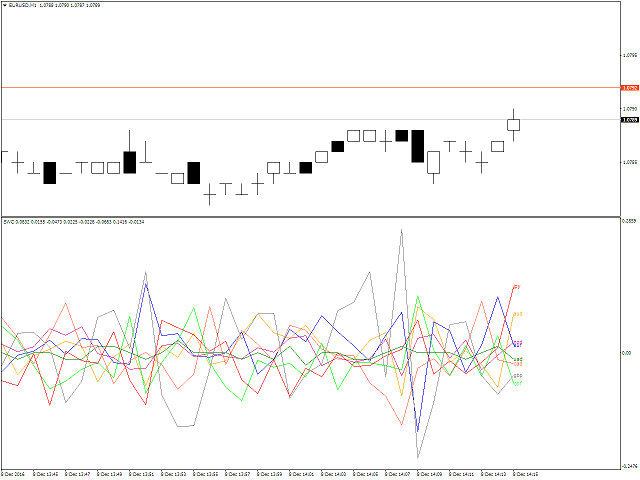
该指标是多货币的,它同时分析 56 种货币对。重要的是,所有货币对都在市场概览中并为其加载报价。

该指标以一条线的形式显示某种货币相对于其他7种货币的涨跌。指标值以百分比表示。


指标设置说明

  • Type_Calculation - 计算货币增长或下跌百分比的三个选项
  • 前缀 - 当货币对的名称中有前缀时使用,例如:EURUSD.fxp,则设置 Prefix = .fxp
  • Show_AUD - 显示澳元货币相对于其他 7 种货币的总计算值
  • Show_EUR - 显示欧元货币相对于其他 7 种货币的总计算值
  • Show_GBP - 显示英镑货币相对于其他 7 种货币的总计算值
  • Show_NZD - 显示新西兰元货币相对于其他 7 种货币的总计算值
  • Show_CAD - 显示 CAD 货币相对于其他 7 种货币的总计算值
  • Show_CHF - 显示 CHF 货币相对于其他 7 种货币的总计算值
  • Show_JPY - 显示日元货币相对于其他 7 种货币的总计算值
  • Show_USD - 显示美元货币相对于其他 7 种货币的总计算值
  • Show_NAME - 显示指标线的货币名称
  • calculation_Bars - 显示指定数量柱的指标值


推荐产品
Oscillator helps determine the direction of the market Shows the direction of the price movement and is painted in the appropriate color. Allows you to conduct trend and counter trend trading It works on all timeframes, on any currency pairs, metals and cryptocurrency Can be used when working with binary options Distinctive features Does not redraw; Simple and clear settings; It works on all timeframes and on all symbols; Suitable for trading currencies, metals, options and cryptocurrency (Bitco
FREE
PTW NON REPAINT TRADING SYSTEM + HISTOGRAM Non-Repainting ,   Non-Redrawing   and   Non-Lagging  Trading System. Does the following: - Gives Accurate Entry and Exit Points - Scalping, Day and Swing Trading  - 95% Accuracy  - Targets, where to take profits. - Shows Trends, Support and resistance levels - Works on All Brokers - Works on All Currencies, CFDs and Stocks - It does not place trades for you, it only shows you what trades to place. - It works on All Timeframes - It is for Trend or ra
Global Trend
Vitalii Zakharuk
Global Trend Indicator, shows the signals for entry. Displays both entry points and the trend itself. Shows statistically calculated moments for entering the market with arrows. When using the indicator, the risk factor can be optimally distributed. Settings: Uses all one parameter for settings. Choosing a parameter, it is necessary to visually resemble it so that the appropriate graph has a projection of extremes. Parameters: Length - the number of bars for calculating the indicator.
Trade Stats
Johannes Schoeman
Does your trading consist of Multiple EA's, Multiple time frames an no clear indication of how each individual strategy or time frame is performing, then this indicator will help. Assign the EA Magic number to this indicator and track it's performance on the chart by selecting on chart the period, today, week, month year or all history to view. Easy visual colour changing header to display the performance of the EA for the respective periods.    Minimize the panel to reduce chart clutter. Add yo
Strong Pairs
Angelico Jurado
5 (1)
This indicator calculates the strength of the major currencies (EUR, USD, CAD, GBP, CHF, NZD, USD, JPY) and shows the top 4 strongest currency pairs that are currently in a high probability trend for the day or for the week. Usage The indicator displays 8 currency pairs with a trend direction (e.g. "EURUSD-DOWN") and ranked according to strength, with 1 being ths strongest. There will be 4 pairs for intraday and 4 pairs for intraweek If a currency pair is present in the top 4 intraday, it is i
使用此交易工具,您可以同时扫描 15 个市场。 介绍新的交易指标 2024: ️ 仪表板多货币多时间框架随机。 我创建这个交易工具至少有两个原因: 首先,我厌倦了只观察一个市场。 其次,我不想失去进入另一个市场的时机。 这就是为什么我想同时了解其他市场状况。 因此,我需要一台可以同时扫描多个市场状况的扫描仪。 我经常寻找随机主线>(或<=)随机信号线从M1到H4(或只是M1到M30)的市场。 如果您同意我的分析,那么这就是您一直在寻找的交易指标。 不要错过市场状况满足上述要求的时刻。 这是一个随机扫描仪或仪表板,具有许多出色的功能: 可显示随机主线数据 可显示随机信号线数据 可以显示随机主线和信号线的位置(信号线上方主线或信号线下方主线) 可以显示随机主线和信号线的数据水平(看涨、看跌、趋势向上、趋势向下、超买但仍向上、超卖但仍向下) 可显示从M1到MN1的实时数据 可显示15种货币对的数据(多币种外汇/商品/加密货币/股票) 可定制参数 可定制颜色 OBOS 级别 漂亮的20仪表板配色方案 配备开/关货币对转换器 配备蜡烛高时间框架 配
SpectorChart
Sergii Krasnyi
5 (1)
This indicator continuously changes the color of candlestick borders and bodies, as well as the color of volumes in real time. The indicator is easy to use. The palette of colors is diverse. This product is a graphical solution, so it is difficult to describe what it does by text, it is easier to see by downloading it, besides the product is free. The indicator is suitable for bloggers who want to create a beautiful picture of a chart for video editing or traders who want to make their chart al
FREE
The indicator sends messages to e-mail and mobile terminal when the price approaches the horizontal levels and trend lines that are drawn using the handy panel! The levels and trend lines are deleted and placed to the chart using one click on the panel, and they can be dragged on the chart by mouse! It is possible to set the interval between messages in the settings, the interval is applied to each object separately! Indicator Settings ===*** Main settings ***=== - below is the list of the mai
EMA Dashboard
Chantal Sala
1 (1)
Ema Dashboard is an innovative dashboard that allows you to monitor Moving Average on multiples symbols and different timeframes. This dashboard allows you to analyze information on 28 pairs on an unique chart. Its functionality includes analysis of All Time Frames. This configuration allows you to identify the Long Term Trend with extreme ease. This panel allows you to take very important directional movements. A click on button opens a new chart (symbol and timeframe). Graphic Object Symbol
Anemone
Sean Christian Hammond
使用人工智能 AI 创建,用于将生物体可见的行为模式纳入趋势分析。 混沌理论与移动平均线相遇。 滤食性海葵将其卷须伸入营养物质的海洋以丰富自身。 我不会用太长的描述浪费你的时间,这个概念在这些术语上是可以理解的。 它是一个可自定义的周期旋转移动平均线,可在简单、指数、加权和平滑之间切换,在您指定的时间输入上。 轮换是半混沌的,由市场本身注入的随机性。 当这些 MA 一个叠加在一起时,其效果就像海葵滤食一样,其卷须伸入环境........................................................................................................................................................................................................
Indicatorul Multivers Bun venit! Observați rezultatele foarte bune pe M15. Dar funcționează bine și în celelalte intervale de timp. Trebuie doar să reglați TP, SL, Lot etc. Noroc! Notă Este posibil ca acești indicatori pe care îi punem în vânzare să nu funcționeze pe anumite platforme. De câțiva ani, unele platforme cu noi versiuni MT4 nu afișează toți indicatorii personalizați. O soluție la această problemă este să descărcați acești indicatori pe o altă platformă de la un alt broke
DrakonMA
Mikhail Bilan
Moving indicator. It is written so that it doesn't signal when two moving averages cross. Easy to operate.  It performed well on European and Asian currencies. Designed for long-term and medium-term types of trading.  Индикатор мувингов. Написан так что даёт сигнал при пересечении двух скользящих. Прост в управлении.   Хорошо себя показал на европейских и азиатских валютах.  Рассчитан  на долгосрочный тип торговли. 
FREE
Pyro Trend
Oleksii Ferbei
Pyro Trend is a new product that allows you to identify the current market phase (uptrend, downtrend or flat). The indicator is applicable for any data and periods. The middle of the trend wave, as well as the edges, are places of special heat and market behavior; when writing the indicator, an attempt was made to implement precisely finding the middle. Pyro Trend is a trend indicator that uses an original calculation algorithm. This indicator paints arrows in different colors depending on th
KFX Trade Manager
Joe Christopher Ramirez
Introducing the "KFX Trade Manager" expert advisor for MetaTrader 4 (MT4), a comprehensive solution for advanced trade management and risk control. This powerful tool is designed to enhance your trading experience by automating various aspects of order handling, profit optimization, and alert notifications. With the "KFX Trade Manager," you can take your trading to the next level and streamline your operations for improved efficiency and better risk management. Key Features: Trade Management Set
Note : The slow loading of the indicator issue has been addressed . This new version loads fast and does not slow the platform. Version 1.3 : We have updated the indicator to include an historical bar scanning option . So instead of scanning all bars in the history (which can make the indicator slow sometimes ) , you can select the maximum number of bars it can scan which can increase the performance and make the indicator faster. This indicator scans the 1-3 Trendline pattern . The indic
MQLTA Candle Timer
MQL4 Trading Automation
5 (1)
MQLTA Candle Timer is an indicator that can show you the details about a symbol/pair and alert you before the close of a candle. Used in swing trading and not only, it can help your strategies knowing and be ready before the close of a candle. How does it work Simply add the indicator to the chart and set the notifications options. You can load a minimalistic interface or a full interface. The alert will be sent once per candle. Parameters All the parameters, that you can see in the picture,
FREE
Currency StrengtT
Hafis Mohamed Yacine
What Is Currency StrengtT Indicator? A currency strengthT indicator is a graphical tool that shows the strength of a currency. Common indicators usually show the strength of a currency in relation to another currency, however, with some calculations it is possible to find the absolute strength of each individual currency. Therefore, a currency strength matrix indicator (or meter) is a tool that tries to express the absolute strength of a currency, so that you can compare this strength with
Floating peaks oscillator - it the manual trading system. It's based on Stochastik/RSI type of oscillator with dynamic/floating  overbought and oversold levels. When main line is green - market is under bullish pressure, when main line is red - market is under bearish pressure. Buy arrow appears at the floating bottom and sell arrow appears at floating top. Indicator allows to reverse signal types. Main indicator's adjustable inputs : mainTrendPeriod; signalTrendPeriod; smoothedTrendPeriod; tre
The Nihilist 5.0 Indicator includes Forexalien and Nihilist Easy Trend trading strategies and systems. It is composed of an MTF Dashboard where you can analyze the different input possibilities of each strategy at a glance. It has an alert system with different types of configurable filters. You can also configure which TF you want to be notified on your Metatrader 4 platform and Mobile application The indicator has the option to view how could be a TP and SL by using ATR or fixed points, even
MartingaleArrow
Abdulkarim Karazon
Martingale Arrow 是一种箭头型 mt4 指标,专为 Martingale 二元期权交易而设计,该箭头打印在柱开盘/柱内并发出警报。 如何使用:箭头出现时开始交易,如果交易获胜,则等待下一个信号并交易同一手数。如果交易在下一个信号时损失双倍手数并继续这样做直到信号获胜,则重置并使用第一个交易手数进行交易。 建议的时间范围:任意 最低存款:200 个单位。 此指示器实时不:重漆/背漆 -------------------------------------------------- ------------- 参数 : 指标周期:改变时会给出不同的信号 指标价格/类型 超买/超卖水平 警报输入 箭头样式 ===========================================
Icarus Bolli-Band Change Display(TM) Indicator is a simple, but highly effective tool for visually identifying areas where the all-important 'Bollinger Band' values are in a state of expansion, contraction of neither. The traditional Bollinger Bands have been widely applied to trading charts globally since their creation by John Bollinger several decades ago. One of the limitations of the traditional Bollinger Bands is the ability to clearly identify when the bands are in fact expanding or contr
R Var 移动平均线指标是为顽固的趋势追随者设计的趋势跟踪指标。 它是股票交易者和商品交易者中非常流行的外汇交易指标,它的流行源于它能够向用户提供真正的赚钱信号。 该指标由放置在黄褐色线上的绿色和红色点组成。 绿点指向看涨信号,而红点表示看跌信号。 基本交易信号 买入信号:当指标的黄褐色线上的点变为绿色时,做多。 卖出信号:当指标的黄褐色线上的点变为红色时做空。 退出买入交易:如果在看涨趋势持续期间,指标的西耶娜线上出现红点,则关闭所有买入订单。 退出卖出交易:如果在看跌趋势持续期间,R Var 移动平均线指标的西耶纳线上显示绿点,则关闭所有卖出订单。 尖端 在使用 R Var 移动平均线指标时,利用适度的止损来防止错误信号。 将其用于各种交易方式,包括剥头皮交易和日间交易。 特征 平台:MetaTrader 4 货币对:任何 自定义选项:变量(periodAMA、nfast、nslow、G、dK、UseSound、SoundFile)、宽度和样式。 时间范围:1 分钟、5 分钟、15 分钟、30 分钟、1 小时、4 小时、1 天、1 周、1 个
This product shows you a different view of the market by examining the performance of volume and continuous patterns in the market, then by calculating the behavior of traders and market patterns, calculates the probability of the next movement of the market by calculations. Function. How to receive the signal: If the candlestick is currently a bullish candlestick, according to a market scan, if the next bullish candlestick is below 5%, you can open a free trade by hitting the wisdom areas.
BeST Trend Exploiter
Eleni Koulocheri
5 (4)
BeST_Trend Exploiter is a Metatrader Indicator  based on a smart proprietary algorithm which can detect the market Median Trend while it filters out the noise providing Buy and Sell Signals and also wherever it is applicable it provides us with TP Levels of High Probability. Additionally as it has Built Inside all the necessary features it can be used as a Complete Strategy of very Impressive Results. Essential Advantages of the Indicator Clear and Easily Understandable trading rules. Real Time
Market Profile
Artem Titarenko
5 (1)
The "Market Profile" indicator displays the profiles and volumes of periods – weekly, daily, session (8-hour), 4-hour, hour, summary. The VAH/VAL price area is automatically highlighted by a dotted line for each profile (except for the summary). The indicator includes chroma Delta, which colors the profile areas. The areas of prevailing Buys is colored in green, that of Sells - in red. The intensity histogram features blue/red respectively. In the filter mode, the indicator displays the volume a
ATC AlgoZone Indicator
Ameur Boudenne
5 (2)
Algo Trading Indicaor  With this indicator , you’ll have zones and trends that hight probability the price will reverse from it. so will gives you all the help that you need  Why should you join us !?  1-This indicator is logical since it’s working in previous days movement , to predict the future movements. 2-Algo trading indicator will help you to draw trends which is special and are too strong than the basics trend , trends will change with the frame time that you work on . 3-We can
KFX Symbol Changer
Peter Kariuki Thande
4.67 (3)
KFX SMA: Symbol Changer + Moving Average (3x) + ATR + RSI + Candle Timer. This indicator allows you to create a Symbol list and change between symbols of the current chart or Timeframe by selecting the appropriate button. On Chart there are three(3) multi timeframe Moving Averages shown (selected by you), ATR Value MTF ( selected by you -  helps with setting SL and TP), RSI Value MTF (selected by you) and a Candle Timer.   Features: - Symbol Changer : Change Symbol and Timeframe of Chart.   (
FREE
Rebate gnome
Vasilii Konovalov
Rebate robot. The money on the deposit rotates around zero, while a lot of transactions are made and the rebate is stuffed.It does not load the deposit, there is a stop loss and take profit.It is necessary to bet on several instruments at once, pairs can be any, but it is recommended to bet on those in which the trend is clearly traced on the daily chart. With prolonged reversals, the robot loses, but it happens very slowly and relatively safely, so it is recommended to track the trend at least
Cloud Power
Andriy Sydoruk
Implementation of indication of trend movement with moments for potential stops in the Cloud Power indicator. The transition to the shadow warns of a possible reversal. The entry of the price inside the shadow speaks of a flat movement. The indicator tracks the market trend with unmatched reliability, ignoring sharp market fluctuations and noise around the average price. Simple, visual and efficient use. The indicator does not redraw and does not lag. It can be easily used as an independent
Niubility Trend  Niubility Trend displays the trend direction for all time frames in real time. You'll see at a glance at which direction the trends are running, how long they last and how powerful they are. All this makes it an easy-to-use trend trading system for beginners, advanced and professional traders. Features Easy to trade Customizable colors and sizes It is non-repainting and non-backpainting It is fantastic as a trailing stop method It implements alerts of all kinds
该产品的买家也购买
TPSpro RFI Levels
Roman Podpora
4.85 (20)
Reversal First Impulse levels (RFI)    INSTRUCTIONS        RUS       -       ENG              R ecommended to use with an indicator   -   TREND PRO -  Version MT5 A key element in trading is zones or levels from which decisions to buy or sell a trading instrument are made. Despite attempts by major players to conceal their presence in the market, they inevitably leave traces. Our task was to learn how to identify these traces and interpret them correctly. Main functions: Displaying active zones
Advanced Currency Strength28 Indicator
Bernhard Schweigert
4.91 (665)
目前26%的折扣 任何新手或专家交易者的最佳解决方案! 这个指标是一个独特的、高质量的、可负担得起的交易工具,因为我们纳入了一些专有的功能和一个新的公式。只需一个图表,你就可以读出28个外汇对的货币强度!想象一下,你的交易将如何得到改善,因为你的交易是在你的手中进行的。想象一下,你的交易将如何改善,因为你能够准确地确定新趋势或剥头皮机会的触发点? 用户手册:点击这里  https://www.mql5.com/en/blogs/post/697384 这是第一本,原版的! 不要买一个毫无价值的崇拜者的克隆品。 特别的 子窗口中的箭头显示强劲的货币势头GAP将指导你的交易! 当基础货币或报价货币处于超卖/超买区域(外盘斐波那契水平)时,在个人图表的主窗口中出现警告信号。 当货币力量从外围区间回落时,回撤/反转警报。 十字星模式的特别警报 可选择多个时间框架,以快速查看趋势! 货币强度线在所有的时间框架中都非常平稳,当使用较高的时间框架来识别总体趋势,然后使用较短的时间框架来确定精确的入口时,效果非常好。你可以根据自己的意愿选择任何时间框架。每个时间框架都由其自身进
Scalper Inside PRO
Alexey Minkov
4.74 (58)
An exclusive indicator that utilizes an innovative algorithm to swiftly and accurately determine the market trend. The indicator automatically calculates opening, closing, and profit levels, providing detailed trading statistics. With these features, you can choose the most appropriate trading instrument for the current market conditions. Additionally, you can easily integrate your own arrow indicators into Scalper Inside Pro to quickly evaluate their statistics and profitability. Scalper Inside
Atomic Analyst
Issam Kassas
5 (3)
首先值得强调的是,该交易指标是非重绘、非延迟的指标,这使其成为手动和机器人交易的理想选择。 用户手册:设置、输入和策略。 Atomic Analyst是一种PA价格行动指标,利用价格的力量和动量来寻找市场上更好的机会。配备了高级过滤器,可帮助去除噪音和假信号,并提高交易潜力。使用多层复杂的指标,Atomic Analyst扫描图表,并将复杂的数学计算转化为任何初学者都能理解并用来做出一致交易决策的简单信号和颜色。 “Atomic Analyst”是专为新手和经验丰富的交易者量身定制的综合交易解决方案。它将高级指标和一流功能融合为一体的交易策略,使其成为所有类型交易者的多功能选择。 日内交易和剥头皮策略:专为快速准确的日内交易和短期交易而设计。 日内和摆动交易策略:可用作追求价格大幅波动的日内和摆动交易者的可靠工具。 多货币和市场:凭借其可靠的精度,在不同的工具和市场上运作。 多个时间框架:可在多个时间框架上使用,性能良好。 稳定性:所有指标均不重绘、不重绘和不滞后,确保可靠的信号。 信号清晰度:提供箭头信号,用于清晰的入场和出场点。 实时警报:通过交易入场、SL和TP警报通知交
Enigmera
Ivan Stefanov
5 (3)
ENIGMERA:市场核心 https://www.enigmera.com 简介 该指标和交易系统是金融市场的一种非凡方法。ENIGMERA 利用分形周期精确计算支撑位和阻力位。它能显示真实的累积阶段,并给出方向和目标。 该系统无论在趋势中还是在修正中都能发挥作用。 它是如何运行的? ENIGMERA 由三条线组成:支撑/阻力线、目标线和偏离线。与一般市场指标将过去的数据推断为现在和未来的情况不同,该系统能提供当前的完整情况。如果你处于支撑位,这意味着真正的支撑;如果你处于阻力位,这意味着真正的阻力。如果突破某一水平,则表示趋势发生变化。没有重绘。 由于市场在不断变化,ENIGMERA 不断调整其评估工具,定期修改策略。  这保证了每种情况都能得到全面评估。这一市场指标的独特性显而易见,其能力不言而喻。  ENIGMERA 为金融分析师和咨询师提供服务,他们需要可靠的见解与客户分享,也为投资者提供服务,他们需要最精确和最可靠的保证。 该系统能够达到最佳精度,使交易者能够自信、清晰地评估他们的选择。 ENIGMERA 将 20 年的交易专长和知识整合到一个综合软件
目前八折优惠! 对任何新手或专家交易者来说都是最好的解决方案! 这个仪表板软件适用于28种货币对。它基于我们的两个主要指标(高级货币强度28和高级货币冲动)。它对整个外汇市场提供了一个伟大的概述。它显示高级货币强度值,货币运动速度和28个外汇对在所有(9)时间段的信号。想象一下,当你可以使用图表上的单一指标观察整个市场,以确定趋势和或剥头皮的机会时,你的交易将得到改善 我们已经在这个指标中建立了一些功能,使你更容易识别强势和弱势货币,同时识别和确认潜在的交易。该指标以图形方式显示货币的强势或弱势是增加还是减少,以及它在所有时间段的表现。 增加的新功能是动态市场斐波那契水平,它适应当前的市场条件变化,这是一个已经在我们的高级货币强度28和高级货币冲动指标中使用的成熟的加分项。 在交易时,总是将弱势货币和强势货币配对,这个新指标将帮助你做到这一点。 用户手册:点击这里  https://www.mql5.com/en/blogs/post/708783 特点  显示每个时间段的ACS28和GAP-speed(冲动)的货币强度值。 列:颜色代码以7种颜色
Advanced Supply Demand
Bernhard Schweigert
4.92 (313)
现在优惠 33%! 任何新手或专业交易者的最佳解决方案! 该指标是一款独特、高质量、且价格合理的交易工具,因为我们已经整合了许多专有功能和新公式。 依据此更新,您将能够显示双重时间帧区域。 您不仅可以显示一个较高的时间帧,还可以同时显示图表时间帧,加上更高的时间帧:显示嵌套时区。 供需双方所有交易者都会喜欢它。 :) 重要信息披露 高级供需的最大潜力,请访问 https://www.mql5.com/zh/blogs/post/720245   想象您的交易如何得以改善,是因为您能够精准定位入场或目标位吗? 构建于新的底层算法,它可以更轻松地识别出买卖双方之间的潜在失衡。 这是因为它以图形方式展示供需最强劲区域,及其过去的表现(显示旧区域)。 这些功能旨在帮助您更轻松地发现最佳入场区域和价位。 现在您可以针对您的交易品种和时间帧来优化和编辑区域强度! 高级供需指标适用于所有产品和时间帧。 它是一个新的公式,非常新的功能是两个区域强度函数可由用户输入进行调整! 这在交易中是一大优势。 当您学习如何使用专有功能,例如带有价格游离最小 X 因子的区域强度时,您能够判断该区域强劲与否。 供
FX Power MT4 NG
Daniel Stein
5 (11)
通过 mql5 和 Telegram 上 的晨间简报获取每日市场更新,包括详细信息和屏幕截图 ! FX Power MT4 NG 是我们长期以来非常受欢迎的货币强度计算器 FX Power 的下一代产品。 这款下一代强度计算器能提供什么?您所喜爱的原版 FX Power 的所有功能 附加功能 黄金/XAU 强度分析 更精确的计算结果 可单独配置的分析周期 可自定义计算限制,以获得更好的性能 为希望查看更多信息的用户提供特殊的多实例设置 无尽的图形设置,可在每个图表中设置您最喜欢的颜色 无数的通知选项,让您再也不会错过任何重要信息 采用 Windows 11 和 macOS 风格的全新圆角设计 神奇的移动指标面板 FX Power 主要功能 所有主要货币的完整强势历史 所有时间框架内的货币强弱历史 所有经纪商和图表的计算结果完全相同 100% 可靠的实时计算 -> 无重绘 可通过下拉列表选择分析时段 通过自定义模式单独配置分析时段 可在一个图表中使用多个实例 可移动 FX Power 显示屏(通过拖放) 适用于高分辨率 QHD、UHD 和 4K 显示器 自动终端配置 针对平板电脑
TPSproTREND PrO
Roman Podpora
4.78 (18)
TPSpro TRENDPRO  - is a trend indicator that automatically analyzes the market and provides information about the trend and each of its changes, as well as giving signals for entering trades without redrawing! The indicator uses each candle, analyzing them separately. referring to different impulses - up or down impulse. Exact entry points into transactions for currencies, crypto, metals, stocks, indices!  -  Version MT5               DETAILED DESCRIPTION                R ecommended to use with
Quantum Trend Sniper Indicator MT4
Bogdan Ion Puscasu
4.6 (40)
介绍   量子趋势狙击指标 ,突破性的 MQL5 指标,正在改变您识别和交易趋势反转的方式!由拥有超过13年交易经验的资深交易员团队开发,     量子趋势狙击指标   旨在通过其创新的方式以极高的准确度识别趋势反转,将您的交易之旅推向新的高度。 ***购买量子趋势狙击指标,即可免费获得量子突破指标!*** 当量子突破指标识别出趋势反转时,它会向您发出警报和信号箭头,并建议您三个止盈水平。 它既适合新手交易者,也适合专业交易者。 量子 EA 通道:       点击这里 MT5版本:       点击这里 建议: 时间范围:  所有时间范围。为了获得最佳结果,我们建议在 M15、M30 和 H1 时间范围内使用它。 货币对:欧元兑美元、英镑兑美元、澳元兑美元、欧元兑英镑, EURAUD, XAUUSD 账户类型:ECN、Raw 或 Razor,点差极低 经纪时间:任意 经纪商:IC Markets、Pepperstone with Raw 和 Razor 的点差最低 建议止损:50 点 建议止盈水平:20 点、50 点和 1
PRO Renko System
Oleg Rodin
5 (25)
PRO Renko Arrow Based System for trading renko charts.  准确的信号交易任何外汇工具. 另外,我将免费提供系统的附加模块! PRO Renko系统是RENKO图表上高度准确的交易系统。该系统是通用的。 该交易系统可应用于各种交易工具。 该系统有效地中和了所谓的市场噪音,打开了获得准确反转信号的通道。 该指标易于使用,只有一个参数负责产生信号。 您可以很容易地使算法适应您感兴趣的交易工具和renko酒吧的大小。 我很乐意通过提供任何咨询支持来帮助所有客户有效地使用该指标。 祝您交易成功!购买后,立即写信给我! 我将与您分享我的建议和我的renko发电机。 另外,我将免费提供系统的附加模块!
TrendDecoder Premium
Christophe Pa Trouillas
5 (6)
确定范围和下一步可能的走势   |  获得早期信号和趋势强度   |  在反转之前获得明确的退出   |  了解价格将测试哪些斐波水平 非重绘、非延迟指标 - 手动和自动交易的理想选择 - 适用于所有资产和所有时间单位 限时优惠 >>   50% OFF 购买后,  请联系我的频道  获取推荐设置 MT5   版本: 点击此处 使用   BladeSCALPER   和   PowerZONES   获取我们的完整方法 它是什么? TrendDECODER 集多种创新于一身,使趋势监测变得简单易行。 投射趋势线(Projective TrendLine)--快速参考即将到来的趋势 实时趋势线(RealTime TrendLine)与投射趋势线(Projective TrendLine)的对比 - 与之前的同方向走势相比,市场是加速还是放缓? 实时趋势线交叉 - 趋势正在偏离轨道 使用 GreyBox - 市场不再是趋势并进入新的过渡序列 使用 DecoderSignals 和 Blue/Orange Clouds - 利用作为动态支撑/阻力的 Blue/Orange
FX Volume
Daniel Stein
4.6 (35)
通过 mql5 和 Telegram 上 的 " 晨间简报 "获取每日市场更新,包括详细信息和屏幕截图 ! 外汇交易量(FX Volume)是第一个也是唯一一个从经纪商角度真正洞察市场情绪的交易量指标。 直接在您的图表上看到这些信息是真正改变游戏规则和突破性的交易解决方案。 受益于独特的市场数据洞察,如 比率(Ratios )显示货币多头和空头头寸的比率(百分比 比率变化 显示所选时间段内的多头比率及其百分比变化 总交易量 显示货币的总交易量(多头和空头),以手为单位 多头 交易量显示货币所有多头头寸的交易量 空头 交易量显示所有货币空头头寸的交易量 净多头 显示净多头交易量,即所有多头头寸减去所有空头头寸(以手为单位)。 净多头百分比 显示货币净多头交易量的变化 请阅读我们的基本教程 -> "如何使用外汇交易量进行交易 " 获取更多信息,如常见问题、交易技巧和教程视频,请访问我们的 外汇交易量公共信息频道 请 安装并运行 SI Connect 以建立与我们数据中心的持续连接 背景信息 我们都知道,外汇是一个分散的市场。这就是为什么我们必须打破常规思维,开发一个独
Quantum Breakout Indicator PRO
Bogdan Ion Puscasu
4.96 (26)
介绍     Quantum Breakout PRO   ,突破性的 MQL5 指标,正在改变您交易突破区域的方式!   Quantum Breakout PRO 由拥有超过 13 年交易经验的经验丰富的交易者团队开发,旨在通过其创新和动态的突破区域策略将您的交易之旅推向新的高度。 量子突破指标将为您提供带有 5 个利润目标区域的突破区域的信号箭头,以及基于突破框的止损建议。 它既适合新手交易者,也适合专业交易者。 量子 EA 通道:       点击这里 MT5版本:   点击这里 重要的!购买后请私信我领取安装手册。 建议: 时间范围:M15 货币对:GBPJPY、EURJPY、USDJPY、NZDUSD、XAUUSD 账户类型:ECN、Raw 或 Razor,点差极低 经纪商时间:GMT +3 经纪商:IC Markets、Pepperstone with Raw 和 Razor 的点差最低 规格: 不重漆! 最多 5 个建议利润目标区域 建议止损水平 可定制的盒子。您可以设置自己的 Box Time Start 和 Box Time E
TakePropips Donchian Trend Pro
Eric John Pajarillaga Aldana
4.82 (17)
TakePropips Donchian Trend Pro   (MT4) 是一款功能强大且有效的工具,可使用 Donchian 通道自动检测趋势方向,并为您提供进场和退场交易信号! 这个多功能指标包括趋势扫描器、交易信号、统计面板、筛选器、交易时段和警报历史仪表板。它旨在为您提供交易信号并节省您分析图表的时间! 您可以在我们的博文中下载用户手册和安装指南:   https   :// www.mql5.com/en/blogs/post/751368 今天立减 50%!价格从 98 美元降到 49 美元! 您可以在 Strategy Tester 上测试该指标(启用可视模式) 视频教程也可在说明下方获得更多详细信息。 如果您有任何问题或需要任何帮助,请与我联系。 TakePropips Donchian Trend Pro 指标适用于所有外汇对、金属、商品、指数和加密货币。 主要特点 交易信号 - 检测多个时间范围内所有货币对的买卖机会。它将为您提供警报并在图表上绘制交易信号,最多 3 个止盈价和一个止损价。 Trend Scanner   - 用于快速扫描和识别跨多个时间
Advanced Currency IMPULSE with ALERT
Bernhard Schweigert
4.91 (495)
目前31%的折扣!! 对任何新手或专家交易者来说都是最好的解决方案! 这个指标是一个独特的、高质量的、负担得起的交易工具,因为我们已经纳入了一些专有的功能和一个秘密的公式。只需一张图表,它就能给出所有28种货币对的警报。想象一下,你的交易将如何改善,因为你能够准确地确定新趋势或剥头皮机会的触发点 建立在新的基础算法上,它使识别和确认潜在交易变得更加容易。这是因为它以图形方式显示了一种货币的强势或弱势是否正在加速,并测量了这种加速的速度--把它想象成你汽车中的速度表。当你加速时,事情显然会发生得更快,这在外汇市场上也是一样的,即如果你配对的货币正在向相反的方向加速,你就会发现一个潜在的有利可图的交易。 货币动量的垂直线和箭头将指导你的交易! 动态的市场斐波那契23水平被用作警报触发器,将适应市场活动。如果冲动触及黄色触发线,您将在MetaTrader或您的电子邮件或推送警报中收到警报。然后你就知道作为一个交易员应该做什么。货币对和方向已经给出。只要点击警报按钮,就可以切换到该货币对或打开一个新的图表,以便进一步分析。警报级别可以通过用户输入来改变,可以选择3个敏感度级别
Up down v6T
Guner Koca
5 (1)
Thise indicator is up down v6  comes with tradingwiev pinescript. purchased people, after installed on terminal ,contact me on mql5  to get BONUS  TradingView pinescript. up-down indicator is no repaint and works all pairs and lower than weekly time frames charts. it is suitable also 1 m charts for all pairs. and hold long way to signal. dont gives too many signals. when red histogram cross trigger line that is up signal.and price probably will down when blue histogram cross trigger line that
Indicator : RealValueIndicator Description : RealValueIndicator is a powerful tool designed specifically for trading on the EURUSD pair. This indicator analyzes all EUR and USD pairs, calculates their real currency strength values, and displays them as a single realistic value to give you a head start on price. This indicator will tell you moves before they happen if you use it right. RealValueIndicator allows you to get a quick and accurate overview of the EURUSD currency pair tops and bottoms,
Gold Channel XAUUSD
Paulo Rocha
5 (2)
Gold Channel is a volatility-based indicator, developed with a specific timing algorithm for the XAUUSD pair, which consists of finding possible corrections in the market. This indicator shows two outer lines, an inner line (retracement line) and an arrow sign, where the theory of the channel is to help identify overbought and oversold conditions in the market. The market price will generally fall between the boundaries of the channel. If prices touch or move outside the channel it is a tra
Gann Signal
Kirill Borovskii
Gann Signal is a very simple indicator at first glance, but hidden inside is many years of experience in studying W.D.Ganna methods. The indicator gives accurate BUY/SELL signals, without redrawing. The indicator is very easy to use. All you need to do is attach it to your chart and follow its recommendations. The indicator constantly analyzes the market for entry opportunities. When such an opportunity appears, the indicator gives a signal in the form of an arrow. I repeat, all signals are NOT
Cycle Sniper
Elmira Memish
4.39 (36)
NEW YEAR SALE PRICE FOR LIMITED TIME!!! Please contact us after your purchase and we will send you the complimentary indicators to complete the system Cycle Sniper is not a holy grail but when you use it in a system which is explained in the videos, you will feel the difference. If you are not willing to focus on the charts designed with Cycle Sniper and other free tools we provide, we recommend not buying this indicator. We recommend watching the videos about the indiactor and system before pu
Please send me Direct message on MQL5 CHAT after purchasing the Indicator for Training and Installation Support There are some additional files that is important to use with the Indicator . So be sure to contact me after purchasing the Indicator So that I can add you for training and support . If you find any difficulty with installation then send me Direct message here So that I can connect with you via Anydesk or Teamview for the product installation. " Smart Order Block Indicator " to find
Currency Strength Exotics
Bernhard Schweigert
4.88 (33)
目前8折优惠! 对任何新手或专家交易者来说都是最好的解决方案! 这个指标是专门用来显示任何符号的货币强度,如异国货币对、商品、指数或期货。它是同类产品中的第一个,任何符号都可以添加到第9行,以显示黄金、白银、石油、DAX、US30、MXN、TRY、CNH等的真实货币强度。这是一个独特的、高质量的、负担得起的交易工具,因为我们已经纳入了一些专有的功能和一个新的公式。想象一下,你的交易将如何改善,因为你能够准确地确定新趋势或剥头皮机会的触发点? 用户手册:点击这里   https://www.mql5.com/en/blogs/post/708876 它适用于所有时间框架。你将很快能够看到TREND! 根据新的基础算法设计,它使识别和确认潜在交易变得更加容易。这是因为它以图形方式显示了8种主要货币和一种符号的强弱。 该指标显示了8种主要货币(澳元加元瑞士法郎欧元英镑日元新西兰美元)的强弱线,再加上一个符号! 该指标显示了符号的真实价值。例如:对于XAUUSD(黄金):价格以美元报价。如果黄金在上涨,你怎么能知道是黄金的强势还是美元的弱势?只有当黄金走强时,我们才会进行
TrendMaestro
Stefano Frisetti
5 (3)
note: this indicator is for METATRADER4, if you want the version for METATRADER5 this is the link:  https://www.mql5.com/it/market/product/108106 TRENDMAESTRO ver 2.4 TRENDMAESTRO recognizes a new TREND in the bud, he never makes mistakes. The certainty of identifying a new TREND is priceless. DESCRIPTION TRENDMAESTRO identifies a new TREND in the bud, this indicator examines the volatility, volumes and momentum to identify the moment in which there is an explosion of one or more of these data a
Basic Harmonic Patterns Dashboard
Mehran Sepah Mansoor
5 (2)
该仪表盘显示所选符号的最新可用谐波形态,因此您可以节省时间并提高效率 /  MT5 版本 。 免费指标:  Basic Harmonic Pattern 指标列 Symbol: 显示所选符号 Trend:   看涨或看跌 Pattern:  形态类型(Gartley、蝴蝶、蝙蝠、螃蟹、鲨鱼、Cypher 或 ABCD) Entry:   入口价格 SL: 止损价 TP1: 第一止盈价 TP2: 第二次获利价格 TP3: 第三次获利价格 Current price:  当前价格 Age (in bars): 最后绘制的模式的年龄 主要输入 Symbols : 从 "28 种主要货币对 "或 "选定符号 "中选择。 Selected Symbols : 希望监控的符号,用逗号分隔("EURUSD,GBPUSD,XAUUSD")。如果您的经纪商为货币对设置了后缀或前缀,您必须在以下两个参数中添加(货币对前缀或货币对后缀)。 Max Iteration: 调整模式的最大迭代次数(如果该值越小,则模式越少,性能越快;如果该值越大,则模式越多,性能越慢)。事实上,它的工作原理如下:如
norepaint buy sell indicator is norepaint indicator.and works all pairs and all timeframes. using is wery simple ,it puts arrow on price probably buy sell arrows. thise indicator is suitable for beginner and experienced traders. there is cnt numbers that show how many bars you see the signal back. increasing it possible but up to chart have the how many bars . minimum value of this 500.
GOLD Impulse with Alert
Bernhard Schweigert
4.56 (9)
这个指标是我们2个产品 Advanced Currency IMPULSE with ALERT  +   Currency Strength Exotics 的一个超级组合。 它适用于所有时间框架,并以图形方式显示8种主要货币和一种符号的强势或弱势冲动! 该指标专门用于显示任何符号的货币强度加速,如黄金、异国货币对、商品、指数或期货。这是它的第一个指标,任何符号都可以被添加到第9行,以显示黄金、白银、石油、DAX、US30、MXN、TRY、CNH等的真实货币强度加速(冲动或速度)。 建立在新的基础算法上,它使识别和确认潜在的交易更加容易。这是因为它以图形方式显示了一种货币的强势或弱势是否正在加速,并测量了这种加速的速度--把它想象成你汽车中的速度表。当你加速时,事情显然会发生得更快,这在外汇市场上也是一样的,即如果你配对的货币正在向相反的方向加速,你就会发现一个潜在的有利可图的交易。 动态市场斐波那契28水平被用作警报触发器,将适应市场活动。如果冲动击中黄色触发线,你将收到警报。然后你就知道作为一个交易员应该做什么。货币对和方向已经给出。只需点击警报按钮,就可以
Introduction to Fractal Pattern Scanner Fractal Indicator refers to the technical indicator that makes use of the fractal geometry found in the financial market. Fractal Pattern Scanner is the advanced Fractal Indicator that brings the latest trading technology after the extensive research and development work in the fractal geometry in the financial market. The most important feature in Fractal Pattern Scanner is the ability to measure the turning point probability as well as the trend probabi
NextCandlePredictor No Repaint
Martin Alejandro Bamonte
NextCandlePredictor 指标 NextCandlePredictor 是一种带有警报的信号指标,不会重绘,不会改变颜色,不会移动,不会消失且没有延迟。它将帮助您识别任何时间框架内的下一个或即将到来的蜡烛的方向。高度推荐用于纽约、伦敦或甚至两者重叠等高波动市场。 主要特征: 时间框架的多功能性: 提供在任何时间框架内快速准确的信号,从 M1 到 H1 及更长时间。 清晰的买入/卖出信号: 使用 ADX 的 DI+ 和 DI- 线生成清晰的买入和卖出信号,确保您做出最佳的交易决策。 直观的可视化: 信号直接显示在图表上,绿色(买入)和红色(卖出)箭头,允许快速和轻松的读取。 可自定义的设置: 根据您的偏好和交易策略调整分析的柱数和警报选项。请根据您希望使用的 TF 查看下面的建议表。 即时和蜡烛收盘时的可选警报: 默认情况下,警报会在满足 ADX 条件的同一蜡烛上发出,确保信号的及时性。您还可以选择在当前蜡烛收盘时接收警报以获得更多确认。 快速性能: 设计为高效运行,理想用于高频操作和快速决策。 不重绘: 一旦信号发出,它将固定在当前蜡烛上,不会移动、改变颜色或消失。 无延
Automated Trendlines
Georgios Kalomoiropoulos
5 (17)
趋势线是外汇交易中最重要的技术分析工具。不幸的是,大多数交易者没有正确绘制它们。自动趋势线指标是专业交易者的专业工具,可帮助您可视化市场的趋势运动。 有两种类型的趋势线看涨趋势线和看跌趋势线。 在上升趋势中,外汇趋势线是通过价格变动的最低摆动点绘制的。 连接至少两个“最低点”将创建一条趋势线。 在下跌趋势中,趋势线是通过价格走势的最高摆动点绘制的。 连接至少两个“最高点”将创建一条趋势线。 趋势线何时突破? 当看跌蜡烛收于看涨​​趋势线下方并且蜡烛的高点在趋势线上方时,看涨趋势线会被打破。 当看涨蜡烛收于看跌趋势线上方并且蜡烛的低点低于趋势线时,看跌趋势线会被打破。 趋势线何时删除? 当一根完整的蜡烛在看涨趋势线下方形成时,看涨趋势线将被删除。 当完整的蜡烛在看跌趋势线上方形成时,看跌趋势线将被删除。 您可以从输入参数更改看涨和看跌趋势线的颜色和宽度。
作者的更多信息
Line Profit
Iurii Tokman
5 (4)
Line Profit   存款货币的可视利润线指标。仅当市场上有安装指标的符号的未平仓头寸时才有效。您可以用鼠标移动线或启用自动跟踪买入价。 指标设置说明: colotLine - 线条颜色 WidthLine - 线宽 colotText - 文本颜色 FontSize - 文本的高度 Anchor - 文本的锚点方法 FollowBid - 跟随买入价 Line Profit   存款货币的可视利润线指标。仅当市场上有安装指标的符号的未平仓头寸时才有效。您可以用鼠标移动线或启用自动跟踪买入价。 指标设置说明: colotLine - 线条颜色 WidthLine - 线宽 colotText - 文本颜色 FontSize - 文本的高度 Anchor - 文本的锚点方法 FollowBid - 跟随买入价
FREE
ChannelRSI5
Iurii Tokman
5 (4)
ChannelRSI5   具有超买和超卖区域动态水平的相对强弱指数 (RSI) 指标。 动态水平随指标和价格的当前变化而变化和调整,代表一种通道。 指标设置 period_RSI - 计算 RSI 指数的平均周期。 Applied_RSI - 应用价格。它可以是任何价格常数:PRICE_CLOSE - 收盘价,PRICE_OPEN - 开盘价,PRICE_HIGH - 期间的最高价,PRICE_LOW - 期间的最低价,PRICE_MEDIAN - 中间价(高 + 低) / 2, PRICE_TYPICAL - 典型价格(最高价 + 最低价 + 收盘价)/ 3, PRICE_WEIGHTED - 加权平均价,(最高价 + 最低价 + 收盘价 + 收盘价)/ 4。 period_channel - 超买超卖区域动态通道的计算周期。
FREE
Robo T
Iurii Tokman
Robo T   Robo T Expert Advisor 是一个非指标交易系统。 顾问设置说明: Level_ord   - 与当前价格的距离,用于放置开始挂起的 Buy Stop 和 Sell Stop 订单,默认为 22。 Lot_1   - 一系列购买的初始手数,默认为 0.1。 Lot_2   - 一系列销售的初始手数,默认为 0.1。 TakeProfit   - 利润水平,默认为 30。 TSProfitOnly   - 仅拖网利润。禁用时,尾随也会出现在止损的负区域。默认值为真。 TStop.Buy   - 购买的尾随点数,默认为 13。 TStop.Sell   - 以点为单位的跟踪销售点数,默认为 13。 TrailingStep   - 以点为单位的尾随步长,默认为 2。 level_1   - 放置平均订单的回撤距离,默认为 40。 level_2   - 放置平均挂单的当前价格的距离,默认为 15。 сoef_lot_1   - 平均订单的手数倍增因子,默认为 1.5。 Lot_Digits   - 手数中小数点后的位数。如果最小手数 = 0.1,则 Lot
StopLevel
Iurii Tokman
5 (2)
StopLevel   仪表控制 STOPLEVEL 水平。当液位发生变化时,它会发出警报信号。 STOPLEVEL - 设置止损订单的当前收盘价的最小抵消点数,或允许的最小止损/止盈点数。 STOPLEVEL 的零值意味着没有限制止损/止盈的最小距离,或者交易服务器使用外部机制进行动态水平控制,无法传输到终端。在第二种情况下,STOPLEVEL 实际上是“浮动的”。 指标设置: color_ - 级别的区域颜色 draw_bars - 用于显示级别区域的条数 width_price - 价格标签的厚度   仪表控制 STOPLEVEL 水平。当液位发生变化时,它会发出警报信号。 STOPLEVEL - 设置止损订单的当前收盘价的最小抵消点数,或允许的最小止损/止盈点数。 STOPLEVEL 的零值意味着没有限制止损/止盈的最小距离,或者交易服务器使用外部机制进行动态水平控制,无法传输到终端。在第二种情况下,STOPLEVEL 实际上是“浮动的”。 指标设置: color_ - 级别的区域颜色 draw_bars - 用于显示级别区域的条数 width_price - 价格标签的厚度
FREE
MovingInWL
Iurii Tokman
MovingInWL   Expert Advisor 旨在在达到某个预定利润水平时将未平仓头寸的止损移至无亏损。 顾问设置说明: MagicNumber - 订单标识符 LevelProfit - 位置必须达到的利润水平,以点为单位,以便将其止损移动到没有损失的水平。 LevelWLoss - 不亏损的点数水平,当其盈利达到 LevelProfit 点数 水平后,止损头寸将转移到该水平。 MovingInWL   Expert Advisor 旨在在达到某个预定利润水平时将未平仓头寸的止损移至无亏损。 顾问设置说明: MagicNumber - 订单标识符 LevelProfit - 位置必须达到的利润水平,以点为单位,以便将其止损移动到没有损失的水平。 LevelWLoss - 不亏损的点数水平,当其盈利达到 LevelProfit 点数 水平后,止损头寸将转移到该水平。
FREE
Shadow Height mt5   阴影指示器。 将烛台阴影的大小(以点为单位)显示为直方图。在两种模式下工作,用户可选择。 指标设置说明 Mode - 指标操作模式,两种模式:第一种高度 - 上下烛台阴影的显示模式;第二个区别是显示烛台阴影差异的模式,上下烛台阴影之间的差异。 Shadow Height mt5   阴影指示器。 将烛台阴影的大小(以点为单位)显示为直方图。在两种模式下工作,用户可选择。 指标设置说明 Mode - 指标操作模式,两种模式:第一种高度 - 上下烛台阴影的显示模式;第二个区别是显示烛台阴影差异的模式,上下烛台阴影之间的差异。   阴影指示器。 将烛台阴影的大小(以点为单位)显示为直方图。在两种模式下工作,用户可选择。 指标设置说明 Mode - 指标操作模式,两种模式:第一种高度 - 上下烛台阴影的显示模式;第二个区别是显示烛台阴影差异的模式,上下烛台阴影之间的差异。
FREE
Comb
Iurii Tokman
3.5 (2)
Comb   指示器显示蜂窝网格或正六边形。替代标准交易终端网格。 指标设置说明: color_comb - 网格颜色 width - 宽度,例如:22为1920*1080分辨率的屏幕,15为1366*768分辨率的屏幕等。 height - 高度,例如:6代表分辨率为1920*1080的屏幕,4代表分辨率为1366*768的屏幕等。   指示器显示蜂窝网格或正六边形。替代标准交易终端网格。 指标设置说明: color_comb - 网格颜色 width - 宽度,例如:22为1920*1080分辨率的屏幕,15为1366*768分辨率的屏幕等。 height - 高度,例如:6代表分辨率为1920*1080的屏幕,4代表分辨率为1366*768的屏幕等。
FREE
Hammering
Iurii Tokman
Hammering   Hammering 是一种自动交易系统,旨在处理任何货币对。交易时,使用多币种和单币种模式。 为了做出交易决策,EA 使用来自 斜率方向线 指标的信号。 设置说明。 Profit_Percent_AccountEquity = 0.4; - 利润水平占可用资金的百分比 Fix_AccountEquity = 0; - 免费资金的强制性水平 FIX_PROFIT = 1000; - 强制利润水平 周期 = 55; - 指标期。 过滤器编号 = 2; - 指标过滤器。 ma_method = 3; - 指标的平均方法。 应用价格 = 0;是指标的使用价格。 TF = 15; - 指标的图表周期。 PAIRS = "EURUSD, GBPUSD, USDCHF, USDJPY"; - 一组用于多货币交易的货币对。 幻数 = 6; - 顾问的订单标识符 TrailingStart = 9.5; - 以点为单位的利润水平。拖网的起始水平,在此之后进行拖网,即开启拖网。 追踪止损 = 0.5; - 以存款货币为单位的固定拖网规模 尾随步长 = 0.5; - 存款货币的尾随步
Robo Grid FX
Iurii Tokman
Robo Grid FX   ROBO GRID FX 是一个网格专家顾问。 专为活跃市场和快速货币对的日内交易而设计。它是一个具有封闭平均系统的网格顾问。在快速和激进的货币对出现存款减少的情况下,闭环平均系统是一种稳定的盈亏平衡策略。 EA 在两个方向放置一个挂单网格,如果出现负仓位,则在价格波动突破 40-60 点走廊时将其锁定。并且它开始显示在网格内部(无需在两个方向移除暴露的网格)以达到盈亏平衡。并且报价在哪个方向(向上或向下)中断通道并不重要。 EA 不会让市场头寸回撤超过 25-40 点,止损和止盈会根据情况和报价的方向或反转不断修改。随着强劲的趋势运动,机器人只是跟随趋势。 所有计算都是根据专家核心内部的预定算法执行的。因此,“EA 交易”具有最少的设置集,这使其更易于使用。 EA 还具有针对浮动点差的保护,这使其运行更加稳定,并确保在浮动点差快速变化的情况下正确放置网格。智能交易系统显示反弹、强劲趋势和重要经济新闻的最佳结果。 设置说明: 批量 - 数量。 步骤 - 订单之间的步骤。 Steps Sell - 第一个村庄和第一个购买之间的距离。 TakeProfit -
Crazy Scalper
Iurii Tokman
3.5 (4)
Crazy Scalper   Crazy Scalper 是一种非指标交易机器人,它使用剥头皮系统同时在两个方向进行交易(买入和卖出)。同时,多向仓位无法盈利,其中一个仓位必然会亏损。如果有亏损仓位,则使用锁(lock)。反过来,如果锁定头寸没有完成其作用并且报价反转,则根据平均系统,使用挂单无损失地使用提款。 MT5 终端 智能交易系统 设置说明 止盈 = 3;   - 以点为单位的利润水平; Lock_Level = 22;   - 下锁订单的距离,以点为单位; coef_l = 1.8;   - 大量锁定订单的乘数; 止盈_Av = 10;   - 所有未结订单的总利润水平; AV_Level = 50;   - 触发平均顺序的距离,以点为单位; OR_Level = 24;   - 从当前价格到放置平均挂单水平的距离; coef_av = 2.0;   - 很多平均订单的乘法系数; 手数 = 0;   - 订单量,如果= 0,MM有效; 风险 = 0.3;   - MM 工作的百分比水平; Choice_method = false;   - MM的工作方法,来自免费资金
Pyramid MA
Iurii Tokman
5 (1)
Pyramid MA   金字塔 MA   - 顾问特性:它使用移动平均线 (MA) 指标。当趋势逆转时更改订单网格。主要交易网格的订单量相对于平均仓位增加的指数。处理挂单 BUYSTOP 和 SELLSTOP。使用损失平均系统来控制未平仓交易的余额并使它们达到收支平衡。有关未完成和已完成交易的声音通知。您可以基于 PYRAMID MA Expert Advisor 轻松创建自己的交易策略。 顾问设置说明: koef_grid = 0.5 - 大量网格订单的倍增因子 指标设置: tf_grid = 0 - 下单时接收指标信号的图表周期。可以是图表上的期间之一。 0 表示当前图表的周期。 1分钟。 5 - 5 分钟。 15-15 分钟。 30 - 30 分钟。 60 - 1 小时240 - 4 小时。 1440 - 1 天。 10080 - 1 周。 43200 - 1 个月。 tf_lock = 60 - 锁定订单时从指标接收信号的图表周期 tf_aw = 60 - 平均订单时从指标接收信号的图表周期 shift = 1 - 从指标缓冲区接收值的索引(相对于当前柱移动指定的周期数)
Boom
Iurii Tokman
Boom   交易机器人基于指标分析。交易决策是根据移动平均线的读数做出的,指标可以使用外部变量进行配置: TF = 0 - 选择图表的工作周期。可以是图表上的期间之一。 0 表示当前图表的周期。 1分钟。 5 - 5 分钟。 15-15 分钟。 30 - 30 分钟。 60 - 1 小时240 - 4 小时。 1440 - 1 天。 10 080 - 1 周。 43,200 - 1 个月。 shift = 0 - 从指标缓冲区接收值的索引(相对于当前柱移动指定的周期数)。 period_fast = 5 - 快速移动平均线指标的周期。 period_slow = 12 - 缓慢移动平均线指标的周期。 mehod = 0 - 平均法。可以是任何移动平均法值。 0 - (SMA) 简单移动平均线。 1 - (EMA) 指数移动平均线。 SMMA 2 - (SMMA) 平滑移动平均线。 LWMA 3 - (LWMA) 线性加权移动平均线。 应用 = 0 - 应用价格。可以是任何价格常数。 0 - (CLOSE) 收盘价。 1 - (OPEN) 开盘价。 2 - (HIGH) 最高价。 3
Forex Jumper
Iurii Tokman
1 (1)
Forex Jumper   Forex Jumper   - 设计用于处理 EURJPY 货币对的智能交易系统。烛台形态分析是做出交易决策的信号。 EA 在交易时使用挂单 BUYSTOP 和 SELLSTOP。 设置: Lot = 0 - 手动设置已开订单的数量 Risk = 13 - MM 的风险百分比,适用于 Lot = 0 MagicNumber = 208 - 顾问的订单和仓位标识符,幻数 TP = 20 - 当市场上有一个单向未平仓头寸时的虚拟利润水平(以点为单位) TP2 = 20 - 当市场上有多个单向持仓时,以点为单位的虚拟利润水平 StopLoss = 500 - 以点为单位的损失水平,如果值为 0(零),则不设置该水平 count_BUY = 1 - 限制市场上同时存在的买单数量,0 时不下单 count_SELL = 1 - 限制市场中同时存在的卖单数量,0 时不下单 滑点 = 3 - 滑点水平,以点为单位 优化顾问外部设置的建议: Start Step Stop TP 1 1 300 TP2 1 1 300 StopLoss 10 2 1000 coun
Bands Jazz
Iurii Tokman
Bands Jazz   Bands Jazz   - EA 交易基于对 布林带 指标信号的分析。 Expert Advisor 的算法很简单,它使用 SL、TP 和未平仓头寸的拖网。 设置说明 TimeBeginHour   - 数字,设置交易开始时间的小时。值从 0 - 24。 TimeBeginMinute   - 数字,设置交易开始时间的分钟数。值从 0 - 60。 TimeEndHour   - 数字,设置交易结束的小时。值从 0 - 24。 TimeEndMinute   - 数字,设置交易结束时间的分钟数。值从 0 - 60。 period   - 计算布林带指标的平均周期。 偏差 - 布林带指标主线的标准偏差数。 band_shift   - 指标相对于布林带指标价格图表的移动。 Applied_price   - 布林带指标的应用价格。 shift   - 从指标缓冲区接收的值的索引(相对于当前柱向回移动指定的周期数),用于布林带指标。 SL   - 损失水平限制,以点为单位 TP   - 预期利润水平,以点为单位 MN   - 订购幻数。用作用户定义的标识符。
Smart YTG
Iurii Tokman
4.67 (6)
Smart YTG   MT5 终端的顾问版本。   |   所有产品 Smart YTG 用于处理 GBPUSD 货币对,图表周期 H1。从本质上讲,该系统具有趋势并且在带有 STOP 订单的价格变动趋势部分完美运行,趋势是通过分析 内置于 EA 内部的价格通道 指标来确定的;无需额外安装该指标。在平盘区,当行情优柔寡断且行情进一步走势确定时,提现系统开始运行而不会亏损,如果市场上有与价格走势方向相反的头寸,则为价格变动方向与订单重叠,当达到总利润时平仓整个系列仓位,而Equity不下跌,保持平衡线,从测试结果可以看出。 代码中的大量计算,以及其中最大的一部分,恰好属于市场形成平台的时刻,您需要在没有回撤和亏损的情况下摆脱它进入趋势。为此,有一个用于动态平仓和静态平仓的块。 动态平仓 - 当强制平仓订单达到设定的总利润时平仓。 静态 - 计算价格水平,当达到该水平时,所有未平仓头寸将产生利润,并将所有未平仓头寸的止盈和止损修改为该水平。两个区块都有自己的设置,可以相互独立工作。使用 EA 交易时,可以同时使用这两个块,因为它们弥补了缺点并在工作中相互补充。 例如:假设由于各种原因,例
Eureka Lock
Iurii Tokman
Eureka Lock   Eureka Lock   - EA 确定相对于指定设置的价格变动的平坦区域。交易是通过从指定平面的边界挂单 BUY STOP 和 SELL STOP 进行的。使用增加的交易量锁定亏损头寸,而不是限制损失。还使用了虚拟利润水平。 设置说明: TF_flet = 15 - 将确定平台的图表周期 Bars_flet = 25 - 确定平盘的柱数 extern int Size_flet = 30 - 限制平面(高度)上下边界之间的距离,以磅为单位 otstyp = 5 - 用于放置挂单的平面边界的偏移量 手数 = 0.1 - 订单量 koef_lot = 2 - 锁定订单的乘数 TakeProfit = 100 - 为设置的手数设置计算虚拟利润水平,以点为单位 MagicNumber = 1975 - 订单的幻数 NumberOfTry = 5 - 经纪人重新报价的交易尝试次数 滑点 = 3 - 滑点水平,以点为单位
Orders Info
Iurii Tokman
Orders Info   该指标在一个图表窗口中显示摘要、一般信息。方便同时交易多个货币对。 该指标指示市场头寸和挂单总数。 单独表示未平仓头寸: 对于货币对, 对于该货币对的未平仓购买数量及其在存款货币中的总利润, 关于公开销售的数量及其总利润, 未平仓买入和卖出头寸的总利润。 对于挂单,表示: 对于货币对,挂单的名称及其编号。   该指标在一个图表窗口中显示摘要、一般信息。方便同时交易多个货币对。 该指标指示市场头寸和挂单总数。 单独表示未平仓头寸: 对于货币对, 对于该货币对的未平仓购买数量及其在存款货币中的总利润, 关于公开销售的数量及其总利润, 未平仓买入和卖出头寸的总利润。 对于挂单,表示: 对于货币对,挂单的名称及其编号。
Adaptive MA
Iurii Tokman
Adaptive MA   移动平均线。计算方法是柱形定义中使用的所有价格的平均值。 指标外部设置说明: MA_period   - 计算指标的平均周期。推荐值:5、13、21、34。 ma_method   - 平均方法。可以是任何移动平均法值。 0 - (SMA) 简单移动平均线。 1 - (EMA) 指数移动平均线。 SMMA 2 - (SMMA) 平滑移动平均线。 LWMA 3 - (LWMA) 线性加权移动平均线。   移动平均线。计算方法是柱形定义中使用的所有价格的平均值。 指标外部设置说明: MA_period   - 计算指标的平均周期。推荐值:5、13、21、34。 ma_method   - 平均方法。可以是任何移动平均法值。 0 - (SMA) 简单移动平均线。 1 - (EMA) 指数移动平均线。 SMMA 2 - (SMMA) 平滑移动平均线。 LWMA 3 - (LWMA) 线性加权移动平均线。
Cardiogram Market   设置说明: MA_period_fast   - 用于计算快速移动平均线的平均周期。 MA_period_slow   - 计算慢速移动平均线的平均周期。 price   - 要使用的价格。可以是任何价格常数。 0 - (CLOSE) 收盘价。 1 - (OPEN) 开盘价。 2 - (HIGH) 高价。 3 -(低)最低价格。 4 - (MEDIAN) 平均价格,(高 + 低)/ 2。 5 -(典型)典型价格,(最高价 + 最低价 + 收盘价)/ 3。 6 - (加权)加权收盘价,(最高价 + 最低价 + 收盘价 + 收盘价)/ 4。 方法 - 平均方法。可以是任何移动平均法值。 0 - (SMA) 简单移动平均线。 1 - (EMA) 指数移动平均线。 SMMA 2 - (SMMA) 平滑移动平均线。 LWMA 3 - (LWMA) 线性加权移动平均线。
Piramida Grid
Iurii Tokman
Piramida Grid   Piramida Grid - 进入市场,顾问分析 斜率方向线 指标的读数。当市场反转时改变订单网格。处理挂单 BUYSTOP 和 SELLSTOP。使用损失平均系统来控制未平仓交易的余额及其无损失的输出。自动检测 6 位和 5 位数字。 顾问设置: 周期 = 32; - 斜坡方向线指示器的周期 过滤器编号 = 2; - 设置坡度方向线指示器的过滤器 ma_method = 3; - 平滑斜率方向线指标读数的方法 应用价格 = 0; - 用于计算斜率方向线指标的价格 TF = 15; - 斜率方向线指标的图表周期 止损 = 0; - 限制点数的损失水平 Order_Step = 20; - 以点为单位的网格订单之间的距离 Count_Order = 5; - 网格中的订单数量 Lock_Pips = 22; - 以点为单位打开平均订单的距离 克夫 = 2; - 乘以大量平均订单的系数 利润 = 10; - 以点为单位的利润水平 手数 = 0.1; - 起始手数 MN = 100; - 顾问订单的幻数 UseSound = True; - 启用或禁用顾
Martin Pristine
Iurii Tokman
5 (1)
Martin Pristine   Martin Pristine 是一个交易机器人,一个使用 价格通道中心 指标读数的分析作为做出交易决策的信号的顾问。不需要在图表上额外安装指标,指标内置于“EA 交易”内部。 每次亏损交易后,交易量乘以 2。 EA 自动检测货币对报价中的 5 位和 6 位数字。 一次只能在市场上持有一个头寸。 顾问设置说明: TF = 15;   - 为价格通道中心指标 选择图表周期 Bars_Count = 100;   - 价格通道中心指标 的分析柱数 止损 = 50; - 限制点数损失 止盈 = 50; - 以点数限制利润 手数 = 0.1; - 顾问订单的起始量 MN = 2808; - 顾问订单的幻数 UseSound = True; - 在顾问中启用或禁用事件的声音伴奏 市场观察 = 真; - 通过修改方法设置损益水平 滑点 = 30; - 最大允许价格滑点
Future Price
Iurii Tokman
Future Price   未来价格 - 该指标根据报价历史中的匹配搜索显示未来价格变动的预期选项。该指标以两种模式运行,第一种 - 枚举和显示指定数量的选项,第二种 - 指标显示一组选项。 设置说明 静态变量 = 0; - 设置要显示的所需选项,如果= 0,则选项的迭代有效 TOTAL_VARIANTS = 20; - 设置一组选项的数量,建议不要超过30 Time_Seconds_Show = 3; - 给定集合中一个选项的最小显示时间,最大时间受下一个报价到达时间的限制 Future_Bars = 50; - 未来显示的柱数,建议不超过60 History_Bars = 636; - 历史中分析柱的数量   未来价格 - 该指标根据报价历史中的匹配搜索显示未来价格变动的预期选项。该指标以两种模式运行,第一种 - 枚举和显示指定数量的选项,第二种 - 指标显示一组选项。
Reanimator
Iurii Tokman
Reanimator   半自动交易机器人。要打开/关闭头寸,请使用按钮。根据虚拟利润水平自动进行头寸的进一步跟踪。还使用了一种用减少/增加的手数来平均无利可图的头寸的系统。策略测试器中顾问的按钮控制不起作用;顾问只能在演示或真实账户上进行全面测试。在策略测试器中,可以使用特殊设置 OPEN_BUY 和 OPEN_SELL 来测试顾问程序。 设置 colorBUY - 购买方向的线条颜色 colorSELL - 销售方向的线条颜色 _width - 线宽 MagicNumber - 顾问订单的标识符。机器人只会处理只有这样一个数字的订单。 LOT - 固定手数。在 0 MM 工作(资金管理) Choice_method - MM 方法。 true - AccountBalance, false - AccountFreeMargin 风险 - MM 的利率风险。仅适用于 LOT = 0 drawdown_pip - 以增加/减少手数开仓的点数距离 koef_martingale - 许多平均位置的乘法因子 利润点 - 以点为单位的虚拟利润水平,相对于起始手数计算 Show_Sco
FletBoxPush
Iurii Tokman
FletBoxPush   该指标根据指定的参数确定价格变动的平坦区域。 设置: TimeFrames - 图表周期的选择。 FlatPips - 确定平面的点数限制 FlatBars - 用于确定平面的柱线数量限制 CountBars - 用于分析价格变动的历史柱数,在 0 时分析历史中的所有柱 颜色 - 定义为平面的价格段的颜色 PriceTag - 价格标签的附加绘图 警报 - 显示包含用户数据的对话框 文本 - 警报的自定义文本 Send_Mail - 向“邮件”选项卡上的设置窗口中指定的地址发送电子邮件 主题 - 电子邮件标题 Send_Notification - 向移动终端发送通知,其 MetaQuotes ID 在“通知”选项卡的设置窗口中指定。 该指标根据指定的参数确定价格变动的平坦区域。
Bar Boss
Iurii Tokman
5 (1)
Bar Boss   Expert   Advisor 使用 FletBoxPush 指标来分析市场并确定交易信号。该指标内置于“EA 交易”中,不需要在图表上额外安装。交易发生在定义为平台边界的水平上。使用损失限制。 顾问设置说明 TimeFrames - 图表周期,指标设置 颜色 - 定义为平面的价格区域的颜色,为指标设置 矩形 - 显示定义为平坦的价格区域,为指标设置 手数 - 起始交易量 MagicNumber - 订单的幻数 Count_LOSS - 连续亏损交易的数量,之后将设置为零利润(退出为零) FlatPips - 以点为单位确定平台,设置指标 FlatBars - 用于确定平面的柱数限制,为指标设置 MinBarsClosedOutside - 收盘价固定在特定平面水平之上/之下的柱数 CoefficientLot - 亏损后后续交易手数的乘数 CoefficientTakeProfit - 根据确定的平台的通道宽度计算的利润乘数 PercentLoss - 损失百分比,如果顾问带来的总损失低于此值,交易停止,该值必须设置为负数,例如:-33.3 顾问如何工
BarKhan
Iurii Tokman
BarKhan   BarKhan - 该指标计算为三个数字移动平均线的差值之和。计算公式如下:数字移动平均线#1和#2的差值与数字移动平均线#2和#3的差值相加 指标设置说明: MA_Period1 - 第一个数字移动平均线的周期 MA_Period2 - 第二个数字移动平均线的周期 MA_Period3 - 第三个数字移动平均线的周期   BarKhan - 该指标计算为三个数字移动平均线的差值之和。计算公式如下:数字移动平均线#1和#2的差值与数字移动平均线#2和#3的差值相加 指标设置说明: MA_Period1 - 第一个数字移动平均线的周期 MA_Period2 - 第二个数字移动平均线的周期 MA_Period3 - 第三个数字移动平均线的周期
Strong Weak
Iurii Tokman
Strong Weak   多货币指标同时分析 56 个货币对: AUD EUR GBP NZD CAD CHF JPY USD AUD SUMM EURAUD GBPAUD AUDNZD AUDCAD AUDCHF AUDJPY AUDUSD EUR EURAUD SUMM EURGBP EURNZD EURCAD EURCHF EURJPY EURUSD GBP GBPAUD EURGBP SUMM GBPNZD GBPCAD GBPCHF GBPJPY GBPUSD NZD AUDNZD EURNZD GBPNZD SUMM NZDCAD NZDCHF NZDJPY NZDUSD CAD AUDCAD EURCAD GBPCAD NZDCAD SUMM CADCHF CADJPY USDCAD CHF AUDCHF EURCHF GBPCHF NZDCHF CADCHF SUMM CHFJPY USDCHF JPY AUDJPY EURJPY GBPJPY NZDJPY CADJPY CHFJPY SUMM USDJPY USD AUDUSD EURUSD GBPUSD
Firm
Iurii Tokman
Firm   EA 不使用指标,它一直在市场中。顾问的逻辑基于对市场上已打开订单的分析。 顾问设置说明: StopLoss_Percent - 损失水平,百分比 TakeProfit - 利润水平,以点为单位 风险 - 自动确定 EA 订单量的设置,适用于 LOT = 0 LOT - 固定数量的订单 Slippage - 最大允许的价格滑点 MagicNumber - 顾问订单的幻数 Show_Information - 启用或禁用信息板 color_background - 背景颜色 color_text - 文本颜色 color_negative - 负值的颜色 color_positive - 正值的颜色 EA 不使用指标,它一直在市场中。顾问的逻辑基于对市场上已打开订单的分析。
Grid Flat
Iurii Tokman
Grid Flat   EA 以指定的步骤放置一个订单网格。对于所有相同类型的订单,订单具有网格步距的利润水平和一般亏损水平。交易仅在设置中指定的时间段内进行,在时间结束时删除所有挂单并强制关闭所有未平仓头寸。不建议将 EA 用作长期交易的全自动交易系统,仅用于在某些市场情况下工作,例如发布重要新闻或其他类似市场情况。 顾问设置说明 Open_BuyStop - 打开/不打开待处理的 Buy Stop 订单网格 Open_SellStop - 打开/不打开挂单的卖出止损订单网格 Open_BuyLimit - 打开/不打开待定买入限价订单网格 Open_SellLimit - 打开/不打开挂单的卖出限价订单网格 TIME_HOUR_START - 顾问开始工作的小时数,值从 0 到 23 TIME_MINUTE_START - 顾问开始工作的分钟数,值从 0 到 59 TIME_HOUR_STOP - EA 交易结束的小时数,值从 0 到 23 TIME_MINUTE_STOP - 顾问结束的分钟数,值从 0 到 59 Grid_levels - 网格中的级别数 Step_Grid
Break Even LeveL   该指标在市场上有未平仓订单时起作用并计算价格水平,达到该水平后,所有未平仓订单的总利润将为零,即无亏损水平。该计算考虑了运行指标的货币对的订单。订单可以通过幻数过滤。 指标设置说明: Line_Create - 无损失地显示一条线 color_Line - 线条颜色 style_Line - 线条样式 width_Line - 线宽 Text_Create - 在线条上方和线条下方显示文本 font_Text - 文本的字体 font_size_Text - 文本字母的高度 color_Text - 文本颜色 color_Text_Profit_Zone - 盈利区域的文本颜色 Label_Create - 显示文本标签 坐标_x - 文本标签的 x 坐标,以像素为单位 坐标_y - 文本标签的 y 坐标,以像素为单位 corner_Label - 图表的角以锚定文本标签 font_Label - 文本标签的字体 font_size_Label - 文本标签的字体高度 color_Label - 文本标签的字体颜色 anchor_Label - 一
筛选:
sunnychow
8902
sunnychow 2018.11.12 15:35 
 

用户没有留下任何评级信息

Aleksandr Tamonin
4109
Aleksandr Tamonin 2017.12.04 14:56 
 

用户没有留下任何评级信息

xarax
314
xarax 2017.10.13 13:23 
 

用户没有留下任何评级信息

Aleksei Bulanov
548
Aleksei Bulanov 2017.02.21 15:40 
 

用户没有留下任何评级信息

Sergei Kravchenko
922
Sergei Kravchenko 2017.01.21 08:55 
 

用户没有留下任何评级信息

回复评论
版本 2.0 2020.03.26
обновление