Returns MT4
- 指标
- Fabrizio Malavasi
- 版本: 1.3
- 更新: 3 三月 2021
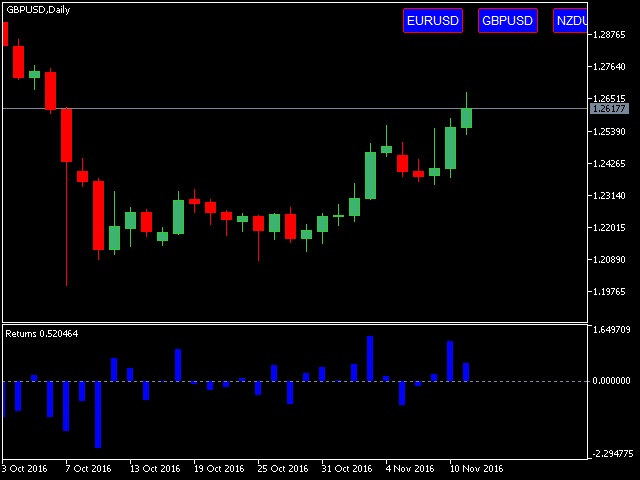
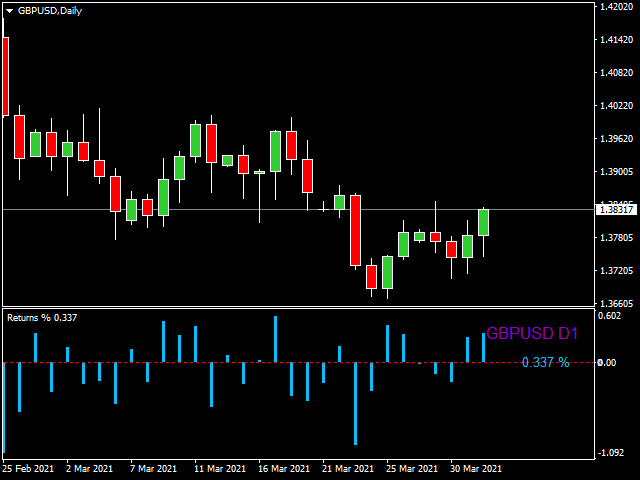
This indicator shows the value of returns in the selected time frame.
They are calculated as logarithm of returns, rather than price or raw returns. For small returns, arithmetic and logarithmic returns will be similar. The benefit of using returns, versus prices, is normalization.
It is possible measures all variables in a comparable metric despite originating from price series of unequal values.
Inputs
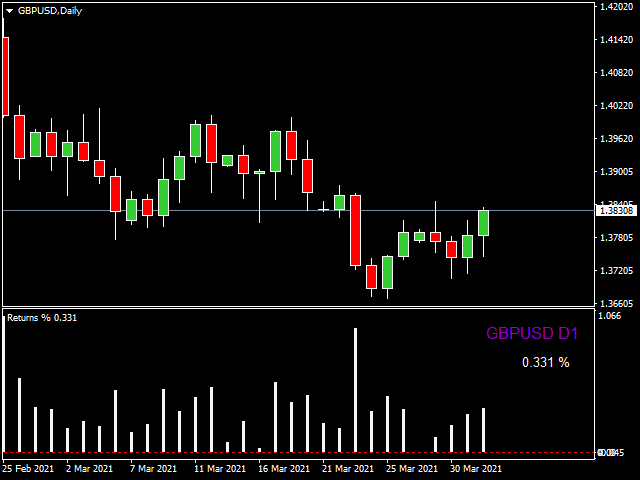
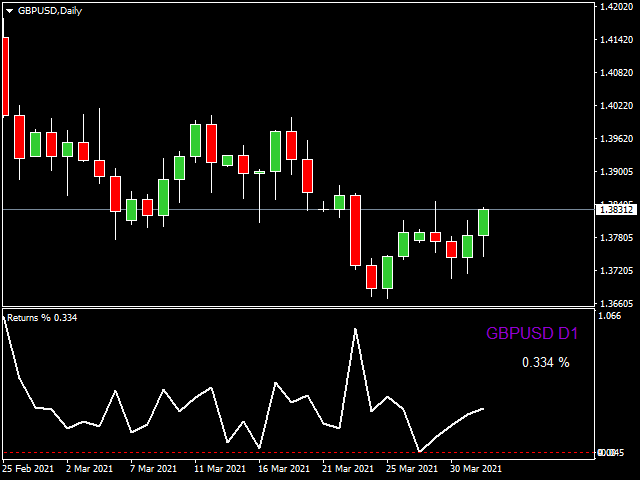
- You can display data both as a Histogram or a Line
- It's also possible to display the absolute value of returns

Indicator need's work...