FiboPlus MT5
- 指标
- Sergey Malysh
- 版本: 2.1
- 更新: 27 六月 2017
- 激活: 5
自动生成并跟踪斐波那契线,适用于图表内任何时期买入或卖出任意工具(代码)。
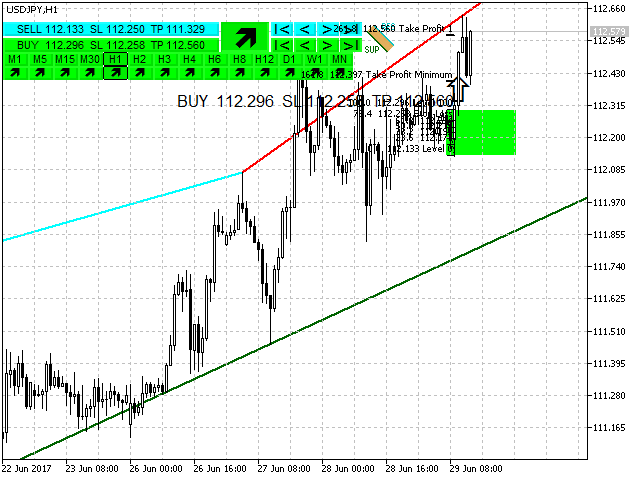
FiboPlus指标显示:
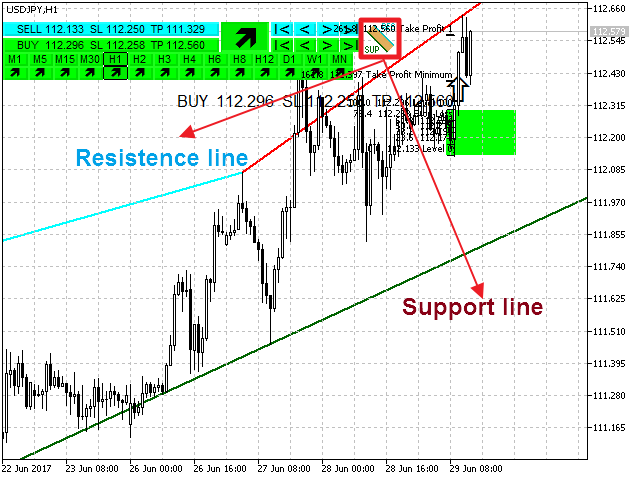
- 价格上升或下降预期趋势斐波那契水平;
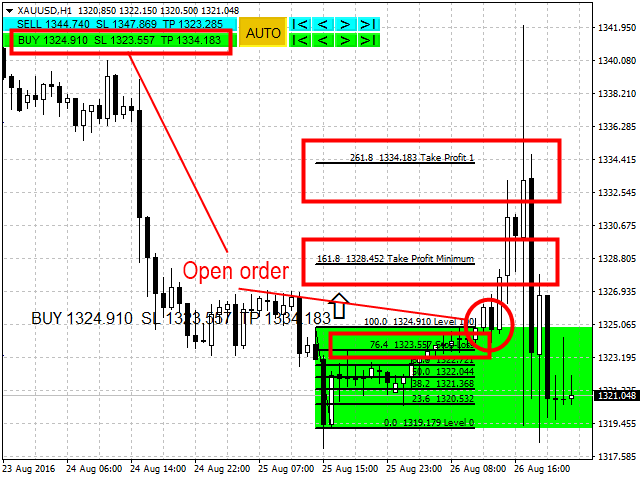
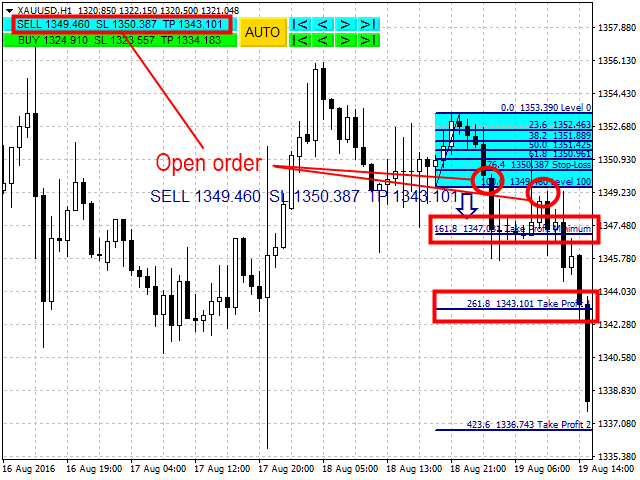
- 进场点见“上箭头”、“下箭头”符号,信息在 SELL, BUY 按钮内重复显示;
- 以0至100为界的矩形区域。一水平至另一水平交易(无趋势).
特点
- 价格走势预测、进场点、下单用 stop loss 和 take profit.
- 现成的交易系统.
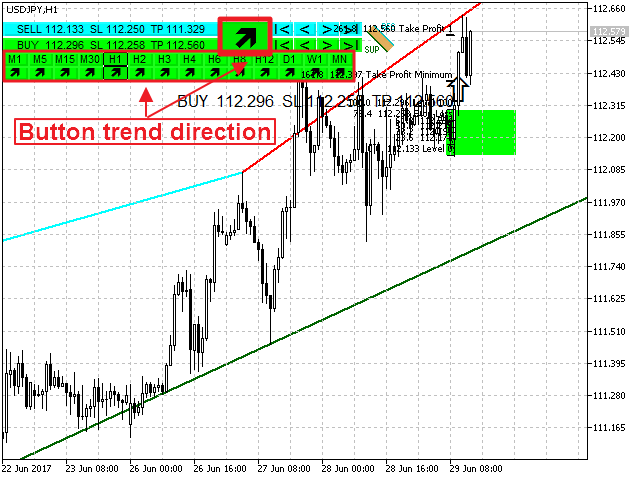
- 可使用管理按钮选择斐波那契选项.
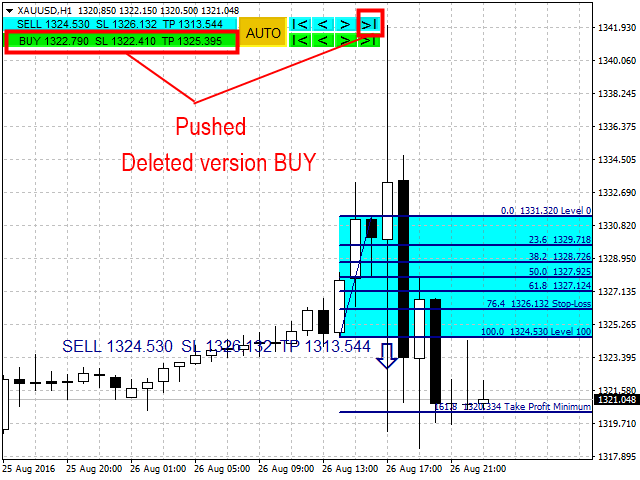
- 隐藏买入或卖出选项.
- 查看图表其它时期.
- «+» «-» 按键放大、缩小图表,并自动重新计算各水平.
- 任意斐波那契水平.
- 任意颜色方案.
- 可在图表上移动按键以方便使用.
参数
- Language (Russian, English, Deutsch, Espanol, Portugues)
- 添加斐波那契水平:
- Best - 沿一色蜡烛线至第一个互补色蜡烛线;
- Standard - 标准构图;
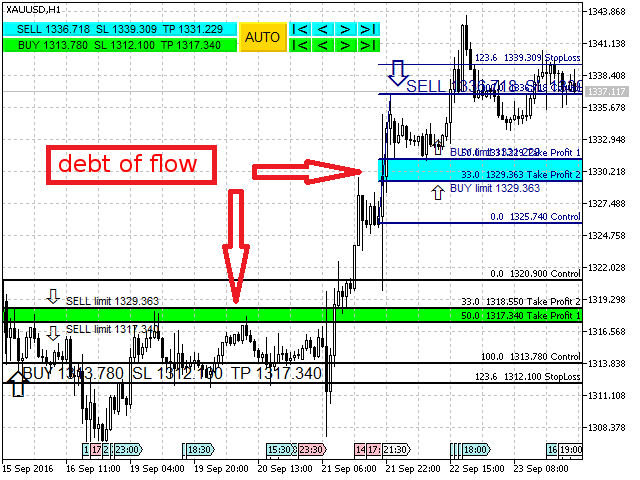
- debt of flow - 市场大变动时做市商的流动负债.
- 配色方案(预设颜色):
- White background - 白色背景.
- Black background - 黑色背景.
- Custom background - 全部颜色自定义设置.
- FIBO Custom (水平值见«,»后)
- customcolors:自定义颜色设置;
- coordinatesX, Y buttons to snap pixels (向图表中添加按钮所需的X、Y坐标)
按钮
- SELL. 进场卖出选项。
- |< 第一进场卖出选项.
- < 前一进场卖出选项.
- > 下一进场卖出选项.
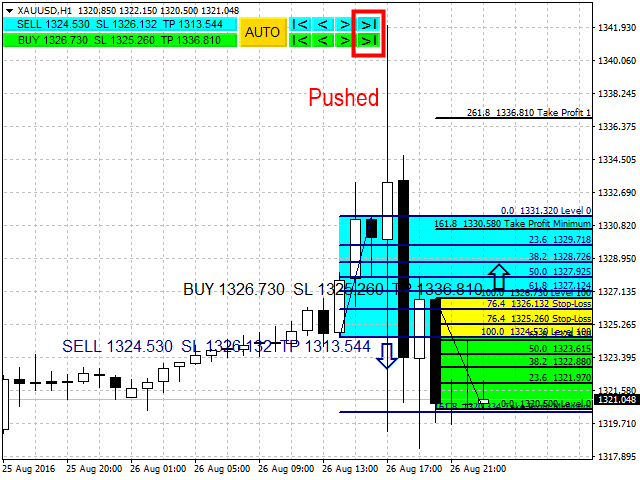
- >| 最后进场卖出选项 + 自动跟踪.
- BUY. 进场买入选项。
- |< 第一进场买入选项.
- < 前一进场买入选项.
- > 下一进场买入选项.
- >|最后进场买入选项 + 自动跟踪.
AUTO. 自动计算并跟踪市场买入和卖出斐波那契水平
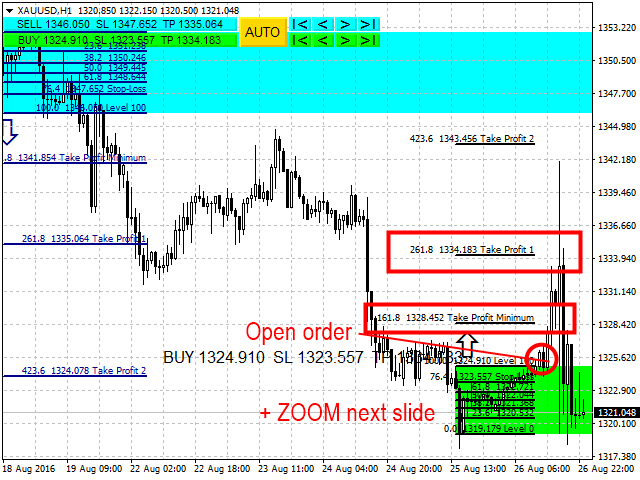
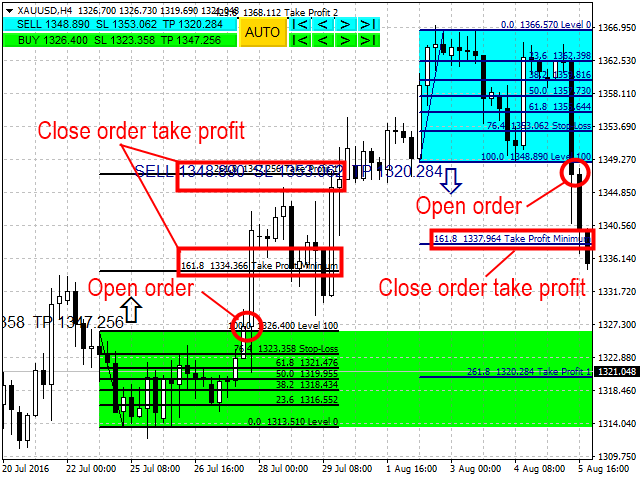
基于FiboPlus指标的交易系统
- 卖出. 蜡烛线收于100以下, stop loss 高于76.4, take profit minimum 161.8, take profit 1 - 261.8, take profit 2 - 423.6.
- 买入. 蜡烛线收于100以上, stop loss 低于76.4, take profit minimum 161.8, take profit 1 - 261.8, take profit 2 - 423.6.
- 以0至100为界的矩形区域内买入/卖出。一水平至另一水平交易(无趋势).
- "debt of flow" 选项. FiboPlus构建做市商"debt of flow"水平,价格极可能回调至该水平。100至 间的交易。第二工作选项,根据趋势设定50%和33%的限价单.
建议于当前工具图表上添加指标前更新数据(依次点击 M1, M5, M15, M30, H1, H2, H3, H4, H6, H8, H12, D1, W1, MN 期间).