
很遗憾,"Eurjpy"不可用
您可以检查Kourosh Hossein Davallou的其他产品:

A stochastic oscillator is a momentum indicator comparing a particular closing price of a security to a range of its prices over a certain period of time. The sensitivity of the oscillator to market movements is reducible by adjusting that time period or by taking a moving average of the result. It is used to generate overbought and oversold trading signals, utilizing a 0-100 bounded range of values. This indicator show 15 stochastic on one chart.
FREE

价格预警指标在价格到达交易者设置的确定级别时播放声音提示。 如果您使用邮件提示功能,不要忘了在您的 MetaTrader 平台的选项窗口中进行邮件设置。 输入参数: WhenPriceGoesAbovePIP - 如果价格超出当前指定的一个点数,提示将被触发。 WhenPriceGoesBelowPIP - 如果价格低于当前指定的一个点数,提示将被触发。 WhenPriceIsExactlyPIP - 如果价格等于当前指定的,提示将被触发。 SendEmail - 若为 true, 邮件发送到您在 MetaTrader 4 上设置的邮件地址。邮件 SMTP 服务器也应该在您的 MetaTrader 4 上配置。 clearAlert- If true Clear Alert. SoundAlert -If true Sound Alert.
FREE

This is an indicator that allows displaying three currency pairs in one window. Input Parameters: Symbol1 - first currency pair. symbol1mirrior - mirror display of the first currency pair. s1color - color of the first currency pair. Symbol2 - second currency pair. symbol2mirrior - mirror display of the second currency pair. Symbol3 - third currency pair. symbol3mirrior - mirror display of the third currency pair. Symbo4 - fourth currency pair. symbol4mirrior - mirror display of the fourth cur

This particular methodology. Please note the odd sequence in counting, as you will see, it is necessary for the inductive analysis. By starting with a top we are assured of beginning our count on a new wave. (The reverse would apply for a bearish wave.) The 2 point is a top. The 3 point is the bottom of the first decline. The 1 point is the bottom prior to point 2 (top), that 3 has surpassed. The 4 point is the top of the rally after point 3. The 5 point is the bottom after point 4 and is likely

Our strategy relies on a choppy movement on most Forex pairs during the Asian session. Most traders in London sleep when the Sun shines over the Pacific and this results to a very slow movement of GBPUSD pair between 9:00 PM GMT and 7:00 AM GMT. Buy order: Place a buy-stop order just five pip above the upper band. Place a stop loss just one pip below the lower band. Place a profit target at the upper LawnGreen Arrow. Sell order: Place a sell-stop order just five pip below the lower band. Place
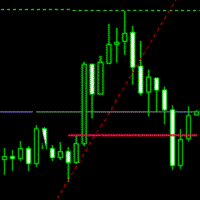
Breakout System This indicator is based on the trend line and breakthrough. Pair: EURUSD, GBPUSD. Timeframe: M15 Or H1. Input Parameters AlertsOn - alert on or off. TrendLine - show trend line. TrendLineStyle - style of trend line. UpTrendColor - color of up trend. DownTrendColor - color of down trend. ShowTakeprofit - show take profits. ShowTakeprofitStyle - style of take profit. UpperTakeprofitColor - color of up take profit. LowerTakeprofitColor - color of down take profit.

This indicator is based on the Channel . Input Parameters channel_One - show trend line One on or off. timeFrame_One - time Frame of channel One . ColorChannel_One - color of trend line One. channel_Two - show trend line Two on or off. timeFrame_Two - time Frame of channel Two . ColorChannel_Two - color of trend line Two. channel_Three - show trend line Three on or off. timeFrame_Three - time Frame of channel Three . ColorChannel_Three - color of trend line three. channel_Four - show tr
FREE

Weekly Pivot There are a lot of advantages when trading with support and resistance lines, and they should be a staple in every trader's arsenal. Another effective method of deriving multiple horizontal based support and resistance lines is using a formula derived from yesterday's High, Low and Close bar. The formula maps out pivot point levels consisting of the pivot, and three levels of support and resistance, and these levels can be traded much the same way as trading with the regular suppo

The indicator is based on several useful indicators in the multi time frames that help us chart and table and alert. This demo version and fix parameters. The full version can be downloaded at following address. https://www.mql5.com/en/market/product/34745 The various parameters used in this indicator and the default ones are as follows. · Moving Average Mode: LMMA · Moving Average Period One: 4 · Moving Average Period Two: 8 · Moving Average
FREE

The indicator is based on several useful indicators in the multi time frames that help us chart and table and alert.
The various parameters used in this indicator and the default ones are as follows. · Moving Average Mode: LMMA · Moving Average Period One: 4 · Moving Average Period Two: 8 · Moving Average Period Three: 15 · Moving Average Period Four: 30 · Moving Average Period Five: 80 · Mo
Only NonFarm Payroll Trade The employment situation is a set of labor market indicators. The unemployment rate measures the number of unemployed as a percentage of the labor force. Non-farm payroll employment counts the number of paid employees working part-time or full-time in the nation's business and government establishments. The average workweek reflects the number of hours worked in the non-farm sector. Average hourly earnings reveal the basic hourly rate for major industries as indicate

Daily GBPUSD trade Our strategy relies on a choppy movement on most Forex pairs during the Asian session. Most traders in London sleep when the Sun shines over the Pacific and this results to a very slow movement of GBPUSD pair between 9:00 PM GMT and 7:00 AM GMT.
Input Parameters: Auto GMT shift extern int Broker_GMT_Shift = 0;//Manual Broker GMT shift extern int London_Night = 21; //London Night extern int London_Open = 7; //London Open

This Indicator works based on several well-known Technical Indicators in different time frame Works. These Technical Indicators include: Moving Averages (MA) Average Directional Index (ADX) Parabolic Stop and Reverse (SAR) Moving Average Convergence Divergence (MACD) Commodity Channel Index (CCI) Oscillator of a Moving Average (OsMA ) Momentum(MOM) Relative Strength Index (RSI) Williams' Percent Range (WPR)

This Indicator works based on several well-known Technical Indicators in different time frame Works. These Technical Indicators include: · Moving Averages(MA) · Average Directional Index (ADX) · Parabolic Stop and Reverse (SAR) · Moving Average Convergence Divergence (MACD) · Commodity Channel Index (CCI) · Oscillator of a Moving Average (OsMA) · Momentum(MOM) · Relative Strength Index (RSI) · Williams' Percent Rang
FREE

Currency Meter When trading Forex, we trade a pair of currencies at time. For example EUR/USD. If we are long on the EUR/USD it means that we expect the EUR to gain in strength relative to the USD. If we are short on the EUR/USD it means that we expect the EUR to weaken relative to the USD. You should be all familiar with this concept. The key thing about pairs though is that they just indicate the strength of one currency relative to another. If we see the EUR/USD going up, is it because th

The Price Channel pattern trading strategy is one of the smartest ways to make money trading. The Price Channel pattern represents two trend lines positioned above (channel resistance) and below (channel support) the price. The price action is contained between these two parallel trendlines. The separation between the two trendlines needs to be wide enough if you want to trade inside the Price Channel Pattern. If this is the case, you can buy at the channel support level and sell at the channe

ANDREW’S PITCHFORK TRADING STRATEGY Essentially, Andrew’s Pitchfork is a tool for drawing price channels. While two lines surrounding price are usually enough to draw a channel, the Pitchfork has an extra line. It is the median line or the handle of the Pitchfork. The median line is central to this trading method. This is why Andrew’s Pitchfork is also known as the Median Line Method. TRADING RULES There are many ways to trade using Andrew’s Pitchfork but the basic idea is that pr
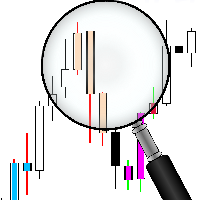
Price Action translates as "price movement." Proponents of technical analysis believe that the price takes into account everything that happens on the market. Therefore, indicators and advisers are not needed, since they are calculated based on historical price data and can be very late. By the time the indicator signal triggers, the price direction may already have changed. Those indicators that are trying to predict the price direction are often redrawn. All this leads to unnecessary losse
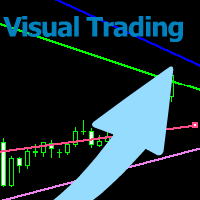
With this tool you can easily draw lines on the chart and the trade is done easily. The steps are as follows: First: Draw the buy and sell lines on the chart. Second: Draw the profit and loss lines on the chart. Third: Specify the volume of the transaction you want to trade. Fourth: Activate the lines. Warning When moving lines, be careful not to make a wrong trade.
Expert easily trades you. This is a DEMO version and can only be used on EURUSD . You can check the final version below: https://
FREE
With this tool you can easily draw lines on the chart and the trade is done easily. The steps are as follows: First: Draw the buy and sell lines on the chart. Second: Draw the profit and loss lines on the chart. Third: Specify the volume of the transaction you want to trade. Fourth: Activate the lines. Warning When moving lines, be careful not to make a wrong trade.
Expert easily trades you. You can check out the ٍِDEMO version below : https://www.mql5.com/en/market/product/55493

这款 EA 允许使用鼠标打开、修改仓位和订单 (带有止损, 止盈)。 与此 EA 工作,需要为仓位设置手数大小,止盈和止损位。对于挂单,您需要设置手数大小,止盈,止损,和距离 (点)。 此 EA 仅有一个输入参数 - 背景色。

The Price Channel pattern trading strategy is one of the smartest ways to make money trading. The Price Channel pattern represents two trend lines positioned above (channel resistance) and below (channel support) the price. The price action is contained between these two parallel trendlines. The separation between the two trendlines needs to be wide enough if you want to trade inside the Price Channel Pattern. If this is the case, you can buy at the channel support level and sell at the channel
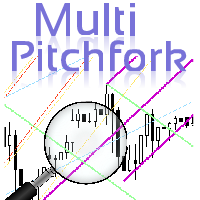
Multi Andrew PitchFork ANDREW’S PITCHFORK TRADING STRATEGY Essentially, Andrew’s Pitchfork is a tool for drawing price channels. While two lines surrounding price are usually enough to draw a channel, the Pitchfork has an extra line. It is the median line or the handle of the Pitchfork. The median line is central to this trading method. This is why Andrew’s Pitchfork is also known as the Median Line Method. TRADING RULES There are many ways to trade using Andrew’s Pitchfork but

Smart money is a powerful currency. This money is available to major investors who can identify, predict or even generate capital movements ahead of others. This money can flow into financial and capital markets and create dramatic price changes in various stocks. Therefore, detecting smart cash flow, which usually enters the market in a coherent manner and confronts the volume and value of transactions in a market with high returns, is one of the methods that some investors use to invest. But h
FREE

A stochastic oscillator is a momentum indicator comparing a particular closing price of a security to a range of its prices over a certain period of time. The sensitivity of the oscillator to market movements is reducible by adjusting that time period or by taking a moving average of the result. It is used to generate overbought and oversold trading signals, utilizing a 0-100 bounded range of values. This indicator show 8 stochastic on one chart.
FREE