• 概述
  • 评论 (3)
  • 评论 (28)
  • 新特性

CounterTrend Indicators Systems CIS

5


CIS is designed for trading a basket of correlating currencies, as well as single instruments:
  • indicators
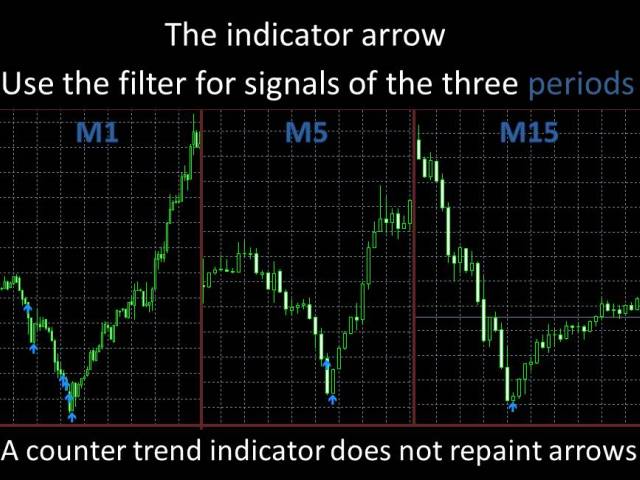
    • VSA indicator which draws arrows (does not redraw). Its signals indicate the price reversal on a calm market or decrease of the rise or fall rate during strong movements. Works fine in the flats. As the indicator uses volumes in its calculations, be careful during evenings and night times, when there are very small volumes. It is recommended to be used only on multiple currencies or at least on different timeframes.
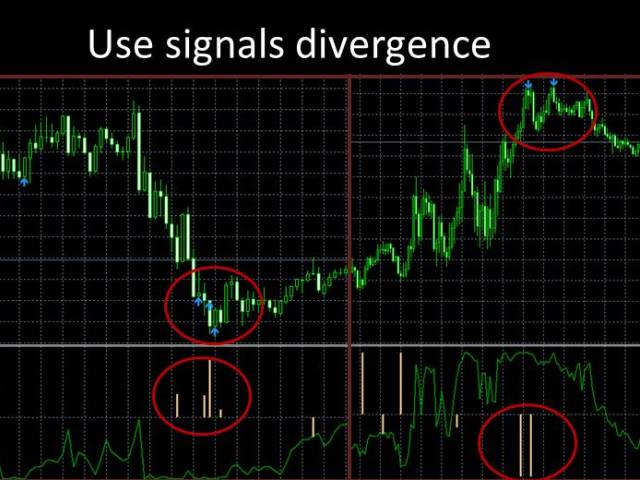
    • Divergence indicator, its signals are the rise or fall of the histogram. If the price rises and the histogram falls, it indicates a soon price reversal. Often the histogram highlights only one bar, the higher the column - the greater the divergence. Do not rush with the entries, it is necessary to wait for the right moment. The VSA indicator on M5, M1 and M15 will help with that.
    • Trend indicators: channel, Fibonacci levels, Fibonacci fan (the default period is 240 H4).
  • basket trading
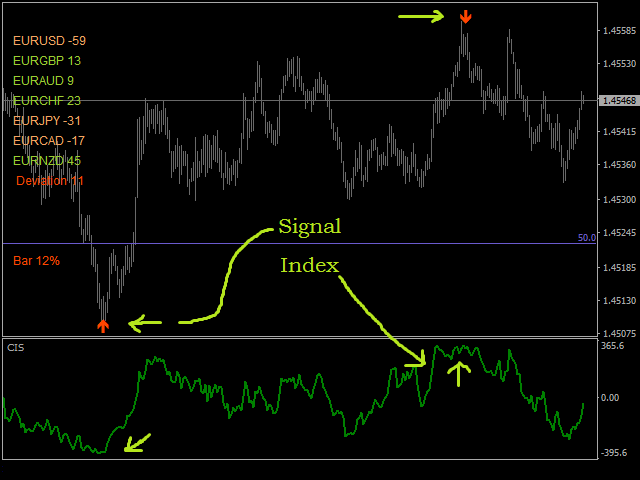
    • When the indicator is attached to the EURUSD, EURCHF, EURCAD, EURAUD, EURNZD, EURJPY, EURGBP currency pairs (this is an example, you can use any instrument), the CIS starts collecting the EUR index data and displays it in the window of each currency pair. When the EUR overbought or oversold limit is reached (this threshold can be adjusted in the settings) the indicator starts looking for the entry points for each instrument with the highest probability and marks the with arrows. It is recommended to exit the positions at the same time the opposite side of the index is reached, it also possible to close deals individually using the indicators. All values are passed to the global variables to allow automation of trading. After 5 bars the signals are canceled. The default parameters are set for trading a single instrument, as the strategy tester does not support multi-currency trading. When trading a basket, the position holding time increases, for example, signals on M1 - about 1-3 hours, on M15 - 15-30 hours, etc. It is recommended to use multiple periods. Enable the notifications so that you don't have to sit by the monitor.


Settings

    Indicator Settings

    • Period diver = 9 for «EURUSD || EURGBP» - period of the divergence indicator; for EURUSD, values 11,14,31 can also be used; each pair requires its own period
    • Period counter = 62 - period of the VSA indicator, the greater the value, the more accurate and the rarer the signals; any number can be set, but a too large value may load the CPU; for M1-M15 EURUSD the suitable periods are 61,100,300 but you can choose your own values
    • Filtering signal counter - signal filtering for more accuracy; it is recommended to disable it when using 3 charts.
    • Color - text color.

    Trendlines

    • Period trend line - period for the trend lines.
    • Show Fibo - show the Fibonacci levels.
    • Color Fibo - color of the Fibonacci levels.
    • Size Fibo - width of the Fibonacci lines.
    • Show FibFan - show the Fibonacci fan.
    • Color FibFan - color of the Fibonacci fan.
    • Size FibFan - width of the Fibonacci fan lines.
    • Show Trend - show the trend channel.
    • Color Show Trend - color of the trend channel.
    • Size Show Trend - width of the trend channel.

    Notification Settings

    • Send Notification - send messages using Push-notifications.
    • Notification Index, 0=off - notify about the EURO index line when a level is reached, 0 - disabled.
    • Send Mail - send notification to email when a signal appears.
    • Alert - sound notification.
    • Name sound - name of a sound file
    Basket settings
    • №1 - the name of the instrument with prefixes, etc
    • №2..7 - the name of the instrument
    • filter Index signal - filter signals buy index
    • Size index-signal - filter limit threshold
    • Show HISTOGRAM - display the divergence histogram
    • Color HISTOGRAM - color of the histogram


      Attention!

      • CIS performs calculations in real time and can not recalculate past bars, so it is recommended to set it on a VPS, the past graphic objects may be deleted after a terminal restart.
      • High-quality modeling of quotes is required for testing!
      • CIS can be used not only for intraday trading, but also for long-term periods, such as D1, test and check CIS on different pairs and timeframes, I hope You find it useful.

      Have a successful trading!

      评论 3
      Aravind Kolanupaka
      9170
      Aravind Kolanupaka 2019.04.12 04:34 
       

      Nice indicator!

      Werner
      342
      Werner 2016.05.27 14:01 
       

      Excellent Indicator, High Recommended. Would give 10 Stars !Very Good Support from Gennady ! Changing the Indiciator for your individual Trading Needs.

      推荐产品
      Scalping Snake Pro 是一種獨特的剝頭皮指標,可向交易者顯示價格反轉時刻且不會重繪。與 Internet 上的許多其他指標不同,該指標不會重新繪製其值。它在第一個柱上繪製信號,這樣您就不會遲到開倉交易。當信號出現時,該指標通過電話和電子郵件向交易者發送通知。您只需 147 美元即可獲得所有這些功能。 如何使用該指標進行​​交易? 打開 H1 時間框架。貨幣對 GBPUSD 或 EURUSD。我們正在等待指標將繪製藍線的第一個柱。我們開立交易買入並設置 TakeProfit +20 點。止損將是相反方向的信號,即紅線。要打開賣出交易,請等待指標繪製紅線的第一個柱。之後,我們開立交易出售。止盈 20 點。止損將是相反方向的信號,即藍線。 該指標是否正在重繪? 不,該指標不會重繪。 這個指標是遲到的信號嗎? 不,這個指標沒有滯後。它在第一個柱上顯示信號。 這個指標可以用在你的機器人上嗎? 是的你可以。該指示器使用內存緩衝區,可以將其集成到任何機器人中。 客戶通過購買該指標得到什麼? 您獲得此指標 + 您在鏈接 https://www.mql5.com/en/market/
      Binary Option Signal
      Yaroslav Varankin
      Indicator for binary options arrow is easy to use and does not require configuration works on all currency pairs, cryptocurrencies buy signal blue up arrow sell signal red down arrow tips do not trade during news and 15-30 minutes before their release, as the market is too volatile and there is a lot of noise it is worth entering trades one or two candles from the current period (recommended for 1 candle) timeframe up to m 15 recommended money management fixed lot or fixed percentage of the depo
      KT Renko Patterns MT4
      KEENBASE SOFTWARE SOLUTIONS
      2.33 (3)
      KT Renko Patterns 会逐砖扫描整个 Renko 图表,寻找那些在各种金融市场中被交易者频繁使用的著名图表形态。 与基于时间的图表相比,Renko 图由于其简洁清晰的特性,更容易识别图表形态,尤其适合基于形态的交易策略。 KT Renko Patterns 包含多种常见的 Renko 图形模式,其中许多都在 Prashant Shah 所著的《用 Renko 图表实现盈利交易》一书中有详细说明。 基于 KT Renko Patterns 指标开发的 100% 自动交易EA已发布,点击这里了解 - KT Renko Patterns EA 。 特点 可交易多达八种清晰明确的 Renko 图形模式,无任何模糊。 每种模式都配有止损位和斐波那契目标位,确保交易策略客观明确。 KT Renko Patterns 实时监测每种模式的准确率,并将关键统计信息显示在图表上。 当 Renko 砖块发生反转时会自动标记并提醒,有助于在行情突变时提前计划退出。 已识别的图形不会重绘或重新绘制,信号稳定可靠。 包含的图形模式 W-M 形态 强势旗形 AB=CD 形态 三顶/三底 双顶
      Two Candles to Glory
      Ellan Dirgantara Tholkhah
      This is a Binary Options signal indicator. Extremely powerful for the 1 min chart. The signals are based on my personal tweak (based on real trial and error & backtested) of the RSI, ADX and Ichimoku and my observation on how price moves. It turns out, 2 candles expiry is the most consistent with this set up. How to use: 1. Wait for arrow signal to show. 2. Place a 2 candle expiry right after the close of the signal candle. So if you are trading a 1 min chart, place an expiry for 2 mins... if yo
      Binary Options Assistant (BOA) ICE Signals Indicator provides signals based on gkNextLevel Binary Options Strategy.  Indicators: 2 Bollinger Bands & Stochastic Stop missing trades, stop jumping from chart to chart looking for trade set-ups and get all the signals on 1 chart! U se any of the BOA Signals Indicator with the  Binary Options Assistant (BOA) Multi Currency Dashboard .   All BOA Signal Indicator settings are adjustable to give you more strategy combinations. The signals can be seen
      FREE
      Signal From Level
      Yaroslav Varankin
      Binary Options Support Resistance Indicator This indicator is designed for binary options trading and effectively shows retracements from support and resistance levels. Signals appear on the current candle. A red arrow pointing downwards indicates a potential selling opportunity, while a blue arrow pointing upwards suggests buying opportunities. All that needs adjustment is the color of the signal arrows. It is recommended to use it on the M1-M5 timeframes as signals are frequent on these timef
      EZZ Elite Zig Zag is an indicator for the MetaTrader 4 terminal. This indicator traces the peak of the trend based on the market reversal, thus showing various opportunities in the financial market. EZZ Elite Zig Zag is a visual tool, intuitive, and easy to understand and use.  Test it Yourself by Downloading it for Free. Author Paulo Rocha all rights reserved
      This scanner uses Quarters Theory. It finds the nearest quarters to current price. And when price gets close within a few points, then it highlights and sends alerts. Features: Define Major Quarters Distance for every timeframe Option to use: Half Point between majors Quarters between half point and majors Search for nearest quarter point and price Show Highlight and send Alerts Show/Hide Quarter Lines Show/Hide Price and QP Distance Detailed post and Extras: https://www.mql5.com/en/blogs/post/
      Royal Dutch Skunk
      Sayan Vandenhout
      ROYAL DUTCH SKUNK USES THE TREND WAVE INDICATOR AND IT CAN IDENTIFY THE BEGINNING AND THE END OF A NEW WAVE TREND MOVEMENT. AS AN OSCILLATOR, THE INDICATOR IDENTIFIES THE OVERBOUGHT AND OVERSOLD ZONES. IT WORKS GREAT TO CATCH THE SHORT TERM PRICE REVERSALS AND USES A MARTINGALE STRATEGY TO CLOSE ALL TRADES IN PROFIT. USE DEFAULT SETTINGS ON H1 OR HIGHER TIME FRAME ON ANY PAIR FOR MORE ACCURATE TRADES WHY THIS EA : Smart entries calculated by 6 great strategies The EA can be run on even a $20000
      Scalping Modulator
      Andrey Kozak
      5 (1)
      Scalping Modulator is a scalping trading system. The indicator consists of several analytical modules. It automatically analyzes the market and shows the trader all the necessary information for trading. Scalping Modulator draws two trend lines on the chart. One line shows the long-term direction of the price, the second line shows the medium-term direction of the price. The indicator also draws red and blue dots on the chart. They indicate a likely change in price movement. In order to open a
      The principle of this indicator is very simple: detecting the trend with Moving Average, then monitoring the return point of graph by using the crossing of Stochastic Oscillator and finally predicting BUY and SELL signal with arrows, alerts and notifications. The parameters are fixed and automatically calculated on each time frame. Example: If you install indicator on EURUSD, timeframe M5: the indicator will detect the main trend with the Moving Average on this timeframe (for example the Moving
      Forex Gump
      Andrey Kozak
      2.4 (5)
      Forex Gump is a fully finished semi-automatic trading system. In the form of arrows, signals are displayed on the screen for opening and closing deals. All you need is to follow the instructions of the indicator. When the indicator shows a blue arrow, you need to open a buy order. When the indicator shows a red arrow, you need to open a sell order. Close orders when the indicator draws a yellow cross. In order to get the most effective result, we recommend using the timeframes H1, H4, D1. There
      AMD Exclusive
      Szymon Palczynski
      5 (1)
      AMD Exclusive characterized by high efficiency and can constitute a complete system. Indicator based on Price Action, Statistics and Overbalance. We encourage you to study indicator on its own until you know the tendencies of how it behaves relative to price movement. Indicator automatically optimizes time frame M15, M30, H1, H4, D1 and W1 (press the button [O] on the chart). Filter OVB (overbalance) has three modes: Manual [button F on chart]. Semi-automatic [button F on chart]. Automatic [butt
      EARLY REMINDER: The Starting price is 65 price will rise soon up to 365$ and then 750$ after first 10 copies of sales. Grab this offer now! Introduction Hello, traders! Welcome to the demonstration of the Forex Beast Indicator , a comprehensive tool designed to assist aspiring traders in navigating the complexities of the forex market. This indicator incorporates seven essential components to provide a well-rounded trading experience: Moving Averages Colored Zones Support and Resistance Levels
      SuperTrend Alerts
      Libertas LLC
      3 (4)
      SuperTrend Alerts adds alerts to the widely popular SuperTrend indicator. As the name suggests, SuperTrend is a trending indicator which works best in trendy (not choppy) markets. SuperTrend is extremely popular for intraday and daily trading, and can be used on any timeframe. Place a call when the price closes above the SuperTrend line, and place a put when the price closes below the SuperTrend line. These crossovers are highlighted by non-repainting up/down arrows. Alerts Email, message and s
      ZhiBiCCI MT4
      Qiuyang Zheng
      【ZhiBiCCI】指标适合所有的周期使用,也适合所有的市场品种。 【ZhiBiCCI】绿色实线是逆转看涨背离。绿色虚线是经典的看涨背离。 【ZhiBiCCI】向红色实线是反向看跌背离。红色虚线是古典看跌背离。 【ZhiBiCCI】可以在参数里面设置(Alert、Send mail、Send notification),设置为(true)就可以发送即时信号到警报窗口、电子邮件、即时消息。 参数设置说明: 【displayAlert】:这是警报开关,设置成true,如果出现箭头就会自动警报提示;设置成false,则不会警报提示。 【sendmail_NO_OFF】:这是发送邮件的开关,设置成true,如果出现箭头就会发送邮件到你在MT4设置好的邮箱里面;设置成false,则不会发邮件。 【sendnotification_NO_OFF】:这是发送即时消息的开关,设置成true,如果出现箭头就会发送消息到你的移动设备;设置成false,则不会发消息。 更多好用的指标网址: https://www.mql5.com/en/users/zhengqiuyang/seller
      TrendCompass
      Artem Koliada
      TrendCompass is a powerful indicator for trading in the currency and cryptocurrency markets on the MetaTrader 4 platform. This innovative tool is designed to simplify analysis and decision-making in trading. The indicator combines various technical indicators and algorithms to provide accurate and timely trading signals. Key Features: Multilevel Strategy: TrendCompass is based on a comprehensive strategy that includes analyzing major trends, support and resistance levels, and various technical
      MA Alignment Scanner
      Benedict Jamora
      5 (1)
      This indicator scans and displays currency pairs that have recently aligned moving averages on a given timeframe. You can configure which pairs the indicator will scan. It also includes all types of alert options. Bullish MA Alignment =  MA1>MA2>MA3>MA4>MA5 Bearish MA Alignment =  MA1<MA2<MA3<MA4<MA5 Features Attach to one chart and scans all the currency pairs configured and visible in the Market Watch Window It can monitor all the available timeframes from M1 to MN1 and sends alerts on every
      Reversal Indicator
      Augustine Kamatu
      2.5 (2)
      Have you ever wanted to be able to catch a trend just as it is beginning? This indicator attempts to find the tops and bottoms of a trend. It uses in-built indicators and studies their reversal patterns. It cannot be used on its own it requires Stochastic(14) to confirm signal. Red for sell, Blue for buy. There are no parameters required just attach to a chart and it is ready to go. Check out other great products from  https://www.mql5.com/en/users/augustinekamatu/seller   A Winning Trading Stra
      FREE
      Introducing the "Magic Trades" for MetaTrader 4 – your ultimate tool for precision trading in dynamic markets. This innovative indicator revolutionizes the way you perceive market trends by harnessing the power of advanced analysis to detect subtle changes in character, paving the way for optimal trading opportunities. The Magic Trades Indicator is designed to empower traders with insightful entry points and well-defined risk management levels. Through its sophisticated algorithm, this indicato
      斐波那契折返和扩展画线工具 适用于MT4平台的斐波那契折返和扩展画线工具,适合于使用黄金分割交易的交易者 优点:没有多余的线,没有过长的线,易于观察发现交易的机会 试用版: https://www.mql5.com/zh/market/product/35884 主要功能: 1.可以直接画出多组斐波那契折返,可以看出重要折返点之间的关系; 2.可以画出斐波那契扩展,比率有三种0.618,1,1.618 3.画出的斐波那契折返和扩展均可左右移动,有数值显示,方便观察 4.可通过数字键切换周期 使用指南和功能键: 1.按 [ 或R画折返,按需要画折返,最多云持8组折返; 2.按 ] 或E画扩展; 3.按 \ 删除当前周期下的所有扩展和折返,其余周期的不受影响 4.如何左右移动折返和扩展 (1)点击第一组折返的F5字符,可以左右移动折返; (2)点击COP的字符 ,可以左右移动扩展; 5. (1)点击第一组折返的F5字符,按del 可以删除这组折返; (2)点击COP的字符, 按del 可以删除这组扩展; 6.修改折返和扩展(随着市场的运行,焦点或者反弹点需要修改)
      Binary Fx System
      Yaroslav Varankin
      This tool was developed and designed for binary options trading It has been noticed that it can also be used in stock markets and forex. There are 2 options for trading binary options using this indicator Option 1 We open a deal on the next candle after a signal for one cut of the current period Buy or Sell depending on the signal The blue up arrow is Buy The red down arrow is Sell / We enter only on the first signal on the next candle and ignore the rest / Option 2 We enter on a signal for the
      MACD Divergence MT4
      KEENBASE SOFTWARE SOLUTIONS
      KT MACD Divergence shows the regular and hidden divergences build between the price and oscillator. If your trading strategy anticipates the trend reversal, you can include the MACD regular divergence to speculate the potential turning points. And if your trading strategy based on the trend continuation, MACD hidden divergence would be a good fit. Limitations of KT MACD Divergence Using the macd divergence as a standalone entry signal can be a risky affair. Every divergence can't be interprete
      PRO Renko System
      Oleg Rodin
      5 (26)
      PRO Renko Arrow Based System for trading renko charts.  准确的信号交易任何外汇工具. 另外,我将免费提供系统的附加模块! PRO Renko系统是RENKO图表上高度准确的交易系统。该系统是通用的。 该交易系统可应用于各种交易工具。 该系统有效地中和了所谓的市场噪音,打开了获得准确反转信号的通道。 该指标易于使用,只有一个参数负责产生信号。 您可以很容易地使算法适应您感兴趣的交易工具和renko酒吧的大小。 我很乐意通过提供任何咨询支持来帮助所有客户有效地使用该指标。 祝您交易成功!购买后,立即写信给我! 我将与您分享我的建议和我的renko发电机。 另外,我将免费提供系统的附加模块!
      Trend Oscillator mw
      DMITRII GRIDASOV
      趋势振荡器 - 是一种高级自定义 Crypto_Forex 指标,高效的交易工具! - 使用高级新计算方法 - 参数“计算价格”有 20 个选项。 - 有史以来最平滑的振荡器。 - 绿色表示上升趋势,红色表示下降趋势。 - 超卖值:低于 5,超买值:超过 95。 - 使用此指标,有很多机会升级标准策略。 - 具有 PC 和移动警报。 .................................................................................................................... // 出色的交易机器人和指标可在此处获取: https://www.mql5.com/en/users/def1380/seller 这是仅在此 MQL5 网站上提供的原创产品。
      VR Cub
      Vladimir Pastushak
      VR Cub 这是获得高质量切入点的指标。该指标的开发是为了促进数学计算并简化对仓位入场点的搜索。多年来,该指标所针对的交易策略已被证明其有效性。交易策略的简单性是其巨大的优势,即使是新手交易者也能成功进行交易。 VR Cub 计算开仓点以及获利和止损目标水平,这显着提高了效率和易用性。查看使用以下策略进行交易的屏幕截图,了解简单的交易规则。 设置、设置文件、演示版本、说明、问题解决,可以从以下位置获取 [博客] 您可以在以下位置阅读或撰写评论 [关联] 版本为 [MetaTrader 5] 计算入场点的规则 开仓 要计算入场点,您需要将 VR Cub 工具从最后一个高点拉伸到最后一个低点。 如果第一个点在时间上早于第二个点,交易者等待柱线收于中线上方。 如果第一个点在时间上晚于第二个点,交易者等待柱线收于中线下方。 根据上述条件,严格在 柱线收盘 后建仓。 换句话说,如果我们在小时图上进行交易,那么从最高点到最低点的时间距离必须超过24小时,最高点和最低点之间的点数必须大于或等于平均价格变动每天。 维持和改变市场地位 可以有多个未平仓头寸;每个头寸都可以单独修改。 VR Cub
      Trusty Super Signal
      Muhammed Emin Ugur
      Trusty Super Signal Indicator The Trusty Super Signal Indicator is a powerful technical analysis tool designed to assist traders in making informed trading decisions in the financial markets. With its advanced algorithm and user-friendly interface, this indicator provides accurate and timely signals to help identify potential trading opportunities.  Features: 1. Reliable Signal Generation: The Trusty Super Signal Indicator uses a sophisticated algorithm to generate high-quality trading signal
      PZ ABCD Retracement
      PZ TRADING SLU
      4 (5)
      该指标找到AB = CD回撤形态。 AB = CD回调模式是一种4点价格结构,其中初始价格区间被部分回调,然后与回调完成后等距移动,这是所有谐波模式的基本基础。 [ 安装指南 | 更新指南 | 故障排除 | 常见问题 | 所有产品 ] 可定制的图案尺寸 可定制的AC和BD比率 可定制的突破时间 可定制的线条,颜色和大小 它根据CD纤维水平显示SL和TP水平 视觉/声音/推送/邮件警报,用于模式和突破 AB = CD Retracements可以扩展和重新绘制很多内容。为了使事情变得更容易,该指标实施了一个转折:它在向交易发出信号之前等待正确方向的Donchian突破。最终结果是带有非常可靠的交易信号的重新粉刷指示器。输入donchian突破时段作为输入。 看涨回撤是蓝色的 空头回撤是红色的 请注意,价格模式(例如AB = CD)可以扩展,指标必须重新绘制以跟随该模式的扩展。如果图案重涂超出了参数中输入的AC / BD / AB = CD比率,则该图案将消失,因为它将不再有效。要交易这些模式,请求助于donchian突破信号。 输入参数 幅度:AB = CD模式的大小 突围
      Gvs Undefeated Trend   indicator is designed for trend and signal trading. This indicator generates trend signals.  It uses many algorithms and indicators to generate this signal. It tries to generate a signal from the points with the highest trend potential. This indicator is a complete trading product. This indicator does not need any additional indicators.  You can only trade with this indicator. The generated signals are displayed on the graphical screen.  Thanks to the alert features you ca
      PZ Divergence Trading
      PZ TRADING SLU
      5 (2)
      棘手的发现和频率稀缺是最可靠的交易方案之一。该指标使用您喜欢的振荡器自动查找并扫描常规和隐藏的发散。 [ 安装指南 | 更新指南 | 故障排除 | 常见问题 | 所有产品 ] 容易交易 发现常规和隐藏的分歧 支持许多知名的振荡器 根据突破实现交易信号 显示适当的止损和获利水平 可配置的振荡器参数 可自定义的颜色和尺寸 按条形过滤大小差异 实现绩效统计 它实现了电子邮件/声音/视觉警报 为了提供广阔的市场前景,可以使用不同的振荡器在同一张图表中多次加载该指标,而不会产生干扰。该指标支持以下振荡器: RSI CCI MACD OSMA 随机 动量 很棒的振荡器 加速器振荡器 威廉姆斯百分比范围 相对活力指数 由于差异可能会扩大很多,尤其是在外汇市场中,因此该指标产生了转折:它在等待交易突破之前等待donchian突破确认差异。最终结果是带有非常可靠的交易信号的重新粉刷指示器。 输入参数 幅度:用于寻找差异的之字形周期 振荡器-选择要加载到图表的振荡器。 突破期-交易信号的突破期,以柱为单位。 发散类型-启用或禁用发散类型:隐藏,常规或两者。 最小散度单位为条形-最小散度单位为条形
      该产品的买家也购买
      目前八折优惠! 对任何新手或专家交易者来说都是最好的解决方案! 这个仪表板软件适用于28种货币对。它基于我们的两个主要指标(高级货币强度28和高级货币冲动)。它对整个外汇市场提供了一个伟大的概述。它显示高级货币强度值,货币运动速度和28个外汇对在所有(9)时间段的信号。想象一下,当你可以使用图表上的单一指标观察整个市场,以确定趋势和或剥头皮的机会时,你的交易将得到改善 我们已经在这个指标中建立了一些功能,使你更容易识别强势和弱势货币,同时识别和确认潜在的交易。该指标以图形方式显示货币的强势或弱势是增加还是减少,以及它在所有时间段的表现。 增加的新功能是动态市场斐波那契水平,它适应当前的市场条件变化,这是一个已经在我们的高级货币强度28和高级货币冲动指标中使用的成熟的加分项。 在交易时,总是将弱势货币和强势货币配对,这个新指标将帮助你做到这一点。 用户手册:点击这里  https://www.mql5.com/en/blogs/post/708783 特点  显示每个时间段的ACS28和GAP-speed(冲动)的货币强度值。 列:颜色代码以7种颜色显示货币强度:强势
      Cycle Maestro
      Stefano Frisetti
      NOTE: CYCLEMAESTRO is distributed only on this website, there are no other distributors. Demo version is for reference only and is not supported. Full versione is perfectly functional and it is supported CYCLEMAESTRO , the first and only indicator of Cyclic Analysis, useful for giving signals of TRADING, BUY, SELL, STOP LOSS, ADDING. Created on the logic of Serghei Istrati and programmed by Stefano Frisetti ; CYCLEMAESTRO is not an indicator like the others, the challenge was to interpret only t
      Scalper Inside PRO
      Alexey Minkov
      4.76 (63)
      !SPECIAL SALE! An exclusive indicator that utilizes an innovative algorithm to swiftly and accurately determine the market trend. The indicator automatically calculates opening, closing, and profit levels, providing detailed trading statistics. With these features, you can choose the most appropriate trading instrument for the current market conditions. Additionally, you can easily integrate your own arrow indicators into Scalper Inside Pro to quickly evaluate their statistics and profitability
      Golden Trend Indicator
      Noha Mohamed Fathy Younes Badr
      5 (10)
      Golden Trend indicator  is The best indicator for predicting trend movement this indicator never lags and never repaints and never back paints    and give  arrow buy and sell    before the candle appear  and it will help you and  will make your trading decisions clearer its work on all currencies and  gold and crypto and all time frame This unique  indicator uses very secret algorithms to catch the  trends, so you can trade using this indicator and see the trend clear on charts  manual guide and
      GOLD Impulse with Alert
      Bernhard Schweigert
      4.6 (10)
      这个指标是我们2个产品 Advanced Currency IMPULSE with ALERT  +   Currency Strength Exotics 的一个超级组合。 它适用于所有时间框架,并以图形方式显示8种主要货币和一种符号的强势或弱势冲动! 该指标专门用于显示任何符号的货币强度加速,如黄金、异国货币对、商品、指数或期货。这是它的第一个指标,任何符号都可以被添加到第9行,以显示黄金、白银、石油、DAX、US30、MXN、TRY、CNH等的真实货币强度加速(冲动或速度)。 建立在新的基础算法上,它使识别和确认潜在的交易更加容易。这是因为它以图形方式显示了一种货币的强势或弱势是否正在加速,并测量了这种加速的速度--把它想象成你汽车中的速度表。当你加速时,事情显然会发生得更快,这在外汇市场上也是一样的,即如果你配对的货币正在向相反的方向加速,你就会发现一个潜在的有利可图的交易。 动态市场斐波那契28水平被用作警报触发器,将适应市场活动。如果冲动击中黄色触发线,你将收到警报。然后你就知道作为一个交易员应该做什么。货币对和方向已经给出。只需点击警报按钮,就可以切换到该货
      Enigmera
      Ivan Stefanov
      5 (7)
      ENIGMERA: 市场的核心 重要提示:MQL5.com 演示版本在策略测试器中运行,可能无法完全反映 Enigmera 的功能。请查看描述、截图和视频了解详细信息。如有任何问题,请随时联系我! 该指标的代码已完全重写。版本 3.0 增加了新功能并修复了自指标发布以来积累的错误。 简介 这个指标和交易系统是金融市场的一种独特方法。ENIGMERA 使用分形周期来精确计算支撑和阻力水平。它展示了真实的积累阶段,并提供了方向和目标。无论是在趋势中还是在修正中,这个系统都能工作。 它是如何工作的 指标的大部分功能通过图表左侧的按钮控制,使得能够快速响应不同的市场情况。 按钮 ON/OFF – 显示或隐藏整个指标。 Channel – 激活支撑通道,显示可接受的偏差范围。 Dev1 (第一偏差) – 指示价格在支撑偏差内的波动,信号表示市场正在整合或积累力量。 Dev2 (第二偏差) – 显示价格在偏差之间的波动,表示趋势形成和方向。 Dev3 (第三偏差) – 表示趋势的显著加速和高波动性。 45deg (45度) – 显示市场的节奏和相对于 45 度线的运动稳定性。 Tgt1/2
      PZ Harmonacci Patterns
      PZ TRADING SLU
      3.17 (6)
      可以说,这是您可以为MetaTrader平台找到的最完整的谐波价格形成自动识别指标。它检测19种不同的模式,像您一样认真对待斐波那契投影,显示潜在的反转区域(PRZ),并找到合适的止损和获利水平。 [ 安装指南 | 更新指南 | 故障排除 | 常见问题 | 所有产品 ] 它检测19种不同的谐波价格形态 它绘制了主要,衍生和互补的斐波那契投影(PRZ) 它评估过去的价格走势并显示每个过去的形态 该指标分析其自身的质量和性能 它显示合适的止损和获利水平 它使用突破来表明合适的交易 它在图表上绘制所有样式比率 它实现了电子邮件/声音/视觉警报 受斯科特·M·卡尼(Scott M. Carney)的书的启发,该指标旨在满足最纯粹和最熟练的交易者的需求。但是,它采取了一种使交易更容易的方式:在向交易发出信号之前,它会等待Donchian朝正确方向突破,从而使交易信号非常可靠。 斐波那契投影与向量无关 它实现了电子邮件/声音/推送警报 它绘制了ABCD投影 重要提示: 为了符合 Scott M. Carney先生 的商标申诉,某些图案名称已重命名为不言自明的替代方式, Scott M.
      TPSproTREND PrO
      Roman Podpora
      4.68 (25)
      VERSION MT5        —        ИНСТРУКЦИЯ RUS           —        INSTRUCTIONS  ENG 主要功能: 准确的输入信号,无需渲染! 如果出现信号,它仍然相关!这是与重提指标的一个重要区别,重提指标可以提供信号然后改变信号,这可能导致存款资金的损失。现在您可以以更高的概率和准确度进入市场。还有一个功能是在箭头出现后为蜡烛着色,直到达到目标(止盈)或出现反转信号。 显示止损/获利区域 为了提高搜索切入点时的视觉清晰度,创建了一个模块,该模块最初显示买入/卖出区域,在该区域中搜索进入市场的最佳点。用于处理止损水平的附加智能逻辑有助于随着时间的推移减小其大小,从而降低进入交易(移动 sl)时的初始风险。 显示较高时间范围内的最小值/最大值(MTF 模式) 添加了一项功能,可以显示较高时间间隔的最小/最大校正位置,并显示趋势变化。此外,MIN/MAX 现在有编号,显示修正内容。 风险回报率 (RR) 使用指标算法,可以检测精确的入场点,平均风险回报比超过1k2。这也伴随着视觉效果,例如,收到信号后会出现蜡烛的彩色草图。 无论价
      Dynamic Forex28 Navigator
      Bernhard Schweigert
      5 (5)
      Dynamic Forex28 Navigator - 下一代外汇交易工具。 当前 49% 折扣。 Dynamic Forex28 Navigator 是我们长期流行的指标的演变,将三种功能合二为一: 高级货币强度 28 指标 (695 条评论)+ 高级货币 IMPULSE 带警报 (520 条评论)+ CS28 组合信号(奖励)。 有关指标的详细信息 https://www.mql5.com/en/blogs/post/758844 下一代强度指标提供什么? 您喜欢的原始指标的一切,现在通过新功能和更高的精度进行了增强。 主要特点: 专有货币强度公式。  所有时间范围内的平滑和准确的强度线。 非常适合识别趋势和精确进入。 动态市场斐波那契水平(市场斐波那契)。  此指标独有的独特功能。 斐波那契应用于货币强度,而不是价格图表。 适应实时市场活动以获得准确的反转区域。 实时市场动量。  第 9 行显示市场是活跃还是被动。 对于定时交易至关重要。 全面的警报和显示。  每种货币最强的买入和卖出动量。 ​​28 对的双重动量买入和卖出。 超买/超卖警告外部范围和止损。 反转
      RelicusRoad Pro
      Relicus LLC
      4.63 (104)
      RelicusRoad 用户手册 + 培训视频 + 访问 Private Discord Group + VIP 身份 一种看待市场的新方式 RelicusRoad 是世界上最强大的外汇、期货、加密货币、股票和指数交易指标,为交易者提供保持盈利所需的所有信息和工具。我们提供技术分析和交易计划,帮助每一位交易者取得成功,从初学者到高级。它是一个关键的交易指标,可以提供足够的信息来预测未来的市场。我们相信一个完整的解决方案,而不是图表上几个没有意义的不同指标。这是一个多合一指标,显示无与伦比且非常准确的信号、箭头 + 价格行为信息。 RelicusRoad 基于强大的人工智能,提供缺失的信息和工具来教育您并使您成为交易专家,成为成功的交易者。 几乎所有技术指标都滞后,这意味着它们只能报告已经发生的事情。因此,他们只确认您过去可以看到的价格已经在哪里。我们相信领先指标可以预测未来价格,而无需重新绘制,也不要过度依赖可能改变并导致重新绘制的滞后指标。如果您根据滞后指标进行交易并建立头寸,您就知道您已经大部分时间在赌博。我们相信,在您考虑建仓之前,您需要了解市场并了解价格变动的位置和原
      Volatility Trend System - a trading system that gives signals for entries. The volatility system gives linear and point signals in the direction of the trend, as well as signals to exit it, without redrawing and delays. The trend indicator monitors the direction of the medium-term trend, shows the direction and its change. The signal indicator is based on changes in volatility and shows market entries. The indicator is equipped with several types of alerts. Can be applied to various trading ins
      Quantum Breakout Indicator PRO
      Bogdan Ion Puscasu
      4.96 (26)
      介绍     Quantum Breakout PRO   ,突破性的 MQL5 指标,正在改变您交易突破区域的方式!   Quantum Breakout PRO 由拥有超过 13 年交易经验的经验丰富的交易者团队开发,旨在通过其创新和动态的突破区域策略将您的交易之旅推向新的高度。 量子突破指标将为您提供带有 5 个利润目标区域的突破区域的信号箭头,以及基于突破框的止损建议。 它既适合新手交易者,也适合专业交易者。 量子 EA 通道:       点击这里 MT5版本:   点击这里 重要的!购买后请私信我领取安装手册。 建议: 时间范围:M15 货币对:GBPJPY、EURJPY、USDJPY、NZDUSD、XAUUSD 账户类型:ECN、Raw 或 Razor,点差极低 经纪商时间:GMT +3 经纪商:IC Markets、Pepperstone with Raw 和 Razor 的点差最低 规格: 不重漆! 最多 5 个建议利润目标区域 建议止损水平 可定制的盒子。您可以设置自己的 Box Time Start 和 Box Time End。 接触 如果您
      MTF Supply Demand Zones
      Georgios Kalomoiropoulos
      4.82 (22)
      下一代自动化供需区。适用于任何图表的创新算法。所有区域都是根据市场的价格行为动态创建的。 两种类型的警报 --> 1) 当价格触及区域时 2) 当新区域形成时 你不会再得到一个无用的指标。您将获得一个完整的交易策略和经过验证的结果。     新的功能:     价格触及供需区时发出警报     创建新的供应/需求区时发出警报     推送通知警报     以点为单位的区域宽度标签     关于 MTF 的又一个时间表。因此,现在您将能够看到高于当前 3 个时间帧,而不是高于当前 2 个时间帧     启用/禁用警报/区域/MTF 功能的按钮 您获得的优势:     消除交易中的情绪。     客观化您的交易条目。     通过高概率设置提高您的利润。     节省绘图区域的时间。     像专业人士一样交易金融市场。     任何市场的即时多时间框架分析。 你在图表上看到了什么?     蓝色和红色矩形是当前时间范围的供需区。     虚线样式线是当前上方第一个时间范围内的供需区域。     实线样式线是当前上方第二个时间范围内的
      Currency Strength Exotics
      Bernhard Schweigert
      4.87 (31)
      目前8折优惠! 对任何新手或专家交易者来说都是最好的解决方案! 这个指标是专门用来显示任何符号的货币强度,如异国货币对、商品、指数或期货。它是同类产品中的第一个,任何符号都可以添加到第9行,以显示黄金、白银、石油、DAX、US30、MXN、TRY、CNH等的真实货币强度。这是一个独特的、高质量的、负担得起的交易工具,因为我们已经纳入了一些专有的功能和一个新的公式。想象一下,你的交易将如何改善,因为你能够准确地确定新趋势或剥头皮机会的触发点? 用户手册:点击这里   https://www.mql5.com/en/blogs/post/708876 它适用于所有时间框架。你将很快能够看到TREND! 根据新的基础算法设计,它使识别和确认潜在交易变得更加容易。这是因为它以图形方式显示了8种主要货币和一种符号的强弱。 该指标显示了8种主要货币(澳元加元瑞士法郎欧元英镑日元新西兰美元)的强弱线,再加上一个符号! 该指标显示了符号的真实价值。例如:对于XAUUSD(黄金):价格以美元报价。如果黄金在上涨,你怎么能知道是黄金的强势还是美元的弱势?只有当黄金走强时,我们才会进行交易。该指
      Blahtech Supply Demand
      Blahtech Limited
      4.58 (36)
      Was: $299  Now: $149   Supply Demand uses previous price action to identify potential imbalances between buyers and sellers. The key is to identify the better odds zones, not just the untouched ones. Blahtech Supply Demand indicator delivers functionality previously unavailable on any trading platform. This 4-in-1 indicator not only highlights the higher probability zones using a multi-criteria strength engine, but also combines it with multi-timeframe trend analysis, previously confirmed swings
      Smart Set up Levels
      Mohit Dhariwal
      5 (1)
      Smart Set up leve l is a very powerful indicator based on the concept of order blocks and set up entries with proper fvg and breakouts to make a very nice level to enter like a pro trader. Very easy to use interface and friendly to enter on buy and sell signals. Works Best on M15 Time frame on Gold, Bitcoin and Fx pairs. Daily 4-5 trades on each pair  Works great on gold like a pro on M15 It is non repainting nor lagging It is very powerful indicator giving precise entries and prop acts can be c
      AT Forex Indicator MT4
      Marzena Maria Szmit
      5 (3)
      The AT Forex Indicator MT4 is a sophisticated trading tool designed to provide traders with a comprehensive analysis of multiple currency pairs. This   powerful indicator   simplifies the complex nature of the forex market, making it accessible for both novice and experienced traders. AT Forex Indicator uses   advanced algorithms   to detect trends, patterns and is an essential tool for traders aiming to enhance their forex trading performance. With its robust features, ease of use, and reliabl
      System Trend Pro
      Aleksandr Makarov
      5 (2)
      System Trend Pro - This is the best trend trading indicator!!! The indicator no repaint!!!  The indicator has   MTF   mode, which adds confidence to trading on the trend (   no repaint   ). Special offer -  https://www.mql5.com/en/users/bossik2810/news How to trade? Everything is very simple, we wait for the first signal (big arrow), then wait for the second signal (small arrow) and enter the market in the direction of the arrow. (See screens 1 and 2.) Exit on the opposite signal or take 20-3
      Royal Scalping Indicator M4
      Vahidreza Heidar Gholami
      4.17 (6)
      Royal Scalping Indicator is an advanced price adaptive indicator designed to generate high-quality trading signals. Built-in multi-timeframe and multi-currency capabilities make it even more powerful to have configurations based on different symbols and timeframes. This indicator is perfect for scalp trades as well as swing trades. Royal Scalping is not just an indicator, but a trading strategy itself. Features Price Adaptive Trend Detector Algorithm Multi-Timeframe and Multi-Currency Trend Low
      Linear Trend Predictor — 结合切入点和方向支撑线的趋势指标。按照突破高/低价通道的原理运作。该指标算法过滤市场噪音,考虑波动性和市场动态。 指示器功能  使用平滑方法,显示市场趋势和开立买入或卖出订单的切入点。  适合通过分析任何时间范围内的图表来确定短期和长期的市场走势。  输入参数可适应任何市场和时间范围,允许交易者独立定制指标。  设定的指示信号不会消失,也不会重新绘制——它是在蜡烛收盘时确定的。  几种类型的通知以箭头组合。  该指标既可以作为独立的交易系统使用,也可以作为其他交易系统的补充。  可供任何经验水平的交易者使用。 主要参数 Volatility Smoothing Level - 指标的主要参数,允许您配置指标以实现舒适的操作。 它的数字范围是 1 到 100,从而增加了您可以获得更长趋势运动的平滑度。 通过少量的数字,您可以获得短期走势并快速退出交易。 使用指标进行交易的时刻:  红线和箭头表示下降趋势和卖出开盘信号。止损应根据前一个上分形来设置。  黄线和箭头表示上升趋势和买入开盘信号。止损应根据前一个下分形来设置。
      All in One Trade
      Alexey Minkov
      4.48 (27)
      !SPECIAL SALE!  The All-in-One Trade Indicator (AOTI) determines daily targets for EURUSD, EURJPY, GBPUSD, USDCHF, EURGBP, EURCAD, EURAUD, AUDJPY, GBPAUD, GBPCAD, GBPCHF, GBPJPY, AUDUSD, and USDJPY. All other modules work with any trading instruments. The indicator includes various features, such as Double Channel trend direction, Price channel, MA Bands, Fibo levels, Climax Bar detection, and others. The AOTI indicator is based on several trading strategies, and created to simplify market analy
      TPSpro RFI Levels
      Roman Podpora
      4.85 (27)
      反转区域 / 峰值交易量 / 主要参与者的活跃区域 =       TS TPSPRO系统 俄语使用说明     /       指示     英语     /       Version MT5 该指标的每位购买者还可免费获得: 6 个月内可访问 RFI SIGNALS 服务的交易信号 - 根据 TPSproSYSTEM 算法准备的切入点。 定期更新的培训材料 - 让您沉浸在策略中并提高您的专业水平。 工作日每天 24 小时提供支持,并可以访问封闭的交易者聊天室 - 沟通、协助和市场情况分析。 作者设定的文件——自动指标设置,无需额外努力即可实现最大效果。 主要功能: 显示卖家和买家的活跃区域! 指标显示所有正确的买入和卖出第一脉冲水平/区域。当这些水平/区域被激活时,即开始寻找切入点的地方,水平会改变颜色并填充特定颜色。还会出现箭头,以便更直观地了解情况。 LOGIC AI - 激活模板时显示用于搜索入口点的区域(圆圈) 为了提高视觉清晰度,添加了使用人工智能搜索入口点的显示区域的功能。 显示更高时间范围内的级别/区域(MTF 模式) 添加了使用更高时间间隔显示级别/区域的功能
      Blahtech Market Profile
      Blahtech Limited
      4.53 (15)
      Was: $249  Now: $149   Market Profile defines a number of day types that can help the trader to determine market behaviour. A key feature is the Value Area, representing the range of price action where 70% of trading took place. Understanding the Value Area can give traders valuable insight into market direction and establish the higher odds trade. It is an excellent addition to any system you may be using. Blahtech Limited presents their Market Profile indicator for the MetaTrader community. In
      IQ Gold Gann Levels a non-repainting, precision tool designed exclusively for XAUUSD/Gold intraday trading. It uses W.D. Gann’s square root method to plot real-time support and resistance levels, helping traders spot high-probability entries with confidence and clarity. William Delbert Gann (W.D. Gann) was an exceptional market analyst, whose trading technique was based on a complex blend of mathematics, geometry, astrology, and ancient mathematics which proved to be extremely accurate. Download
      波浪同步器是波浪分析的可视化指标。结合蜡烛图运动序列并构建定向波浪,与市场一起产生同步运动。 每个波浪的开始都以信号箭头开始,还有警报。 该指标永远不会重绘或移动先前历史记录上的箭头。 信号箭头出现在蜡烛图的收盘价。 适用于任何交易工具和时间框架。 易于使用和配置,仅包含 2 个输入参数:选择与所选参数一起使用的时间框架和计算 MA 线的方法。 推荐的参数可以移动 1-2 个周期。 红色箭头方向用于购买交易资产。 蓝色箭头方向用于出售交易资产。 ----------------------------------------------------------------------------------------------
      Best Currency Strength Indicator
      Tumelo Patrick Rakotsoane
      4.5 (46)
      Advanced Currency Strength Indicator The Advanced Divergence Currency Strength Indicator. Not only it breaks down all 28 forex currency pairs and calculates the strength of individual currencies across all timeframes , but, You'll be analyzing the WHOLE forex market in 1 window (In just 1 minute) . This indicator is very powerful because it reveals the true movements of the market.  It is highly recommended to  analyze charts knowing the performance of individual currencies or the countries eco
      Quantum Entry PRO
      Aleksandr Makarov
      Special offer -  https://www.mql5.com/en/users/bossik2810/news Quantum Entry is a powerful price action trading system built on one of the most popular and widely known strategies among traders: the Breakout Strategy! This indicator produces crystal clear buy and sell signals based on breakouts of key support and resistance zones. Unlike typical breakout indicators, it uses advanced calculations to accurately confirm the breakout! When a breakout occurs, you receive instant alerts. No lag and n
      Volume by Price MT4
      Brian Collard
      4.67 (12)
      Volume Profile, Footprint and Market Profile TPO (Time Price Opportunity). Volume and TPO histogram bar and line charts. Volume Footprint charts. TPO letter and block marker collapsed and split structure charts. Static, dynamic and flexible range segmentation and compositing methods with relative and absolute visualizations. Session hours filtering and segment concatenation with Market Watch and custom user specifications. Graphical layering, positioning and styling options to suit the user's a
      IQ FX Gann Levels
      INTRAQUOTES
      5 (2)
      IQ FX Gann Levels a precision trading indicator based on W.D. Gann’s square root methods. It plots real-time, non-repainting support and resistance levels to help traders confidently spot intraday and scalping opportunities with high accuracy. William Delbert Gann (W.D. Gann) was an exceptional market analyst, whose trading technique was based on a complex blend of mathematics, geometry, astrology, and ancient mathematics which proved to be extremely accurate. Download the Metatrader 5 Version M
      Max Min Cycle
      Vitalyi Belyh
      Cyclical indicator for trading and predicting the direction of the market. Shows the cyclical behavior of the price in the form of an oscillator. Gives signals for opening deals when rebounding from the upper and lower boundaries of the oscillator. In the form of a histogram, it shows the smoothed strength of the trend. Will complement any trading strategy, from scalping to intraday. The indicator does not redraw. Suitable for use on all symbols/instruments. Suitable time frames for short-term t
      作者的更多信息
      Ensemble of models GBPUSD
      Gennady Sergienko
      5 (2)
      一款全自动交易专家,具有 21 种集成策略和 6 种基于现成集成的奖励预设。 该策略专注于在欧洲交易时段开盘前预测市场走向,大多数头寸在欧洲交易时段平仓。 信息 符号 :   GBPUSD; 时间范围:   M15       (自动的); 与其他专家结合: 是; 最低存款:   50 美元; 经纪人:     任何具有真实市场执行力的人; 缺点 坏的   期间 专家的交易表现可能会长期不佳。重要的是不要指望顾问每天都能带来盈利。 这是一项长期战略,需要在较长的时间内进行评估; (信息:每次回测后,您可以在日志部分找到每月的交易报告。该报告包括以货币和百分比显示的利润,与简单地分析权益曲线相比,一些用户发现这更方便评估结果); 平均盈利因子 利润率较高的策略通常是“无亏损”系统,例如马丁格尔策略。这类系统可以实现 30 次连续获胜,但会在一次交易中亏损,甚至会损失全部存款。另一方面,像 Emsebler 这样的策略会定期锁定亏损,这会导致权益曲线在视觉上不那么吸引人。这可能会使它们对信号提供商的吸引力降低; 单一策略内多元化的难度 尽管有许多预制预设可用,但如果 EA 进入
      该指标是一种分析工具,结合了由 Patrick Mulloy、Mark Jurik、Chris Satchwell、Alan Hull 等作者开发的 37 种不同的移动平均线变体。它提供了历史虚拟测试的能力。 该指标可用于各种工具,包括黄金、加密货币、股票指数、货币对和其他资产。 集成的可视化回测器允许用户模拟虚拟交易头寸、跟踪结果并直观地评估每个移动平均线变化的有效性。这有助于交易者快速识别市场状况。 该工具还包括“最大可能利润”功能(理想退出点),说明在最有利可图的点关闭每个头寸时的假设交易结果。 此外,还提供虚拟止损功能,可在视觉测试期间进行风险管理和控制潜在损失。这有助于交易者在现实条件下评估他们的策略。 此工具对于旨在优化交易策略的经验丰富的交易者以及希望深入了解移动平均线如何影响交易绩效的初学者都很有价值。 设置说明: 显示最大利润 :在图表上显示一条曲线,表示考虑止损后的潜在最大利润。 显示最小利润 :在图表上显示一条代表最小利润情景的曲线,模拟持有头寸直到趋势逆转。 最大利润的虚拟止损点数 :定义虚拟止损点数的大小。 分析中的条形图数量 :指定分析中包含多少条形图。例如
      FREE
      Trader Station MT4
      Gennady Sergienko
      5 (1)
      Trader Station: A wave expert using bitwise analysis of an array of price data, confirmed performance by a real account since 2019; SIGNAL   -  https://www.mql5.com/en/signals/1667614 Back Testing the Expert: By default, the settings that are included in the SET 1; Only for EURUSD M5 ; Settings LOT - set the required lot size or select AUTO RISK; RISK AUTO - quick risk selection or select manual risk entry; custom value RISK - entering a custom risk value; Expert ID - enter the Expert ID or
      Nesco MT4
      Gennady Sergienko
      4.58 (12)
      大家好,我是 NESCO   / - 我是一名全自动机器人专家,独立分析市场并做出交易决策。我的一些函数是使用 GPT-4_COPILOT 编写的,并由 MQL5_CLOUD_NETWORK 优化。我有自己的服务器来获取世界各地的金融事件。我可以 24/5 为您工作,无需您干预,如果需要您的关注,我会通过电话消息通知您; 我的主要特点是数据流分析的方法论,它使我能够同时交易数十种策略。 但到目前为止,已有 6 种策略: PILOT_R   : 交易时间1:30-18:30; 符号:EURUSD M5; 最低存款:150 USD; STENVALLL_   : 交易时间1:30-18:30; 符号:EURUSD M5; 最低存款:100USD; NIGHT_POUND   : 交易时间1:30-5:30; 符号:GBPUSD M5; 最低存款:200USD; -默认情况下,仅启用一种 PILOT_R11 策略; - 启动您喜欢的策略或同时启动所有策略; - 要启用或禁用策略,请在 RUN 设置旁边设置 TRUE 标志; 例如: RUN_Stenval = TRUE
      Nesco
      Gennady Sergienko
      4.17 (29)
      大家好,我是 NESCO   / - 我是一名全自动机器人专家,独立分析市场并做出交易决策。我的一些函数是使用 GPT-4_COPILOT 编写的,并由 MQL5_CLOUD_NETWORK 优化。我有自己的服务器来获取世界各地的金融事件。我可以 24/5 为您工作,无需您干预,如果需要您的关注,我会通过电话消息通知您; 我的主要特点是数据流分析的方法论,它使我能够同时交易数十种策略。 但到目前为止,已有 6 种策略: PILOT_R : 交易时间1:30-18:30; 符号:EURUSD M5; 最低存款:150 USD; STENVALLL_ : 交易时间1:30-18:30; 符号:EURUSD M5; 最低存款:100USD; NIGHT_POUND : 交易时间1:30-5:30; 符号:GBPUSD M5; 最低存款:200USD; -默认情况下,仅启用一种 PILOT_R11 策略; - 启动您喜欢的策略或同时启动所有策略; - 要启用或禁用策略,请在 RUN 设置旁边设置 TRUE 标志; 例如: RUN_Stenval = TRUE; 请参阅
      Trader Station MT5
      Gennady Sergienko
      Trader Station: A wave expert using bitwise analysis of an array of price data, confirmed performance by a real account since 2019; SIGNAL -  https://www.mql5.com/en/signals/1667614 Back Testing the Expert: By default, the settings that are included in the SET 1; Only for   EURUSD M5 ; Settings LOT - set the required lot size or select AUTO RISK; RISK AUTO - quick risk selection or select manual risk entry; custom value RISK - entering a custom risk value; Expert ID - enter the Expert ID o
      筛选:
      Aravind Kolanupaka
      9170
      Aravind Kolanupaka 2019.04.12 04:34 
       

      Nice indicator!

      Werner
      342
      Werner 2016.05.27 14:01 
       

      Excellent Indicator, High Recommended. Would give 10 Stars !Very Good Support from Gennady ! Changing the Indiciator for your individual Trading Needs.

      [删除] 2016.05.20 10:14 
       

      用户没有留下任何评级信息

      回复评论
      版本 2.4 2017.09.07
      - Added the index of the "Anchor" currency pair to the array;
      - Fixed bugs with notification;
      版本 2.2 2016.06.23
      -Added global variables for experts
      -Disabling the histogram
      -Manual input of the instrument names
      版本 2.1 2016.06.01
      "CIS" version 2.1
      -Added the EURO Index line (works only in online mode). It is now easier to determine the trend reversal. For the correct operation, it is necessary to open the charts (EURUSD, EURGBP, EURAUD, EURCHF, EURJPY, EURCAD, EURNZD) (with the same timeframe, M1 for starters, in order to facilitate the understanding of its operation) and to attach the CIS to them. With the help of the global variables the indicator starts plotting the EURO index line. There should be no zero values, the indicator will show which way to go.
      -Added automatic trend channel and Fibo tools.
      -Added small indicators for "bar closure" and "Deviation of the EUR index" - the difference between the current and the previous values for determining the possible strength.
      -Fixed and added certain notifications.