DSZ Mini Charts
- 指标
- Dariusz Szewczyk
- 版本: 1.2
- 更新: 1 七月 2016
- 激活: 10
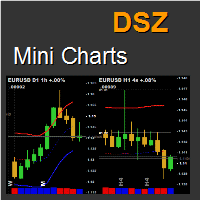
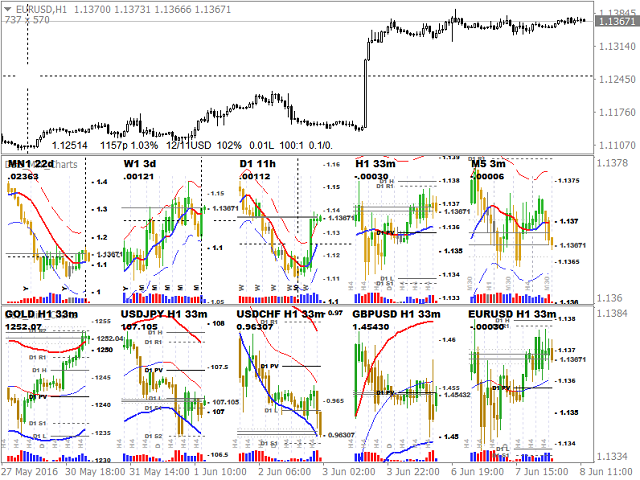
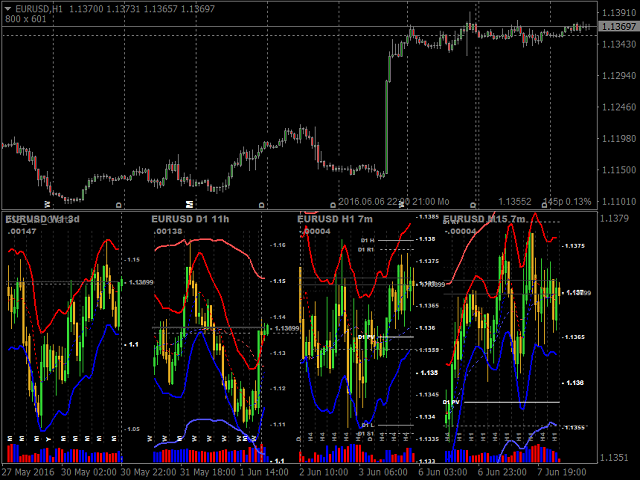
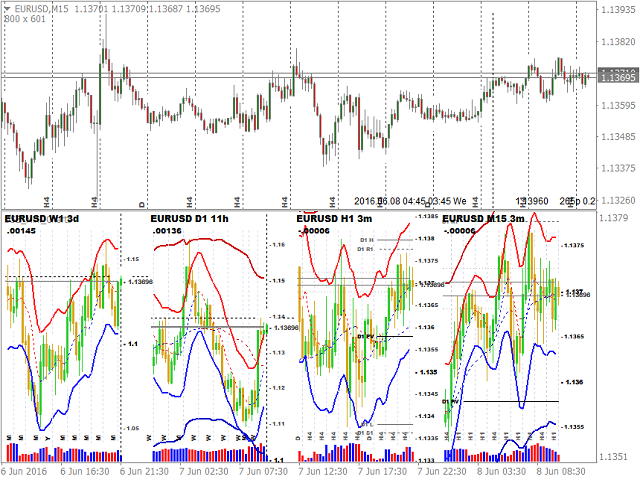
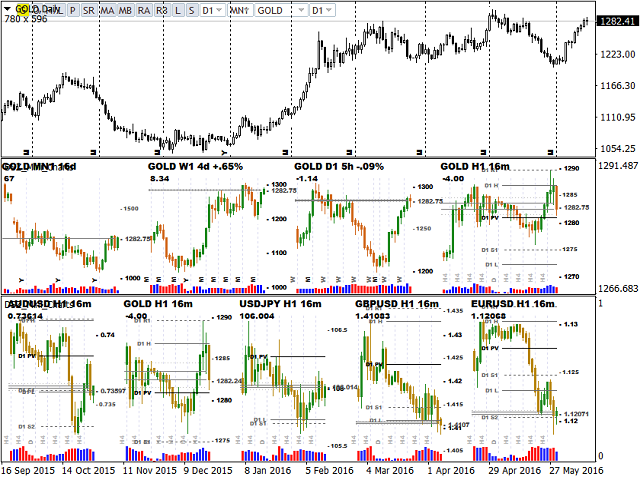
This indicator displays a bar chart for any time period and symbol. It allows to implement "top-down" investment approach.
Charts have many features including unique statistical bands, rounded numbers, pivots, the elapsed time count, information about orders, change chart by clicking, saving and loading graphic objects and many others.
Key Futures
- Up to 9 chart per row.
- Unlimited number of instances.
- Symbol and timeframe freely adjustable for every chart.
- Moving Averages that have a unique method of calculation.
- Unique statistical bands based on statistical distribution. For intraday timeframes of their ranges depend on the time of day.
- Pivot support and resistance levels.
- Rounded numbers optimized for every chart.
- Period separators and elapsed time count.
- Mouse tracking - allows for synchronization of time and money on the charts.
- Fast operation through caching.
- Volume information.
- Color schemes for the price and volume.
- Order information in simple format.
- Styles and colors.
- Main chart symbol and period changing by clicking.
- Objects Save/Load allows switching draw custom objects while main chart symbol is changed.
Inputs
- All have self-describing names.
- Parameters in Section "All Charts" overwrites values for individual charts. This setting allows for the same parameters for every chart if they have different symbols.
- Visible - enable/disable chart.
- TF - timeframe of the chart.
- Symbol - empty (means current) or exact name of any other symbol.
- MA & Bands TF 1 - timeframe of MA and Statistical Band 1 must be greater than TF.
- MA & Bands TF 2 - timeframe of MA and Statistical Band 2 must be greater than TF.
- MA & Bands Alternate period - number of bars if none of above options is set. This option is useful for example for MN TF.
During the testing, timeframe is set to M1 and a speed is less than the maximum.








用户没有留下任何评级信息