• 概述
  • 评论 (6)
  • 评论
  • 新特性

Ichimoku Advanced Free

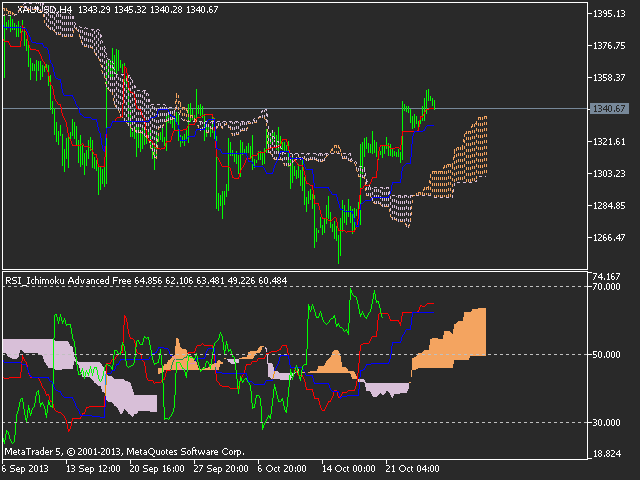
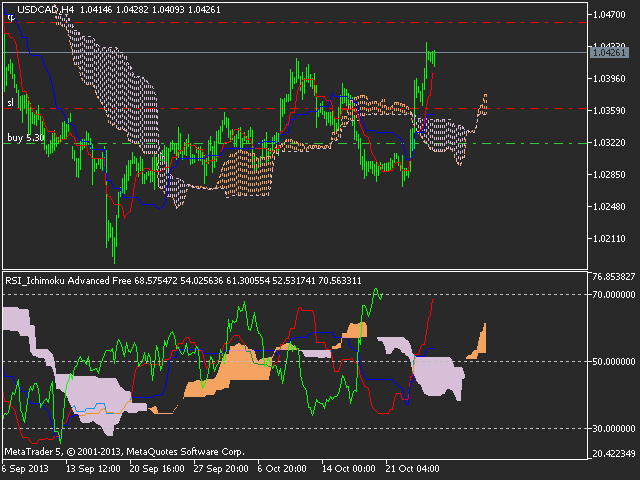
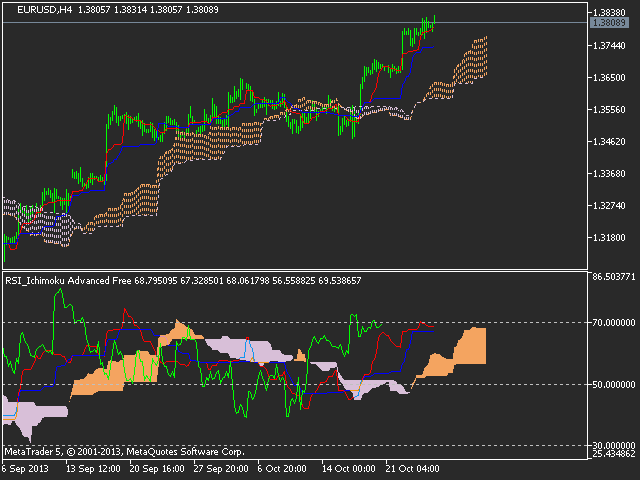
Ichimoku Kinko Hyo 的目的-建立在几乎每一个交易市场被成功应用的趋势交易系统。它在许多方面都是独一无二的,但它的主要优势是其使用多个数据点,为交易者提供一个更深入,更全面的价格走势视角。这种深入视角,事实上,Ichimoku 是一款非常优秀的可视系统,能够令交易者从那些高概率中 "一目了然" 地快速识别和过滤低概率的交易设置。

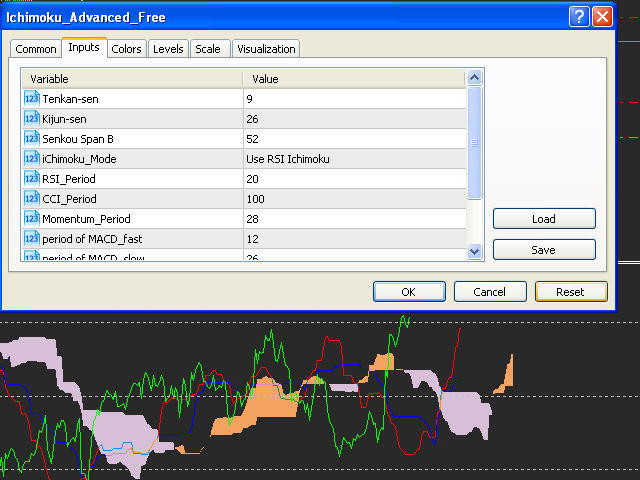
本指标基于标准的 MT5 Ichimoku Kinko Hyo 指标,但我已经将它设计为跟踪其它数值 (RSI, CCI, Momentum, TEMA, ...),且替换至子窗口。

您可以使用它作为其它策略的确认,或者如果您是一个专门的 Ichimoku 用户,您可以将它作为您的 Ichimoku 图表一个梦幻般的辅助。

这是免费版本, 您只能在子窗口里使用 RSI-Ichimoku/原始 Ichimoku。

参看 专业专业多时间帧 版本。

推荐产品
Ichimoku MTF
Hoang Ngoc Thach
MTF Ichimoku is a MetaTrader 5 indicator based on well known Ichimoku. In MetaTrader 5 we have Ichimoku already included as a standard technical indicator. However it can be used only for the current timeframe. When we are looking for a trend, it is very desirable to have Ichimokuis showing higher timeframes. MTF Ichimoku presented here has additional parameter - TimeFrame. You can use it to set up higher timeframe from which Ichimokuis will calculate its values. Other basic parameters are not c
Ichimoku Aiko MTF
Michael Jonah Randriamampionontsoa
Ichimoku Aiko MTF is a collection of technical indicators that show support and resistance levels, as well as momentum and trend direction. It is a multi-timeframe indicator so you don't need to change the chart timeframe when you want to see the ichimoku clouds on a higher timeframe.  eg. The chart timeframe is M15 and you want to see on the M15 timeframe chart the H1 ichimoku indicators (the ichimoku in Metatrader can't do that) that's why you need to use Ichimoku Aiko MTF.
Size Bars
Viktor Loginov
Size Bars – индикатор отображает на графике максимальный, минимальный, текущий и средний размер баров (свечей) за выбранный период. Отображаемые параметры индикатора Size Bars: 1)       Текущий размер бара в писах (по максимум/минимум, тело бара). 2)       Максимальный, минимальный и средний размер свечей BUY . 3)       Максимальный, минимальный, средний размер свечей SELL . 4)       Количество свечей BUY и количество свечей SELL . 5)       Среднее количество свечей подряд BUY и SELL . 6)    
GIVE A LOOK TO MY OTHER PRODUCTS ! 100 % PER MONTH PROFIT---- MY NEW SIGNAL HERE ------->   https://www.mql5.com/en/signals/2162238?source=Site+Signals+My# BROKEN TRENDLINE ALERT IS A SIMPLE TOOL INDICATOR. JUST DRAW IN YOUR CHART A DYNAMIC OR STATIC TRENDLINE,AND THE INDICATOR WILL SEND YOU ALERT WHENEVER THE PRICE CROSSES BELOW OR ABOVE YOUR DRAWN TRENDLINE. IT WORKS IN ANY TIMEFRAME AND ANY CHART YOU WANT.JUST GOT A VPS AND DON'T STRESS IN FRONT OF YOUR COMPUTER. FOR ANY KIND OF QUESTION
The indicator detects and displays М. Gartley's Butterfly pattern. The pattern is plotted by the extreme values of the ZigZag indicator (included in the resources, no need to install). After detecting the pattern, the indicator notifies of that by the pop-up window, a mobile notification and an email. The pattern and wave parameters are displayed on the screenshots. The default parameters are used for demonstration purposes only in order to increase the amount of detected patterns. Parameters
Big Player Range
Thalles Nascimento De Carvalho
5 (2)
欢迎使用"BigPlayerRange"指标,这是一款技术分析工具,旨在识别市场中金融机构关注的重要区域。该指标提供了对大型市场参与者表现出相当活跃和关注的价格范围的精确分析。 主要特点: 1. 机构兴趣区域映射: "BigPlayerRange" 准确地突出显示金融机构表现出强烈活动的图表区域。这些点具有战略重要性,提供了对可能市场走势的见解。 2. 投影作为退出参考:除了识别关注区域,该指标还使用投影作为两个不同阶段可能退出的参考。这些投影帮助投资者基于未来可能的价格方向规划策略。 3. 返回到识别范围时的回撤概率: "BigPlayerRange" 的一个独特功能是当价格返回到关注范围时计算回撤概率。这有助于评估潜在的趋势反转。 如何使用 "BigPlayerRange": - 辨识关注区域:使用该指标辨识金融机构活动较多的区域。这些点可能对于预测重大波动至关重要。 - 投影作为退出参考:在计划市场退出时,使用投影作为参考。这些投影提供在关闭仓位时可能价格方向的见解。 - 评估回撤概率:在价格返回到已识别范围时注意回撤的概率。这有助
All about time and price by ICT. This indicator provides a comprehensive view of ICT killzones, Silver Bullet times, and ICT Macros, enhancing your trading experience.  In those time windows price either seeks liquidity or imbalances and you often find the most energetic price moves and turning points. Features: Automatic Adaptation: The ICT killzones intelligently adapt to the specific chart you are using. For Forex charts, it follows the ICT Forex times: In EST timezone: Session: Asia: 20h00-0
Combined
Ahmed Alaaeldin Abdulrahman Ahmed Elherzawi
5 (1)
Welcome to Investment Castle products This product is exclusively available in the MQL5 market and is not available and will not be available anywehere else. The Combined indicator is a multi-time frame indicator and it is built using 3 indicators: Bands indicator which draws the support and resistance key levels using up to 5 different time frames Patterns indicator which draws the chart patterns using up to 6 different time frames Spots indicator which shows the common candlestick patterns Yo
Point Black
Ignacio Agustin Mene Franco
Black Card Pack indicator 5/1 point black It has the strategy of professional bollingers where each arrow gives you a different entry signal. It is used to operate in m1 and in d1 It is used for scalping and intraday, modified for forex markets ! suitable for all pairs modified for synthetic index markets suitable for all pairs! Ideal for volatility and jumps!
**   All Symbols   x   All Time frames   scan just by pressing scanner button ** *** Contact me after the purchase to send you instructions and add you in "Order Block group" for sharing or seeing experiences with other users. Introduction: The central banks and financial institutions mainly drive the market,   Order block is considered a market behavior that indicates accumulation of orders from banks and institutions, then   the market tends to make a sharp move(Imbalance) on either side once
Renko System
Marco Montemari
This indicator can be considered as a trading system. It offers a different view to see the currency pair: full timeless indicator, can be used for manual trading or for automatized trading with some expert advisor. When the price reaches a threshold a new block is created according to the set mode. The indicator beside the Renko bars, shows also 3 moving averages. Features renko mode median renko custom median renko 3 moving averages wicks datetime indicator for each block custom notificatio
Trade Helper
Pavel Gotkevitch
The Trade Helper indicator is a modification of the Trade Assistant indicator (by Andriy Moraru). The Trade Helper multitimeframe indicator is a good assistant for traders, useful as a filter in most trading strategies. This indicator combines the tactics of Elder's Triple Screen in a single chart, which lies in entering a trade when the same trend is present on three adjacent timeframes. The indicator operation is based on the principle of determining the trend on the three selected timeframes
Macd Rsi
Ignacio Agustin Mene Franco
macd rsi It is a macd indicator added to the rsi to capture perfect entries in the average crossovers! As seen in the indicator, it has 2 lines, one of gold color and the other violet line, where the cross of the violet with the gold downwards is a sell signal when it crosses the violet up from the gold it is a buy signal! very good to make shorts works for forex markets and synthetic indices It is used in any temporality! Good profit! World Investor.
Order Book, known also as Market Book, market depth, Level 2, - is a dynamically updated table with current volumes of orders to buy and to sell specific financial instument at price levels near Bid and Ask. MetaTrader 5 provides the means for receiving market book from your broker, but in real time only, without access to its history. The indicator OrderBook Cumulative Indicator accumulates market book data online and visualizes them on the chart. In addition, the indicator can show the market
该指标建立当前报价,可以与历史报价进行比较,并在此基础上进行价格走势预测。指示器有一个文本字段,用于快速导航到所需日期。 选项: 符号 - 选择指标将显示的符号; SymbolPeriod - 选择指标从中获取数据的时段; IndicatorColor - 指示器颜色; HorisontalShift - 由指标绘制的报价移动指定的柱数; Inverse - true 反转引号,false - 原始视图; ChartVerticalShiftStep - 图表垂直移动(键盘上的向上/向下箭头); 接下来是文本字段的设置,您可以在其中输入日期,您可以通过按“回车”立即跳转到该日期。 接下来是文本字段的设置,您可以在其中输入日期,您可以通过按“回车”立即跳转到该日期。
HLC bar MT5 Wyckoff
Eduardo Da Costa Custodio Santos
創建 MT5 的指標“HLC_bar_MT5 Wyckoff”是為了方便交易時的分析。 HLC Bar 由 Richard Wyckoff 使用,目前廣泛用於“VSA”操作。 Wyckoff 發現使用 High、Low 和 Close 使圖表更清晰、更易於分析。 指標“HLC_bar_MT5 Wyckoff”允許: # 改變條寬; # 保持條形相同的顏色; # 並突出顯示以相同價格開盤和收盤的柱。 顏色和寬度很容易在設置中修改 要使用該指標,只需將其拖到圖表上即可。 當與成交量一起使用時,威科夫將 HLC 圖表稱為條形圖。 他們試圖隱藏這些信息多年,但現在每個人都可以訪問這些信息,並可以使用此類圖表改進他們的操作。 HLC bar MT5 Wyckoff Chart 可用於任何市場和任何圖表時間,使操作員更加舒適。
LT Rainbow Trend
Thiago Duarte
5 (1)
Do you, like me, like to trade with the trend? Then this indicator will help you! Rainbow Trend is a trend indicator, which uses several Moving Averages on the chart. It measures different trend strenght zones for different periods: very long term, long term, mid term, short term and very short term. Each zone has its color, and it is possible to have sound alert when the prices leaves a zone and enters another. Its configuration is very simple. If you find any bug or have any suggestions, co
Gino Renko
Stephane, Andr Valette
1 (1)
Another renko-based indicator. It returns different usable values ​​for an EA, and is directly displayed on the main chart. Its setting is very simple: The size of the renko The number of bars taken into account The falling color The color on the rise Returned values: Buffer 0 : Value of the middle Buffer 1 : Value of the Top Buffer 2 : Value of the Bottom Buffer 3 : Direction of renko (0.0 for top ; 1.0 for bottom) Buffer 4 : Ratio of the renko, for example, if it is twice, 3 times, ro more of
Ichimoku Signals Pro
Shahabeddin Baset
Features All Ichimoku Signals (Selectable) : Display all reliable signals generated by the Ichimoku indicator. You can choose which signals to view based on your preferences. Filter by Signal Strength : Sort signals by their strength—whether they are weak, neutral, or strong. Live Notifications : Receive real-time notifications for Ichimoku signals. Transparent Cloud : Visualize the Ichimoku cloud in a transparent manner. Available Signals Tenkensen-Kijunsen Cross Price-Kijunsen Cross Pri
Owl Smart Levels MT5
Sergey Ermolov
4.31 (39)
MT4版本  |   FAQ Owl Smart Levels Indicator 是一個完整的交易系統,包含 Bill Williams 的高級分形、構建正確的市場波浪結構的 Valable ZigZag 以及標記準確入場水平的斐波那契水平等流行的市場分析工具 進入市場和地方獲利。 策略的详细说明 指示灯使用说明 顾问-贸易猫头鹰助手助理 私人用户聊天 ->购买后写信给我,我会将您添加到私人聊天中,您可以在那里下载所有奖金 力量在於簡單! Owl Smart Levels 交易系統非常易於使用,因此適合專業人士和剛開始研究市場並為自己選擇交易策略的人。 策略和指標中沒有隱藏的秘密公式和計算方法,所有策略指標都是公開的。 Owl Smart Levels 允許您快速查看進入交易的信號,突出顯示下訂單的水平並向您發送有關已出現信號的通知。 優點很明顯: 清楚地顯示主要和更高時間框架的趨勢方向。 指示儀器信號的出現。 標記開單、止損設置和固定利潤的水平。 沒有多餘的,只有必要的結構! ZigZag 表示全球趨勢的方向,因此也表示貿易方向。 市場反轉點的短線清楚地表明在什麼水平上構建斐波
>>> BIG SALE PROMOTION: 50% OFF + GIFT EA!  - Promo price: $64 / Regular price $129 <<< - The promotion will end soon! The Forex Trend Tracker is an advanced tool designed to enhance the trading capabilities of forex traders. This sophisticated indicator uses complex mathematical formulas alongside the Average True Range (ATR) to detect the beginnings of new upward and downward trends in the forex market. It offers visual cues and real-time alerts to give traders a competitive advantage in th
VR Grid Mt5
Vladimir Pastushak
3.6 (10)
VR 网格指示器 设计 用于创建具有用户定义设置的图形网格。与 标准网格 不同,VR 网格用于构建 圆形关卡 。根据用户的选择,轮次级别之间的步长可以是任意的。此外,与其他指标和实用程序不同,即使时间段发生变化或终端重新启动,VR Grid 也能保持网格的位置 。 设置、设置文件、演示版本、说明、问题解决,可以从以下位置获取 [博客] 您可以在以下位置阅读或撰写评论 [关联] 版本为 [MetaTrader 4] 垂直级别 基于实际时间间隔并 忽略缺失 或不存在的周期。因此,级别之间的步长严格对应于用户选择的值。 使用 VR 网格指标时,交易者 可以更改任何级别的垂直线和水平线的样式 、颜色和粗细。这使您可以控制金融工具的 回合水平 。 整数位是 以两个或多个零结尾 的价格(例如:1.23500、5.65900、1923.200)。人们相信,这样的水平 经常充当 作为支撑或阻力的强点。 Horizontal line settings Horizontal line step Horizontal line color Horizontal line style Horizon
FREE
Rainbow Collection
Minh Truong Pham
Slopes are an increasingly key concept in Technical Analysis. The most basic type is to calculate them on the prices, but also on technical indicators such as moving averages and the RSI. In technical analysis, you generally use the RSI to detect imminent reversal moves within a range. In the case of the Blue indicator, we are calculating the slope of the market price and then calculating the RSI of that slope in order to detect instances of reversal. The Blue indicator is therefore used
JAC Trend Color Candle
Eduardo Da Costa Custodio Santos
The indicator "JAC Trend Color Candle" for Meta Trader 5, was created to visually facilitate the trend for the trader. It is based on three parameters, which identifies the uptrend, downtrend and non-trending market. The colors are trader-configurable, and the average trader-configurable as well. trend parameters cannot be configured as they are the indicator's differential.
Deep Moving Average
Marat Sultanov
5 (1)
Every indicator has its advantages and disadvantages. Trending ones show good signals during a trend, but lag during a flat. Flat ones thrive in the flat, but die off as soon as a trend comes. All this would not be a problem, if it was easy to predict when a flat changes to a trend and when a trend changes to a flat, but in practice it is an extremely serious task. What if you develop such an algorithm, which could eliminate an indicator's flaws and enhance its strengths? What if such an algori
Stochastic R
Antony Augustine
Stochastic  Reversal  allows you to recognize reversals professionally. Stochastic Indicator: This technical indicator was developed by George Lane more than 50 years ago. The reason why this indicator survived for so many years is because it continues to show consistent signals even in these current times. The Stochastic indicator is a momentum indicator that shows you how strong or weak the current trend is. It helps you identify overbought and oversold market conditions within a trend.  Rules
VSA target
Evgenii Bazhenov
VSA目标 该指标使用Vsa(成交量点差分析)系统在图表上识别专业买家或专业卖家,并建立相对于这些柱(烛台)的趋势支撑区,以及目标水平。  特征: 1. 在该指标中,您可以选择一种模式,其中只有专业买家或专业卖家将被确定,并且两个专业参与者将在同一时间被确定。 2. 您可以在符号上设置任何时间帧来确定支持区域和目标水平。 交易时,设置更大的时间框架来确定支撑区域和目标水平,并且交易本身可以在更小的时间框架上进行,以便更准确地进入交易。  3. 在指标设置中,如果使用分时交易量,您可以选择分时交易量,如果使用实际交易量,则可以选择实际交易量。 4. 在确定大型卖家或买家时,您可以手动选择该卷的卷大小和搜索期。 5. 可用于创建专家。 资料描述: 绿色虚线是买方的支持区。 绿色实线(粗线)(TP1,TP2)是您需要平仓的目标价位。 红色虚线是卖家的支持区域。 红色实线(粗线)(TP1,TP2)是您需要平仓的目标价位。 开设购买仓位的建议  在绿色条纹(专业买家)出现后,形成客户支持区。 在此区域中,您可以以最小的风险进行购买交易,前提是销售柱的点差很小。 止损位于买方支持区域下方。
Supertrend   indicator uses a combination of a moving average and average true range to detect the trend of a trading instrument. Supertrend indicator for MetaTrader 5 easily shows the trend as a line following the price. You can use the second my indicator: You will see 3 supertrends and EMA 200 lines on the screen. Working with my product : https://www.mql5.com/en/market/product/80692
Bullet indicator x
Dorah Zandile Mahesu
The bullet indicator gives accurate direction of the market structure, it will indicate to you the exact direction whether it be the market is in a downtrend or if it's in an uptrend it will give you that information which will inturn benefits you by saving you the time it takes to analyse that structure, this indicator works on a timeframes and it's most favourable on higher timeframes. How it works: -The green arrow will be at the support of the structure indicating buys -The red arrow will
CrossMAn MT5
Pavel Verveyko
"CrossMAn" is a table indicator that gives signals about the intersection of two moving averages, on selected instruments and time periods. The intersection of moving averages is one of the most popular signals on the stock exchange. The signal is displayed as colored rectangles in the table. Thus, you can assess at a glance which tool should be paid attention to. (Crossman does not add moving averages to the chart.) The indicator table can be dragged with the mouse. The size of the table
该产品的买家也购买
Atomic Analyst MT5
Issam Kassas
4.78 (18)
首先值得强调的是,该交易指标是非重绘、非延迟的指标,这使其成为手动和机器人交易的理想选择。 用户手册:设置、输入和策略。 Atomic Analyst是一种PA价格行动指标,利用价格的力量和动量来寻找市场上更好的机会。配备了高级过滤器,可帮助去除噪音和假信号,并提高交易潜力。使用多层复杂的指标,Atomic Analyst扫描图表,并将复杂的数学计算转化为任何初学者都能理解并用来做出一致交易决策的简单信号和颜色。 “Atomic Analyst”是专为新手和经验丰富的交易者量身定制的综合交易解决方案。它将高级指标和一流功能融合为一体的交易策略,使其成为所有类型交易者的多功能选择。 日内交易和剥头皮策略:专为快速准确的日内交易和短期交易而设计。 日内和摆动交易策略:可用作追求价格大幅波动的日内和摆动交易者的可靠工具。 多货币和市场:凭借其可靠的精度,在不同的工具和市场上运作。 多个时间框架:可在多个时间框架上使用,性能良好。 稳定性:所有指标均不重绘、不重绘和不滞后,确保可靠的信号。 信号清晰度:提供箭头信号,用于清晰的入场和出场点。 实时警报:通过交易入场、SL和TP警报通知交
首先,值得强调的是,这个交易系统是一个非重绘、非重画和非滞后的指标,这使得它非常适合手动和机器人交易。 在线课程,手册和下载预设。 “智能趋势交易系统 MT5”是专为新手和经验丰富的交易者量身定制的综合交易解决方案。它结合了超过 10 个优质指标,具有 7 多个强大的交易策略,使其成为适用于各种市场条件的多功能选择。 趋势跟随策略:提供精确的入场和止损管理,以有效地跟随趋势。 反转策略:识别潜在的趋势反转,使交易者能够利用区域市场的机会。 剃头策略:专为快速准确的日内交易和短期交易而设计。 稳定性:所有指标都不会重绘、不会重画和不会滞后,确保可靠的信号。 定制:支持自定义策略,以满足个人交易偏好。超过 7 种策略和组合可帮助您找到最佳策略。 信号清晰度:提供箭头信号,以指示清晰的入场和退出点。 实时警报:通过交易进出警报使交易者保持了解。 深入分析:提供更高时间框架的趋势分析和实时交易监控。 自适应颜色编码:利用蜡烛颜色编码来显示成交量、趋势和反转蜡烛信号。通过蜡烛颜色分析市场方向。 “智能趋势交易系统 MT5”赋予交易者必要的工具,以便在各种市场条件下做出明智和战略性的交易决策。无论
Quantum Trend Sniper
Bogdan Ion Puscasu
4.92 (48)
介绍   量子趋势狙击指标 ,突破性的 MQL5 指标,正在改变您识别和交易趋势反转的方式!由拥有超过13年交易经验的资深交易员团队开发,     量子趋势狙击指标   旨在通过其创新的方式以极高的准确度识别趋势反转,将您的交易之旅推向新的高度。 ***购买量子趋势狙击指标,即可免费获得量子突破指标!*** 当量子突破指标识别出趋势反转时,它会向您发出警报和信号箭头,并建议您三个止盈水平。 它既适合新手交易者,也适合专业交易者。 量子 EA 通道:       点击这里 MT4版本:       点击这里 建议: 时间范围: 所有时间范围。为了获得最佳结果,我们建议在 M15、M30 和 H1 时间范围内使用它。 货币对:欧元兑美元、英镑兑美元、澳元兑美元、欧元兑英镑、, EURAUD,  XAUUSD 账户类型:ECN、Raw 或 Razor,点差极低 经纪时间:任意 经纪商:IC Markets、Pepperstone with Raw 和 Razor 的点差最低 建议止损:50 点 建议止盈水平:20 点、50 点和
FX Power MT5 NG
Daniel Stein
5 (6)
通过 mql5 和 Telegram 上 的晨间简报获取每日市场更新,包括详细信息和屏幕截图 ! FX Power MT5 NG 是我们长期以来非常受欢迎的货币强度计算器 FX Power 的下一代产品。 这款下一代强度计算器能提供什么?您所喜爱的原版 FX Power 的所有功能 附加功能 黄金/XAU 强度分析 更精确的计算结果 可单独配置的分析周期 可自定义计算限制,以获得更好的性能 为希望查看更多信息的用户提供特殊的多实例设置 无尽的图形设置,可在每个图表中设置您最喜欢的颜色 无数的通知选项,让您再也不会错过任何重要信息 采用 Windows 11 和 macOS 风格的全新圆角设计 神奇的移动指标面板 FX Power 主要功能 所有主要货币的完整强势历史 所有时间框架内的货币强弱历史 所有经纪商和图表的计算结果完全相同 100% 可靠的实时计算 -> 无重绘 可通过下拉列表选择分析时段 通过自定义模式单独配置分析时段 可在一个图表中使用多个实例 可移动 FX Power 显示屏(通过拖放) 适用于高分辨率 QHD、UHD 和 4K 显示器 自动终端配置 针对平板电脑
Trend Screener Pro MT5
STE S.S.COMPANY
4.88 (66)
使用趋势筛选指标释放趋势交易的力量:由模糊逻辑和多货币系统提供支持的终极趋势交易解决方案! 使用趋势筛选器(由模糊逻辑提供支持的革命性趋势指标)提升您的趋势交易。 它是一个强大的趋势跟踪指标,结合了超过 13 种高级工具和功能以及 3 种交易策略,使其成为使您的 Metatrader 成为趋势分析器的多功能选择。 限时优惠:趋势筛选指标终身仅需 50 美元。 ( 原价 125$ ) (优惠延长) 体验趋势筛选器 100% 无需重新绘制的准确性,确保您的交易决策不受过去价格变化的影响。 释放多时间框架和多货币功能的多功能性,使您能够以无与伦比的信心在外汇、商品、加密货币和指数领域进行交易。 利用 Trend Screener 的综合策略套件增强您的交易: - 趋势跟踪策略和趋势延续策略 :趋势筛选器的趋势跟踪策略提供清晰的趋势延续信号,让您有效捕捉趋势走势并管理风险。 - 反转策略和早期入场点策略 :趋势筛选器的反转策略可检测市场方向的潜在变化,使您能够预测趋势反转并利用疲弱的市场趋势。通过早期入场点,您可以在潜在的趋势变化之前定位自己 获取可观的利润。 - 倒卖策略: 趋势筛选器的倒卖
Entry Points Pro for MT5
Yury Orlov
4.55 (161)
这款指标用于 MT5,可提供准确的入场交易信号,且无重绘。 它可应用在任何金融资产:外汇、加密货币、贵金属、股票、指数。 它将提供极其精准的评估,并告诉您何时开仓和平仓的最佳时机。 观看 视频 (6:22),其中包含一个仅处理单一信号的示例,该信号即可值回指标购价! 大多数交易者在 Entry Points Pro 指标的帮助下,在第一个交易周内即改善了他们的交易结果。 订阅我们的 Telegram 群 ! Entry Points Pro 指标的益处。 入场信号无重绘 如果信号出现,并得到确认,则它不会再消失;不像是重绘指标,它会导致重大的财产损失,因为它们可以在显示信号后再将其删除。 无差错开仓 指标算法可令您找到入场交易(买入或卖出资产)的理想时机,从而提高每位交易者的成功率。 Entry Points Pro 可操作任何资产 它允许您在 MT5 平台上交易任何经纪商的加密货币、股票、贵金属、指数、大宗商品和货币。 提供任何方向的信号 Entry Points Pro 指标提供针对任意价格走势的入场交易信号 - 上涨、下跌或横盘(横向)。
首先,值得强调的是,这个交易工具是非重绘、非重画和非滞后的指标,非常适合专业交易。 在线课程,用户手册和演示。 智能价格行动概念指标是一个非常强大的工具,既适用于新手,也适用于经验丰富的交易者。它将超过20个有用的指标合并到一个指标中,结合了高级交易思想,如内圈交易员分析和智能资金概念交易策略。该指标侧重于智能资金概念,提供有关大型机构交易方式的见解,帮助预测它们的动向。 它在流动性分析方面尤其擅长,有助于理解机构的交易方式。它擅长预测市场趋势,并仔细分析价格波动。通过将您的交易与机构策略对齐,您可以更准确地预测市场走向。该指标多才多艺,擅长分析市场结构,识别重要的订单区块,并识别各种模式。 它擅长识别BOS和CHoCH等模式,理解动量的转变,并突出显示供需强劲的关键区域。它还擅长发现强大的不平衡,并分析价格创造更高高点或更低低点的模式。如果您使用斐波那契回撤工具,该指标可以满足您的需求。它还可以识别相等的高点和低点,分析不同的时间框架,并通过仪表板显示数据。 对于使用更高级策略的交易者,该指标提供了工具,如公平价值差指标和优惠和折扣区域的识别。它特别关注高时间框架订单
FX Volume MT5
Daniel Stein
4.94 (17)
通过 mql5 和 Telegram 上 的 " 晨间简报 "获取每日市场更新,包括详细信息和屏幕截图 ! 外汇交易量(FX Volume)是第一个也是唯一一个从经纪商角度真正洞察市场情绪的交易量指标。 直接在您的图表上看到这些信息是真正改变游戏规则和突破性的交易解决方案。 受益于独特的市场数据洞察,如 比率(Ratios )显示货币多头和空头头寸的比率(百分比 比率变化 显示所选时间段内的多头比率及其百分比变化 总交易量 显示货币的总交易量(多头和空头),以手为单位 多头 交易量显示货币所有多头头寸的交易量 空头 交易量显示所有货币空头头寸的交易量 净多头 显示净多头交易量,即所有多头头寸减去所有空头头寸(以手为单位)。 净多头百分比 显示货币净多头交易量的变化 请阅读我们的基本教程 -> "如何使用外汇交易量进行交易 " 获取更多信息,如常见问题、交易技巧和教程视频,请访问我们的 外汇交易量公共信息频道 请 安装并运行 SI Connect 以建立与我们数据中心的持续连接 背景信息 我们都知道,外汇是一个分散的市场。这就是为什么我们必须打破常规思维,开发一个独
TPSpro RFI Levels MT5
Roman Podpora
5 (8)
Reversal First Impulse levels (RFI)      INSTRUCTIONS        RUS       -       ENG              R ecommended to use with an indicator   -   TPSpro  TREND PRO -  Version MT4                 A key element in trading is zones or levels from which decisions to buy or sell a trading instrument are made. Despite attempts by major players to conceal their presence in the market, they inevitably leave traces. Our task was to learn how to identify these traces and interpret them correctly. Main functi
该仪表盘显示所选符号的最新可用谐波形态,因此您可以节省时间并提高效率 /  MT4 版本 。 免费指标:  Basic Harmonic Pattern 指标列 Symbol:   显示所选符号 Trend:     看涨或看跌 Pattern:    形态类型(Gartley、蝴蝶、蝙蝠、螃蟹、鲨鱼、Cypher 或 ABCD) Entry:     入口价格 SL: 止损价 TP1: 第一止盈价 TP2: 第二次获利价格 TP3: 第三次获利价格 Current price:    当前价格 Age (in bars):   最后绘制的模式的年龄 主要输入 Symbols :   从 "28 种主要货币对 "或 "选定符号 "中选择。 Selected Symbols :   希望监控的符号,用逗号分隔("EURUSD,GBPUSD,XAUUSD")。如果您的经纪商为货币对设置了后缀或前缀,您必须在以下两个参数中添加(货币对前缀或货币对后缀)。 Max Iteration:   调整模式的最大迭代次数(如果该值越小,则模式越少,性能越快;如果该值越大,则模式越多,性能
IX Power MT5
Daniel Stein
4.17 (6)
IX Power 终于将 FX Power 的无与伦比的精确性带到了非外汇交易符号中。 它能准确判断您喜爱的指数、股票、商品、ETF 甚至加密货币的短期、中期和长期趋势强度。 您可以 分析 终端提供的 一切 。试试吧,体验一下您在交易时如何把握 时机 。 IX Power 主要功能 100% 精确的非重绘计算结果 - 适用于您终端中的所有交易符号 下拉式选择预配置以及可单独配置的强度分析周期 通过电子邮件、消息和手机通知的无数种通知选项 可访问的 EA 请求缓冲区 可自定义计算限制,以获得更好的性能 为希望查看更多信息的用户提供特殊的多实例设置 无尽的图形设置,让您在每个图表中都能找到最喜欢的颜色 采用 Windows 11 和 macOS 风格的圆角新面板设计 神奇的移动指标面板,可在子窗口和主图表之间无缝移动 适用于高分辨率 QHD、UHD 和 4K 显示器,并针对平板电脑和触摸屏进行了优化 IX Power 参数 最重要的参数不言自明,但我们很快会在另一篇文章中为您提供所有 IX Power 参数的完整说明。 使用别名 "参数可为技术交易符号
AT Forex Indicator MT5
Marzena Maria Szmit
5 (4)
The AT Forex Indicator MT5 is a sophisticated trading tool designed to provide traders with a comprehensive analysis of multiple currency pairs. This powerful indicator simplifies the complex nature of the forex market, making it accessible for both novice and experienced traders. AT Forex Indicator uses advanced algorithms to detect trends, patterns and is an essential tool for traders aiming to enhance their forex trading performance. With its robust features, ease of use, and reliable signal
介绍     Quantum Breakout PRO   ,突破性的 MQL5 指标,正在改变您交易突破区域的方式!由拥有超过13年交易经验的资深交易员团队开发,     量子突破 PRO     旨在通过其创新和动态的突破区域策略将您的交易之旅推向新的高度。 量子突破指标将为您提供带有 5 个利润目标区域的突破区域的信号箭头,以及基于突破框的止损建议。 它既适合新手交易者,也适合专业交易者。 量子 EA 通道:       点击这里 重要的!购买后请私信我领取安装手册。 建议: 时间范围:M15 货币对:GBPJPY、EURJPY、USDJPY、NZDUSD、XAUUSD 账户类型:ECN、Raw 或 Razor,点差极低 经纪商时间:GMT +3 经纪商:IC Markets、Pepperstone with Raw 和 Razor 的点差最低 规格: 不重漆! 最多 5 个建议利润目标区域 建议止损水平 可定制的盒子。您可以设置自己的 Box Time Start 和 Box Time End。 接触 如果您有任何疑问或需要帮
Matrix Arrow Indicator MT5
Juvenille Emperor Limited
5 (14)
矩阵箭头指标 MT5   是一种独特的 10 合 1 趋势,遵循   100% 非重绘多时间框架指标 ,可用于所有符号/工具: 外汇 、 商品 、 加密货币 、 指数 、 股票 。 Matrix Arrow Indicator MT5 将在其早期阶段确定当前趋势,从多达 10 个标准指标中收集信息和数据,它们是: 平均定向运动指数 (ADX) 商品渠道指数 (CCI) 经典 Heiken Ashi 蜡烛 移动平均线 移动平均收敛散度 (MACD) 相对活力指数 (RVI) 相对强弱指数 (RSI) 抛物线SAR 随机振荡器 威廉姆斯的百分比范围 当所有指标给出有效的买入或卖出信号时,相应的箭头将打印在图表上,在下一根蜡烛/柱线开盘时,指示强劲的上升趋势/下降趋势。用户可以选择使用哪些指标,并可以单独调整每个指标的参数。 Matrix Arrow Indicator MT5 仅从选定的指标中收集信息,并仅根据其数据打印箭头。   Matrix Arrow Indicator MT5   还可以为所有新信号发送终端、推送通知或电子邮件警报。无论您是黄牛、日内交易者还是波段交易者, Mat
该仪表盘可根据您对所选符号的交易策略,以剥头皮和长期模式在图表上发现并显示供需区。此外,仪表盘的扫描模式可帮助您一目了然地检查所有需要的符号,不错过任何合适的仓位/ MT4 版本 免费指标: Basic Supply Demand 功能 允许您查看多个货币对的交易机会,为您提供所有货币对的清晰简明视图,并根据其与供需区的接近程度进行排序 可定制设置,从颜色到检测参数,满足您的特定需求 主要输入 Indicator mode : 选择指标模式或具有新功能的面板模式 Symbols : 从 "28 种主要货币对 "或 "选定符号 "中进行选择 Selected Symbols : 您希望监控的符号,用逗号分隔("EURUSD,GBPUSD,XAUUSD")。如果您的经纪商对货币对有后缀或前缀,您必须在以下两个参数中添加(货币对前缀或货币对后缀) Trading Style : 选择剥头皮或长期模式 Allowed Deviation : 该参数允许修改需求或供应区域的精确度(数值越小,精确度越高) Zone   thickness : 通过该参数可以修改需求和供应
Blahtech Supply Demand MT5
Blahtech Limited
4.54 (13)
Was: $299  Now: $99   Supply Demand uses previous price action to identify potential imbalances between buyers and sellers. The key is to identify the better odds zones, not just the untouched ones. Blahtech Supply Demand indicator delivers functionality previously unavailable on any trading platform. This 4-in-1 indicator not only highlights the higher probability zones using a multi-criteria strength engine, but also combines it with multi-timeframe trend analysis, previously confirmed swings
Gartley Hunter Multi
Siarhei Vashchylka
5 (7)
Gartley Hunter Multi - An indicator for searching for harmonic patterns simultaneously on dozens of trading instruments and on all possible timeframes. Manual (Be sure to read before purchasing) | Version for MT4 Advantages 1. Patterns: Gartley, Butterfly, Shark, Crab. Bat, Alternate Bat, Deep Crab, Cypher 2. Simultaneous search for patterns on dozens of trading instruments and on all possible timeframes 3. Search for patterns of all possible sizes. From the smallest to the largest 4. A
Auto Order Block with break of structure based on ICT and Smart Money Concepts (SMC) Futures Break of Structure ( BoS )             Order block ( OB )            Higher time frame Order block / Point of Interest ( POI )    shown on current chart           Fair value Gap ( FVG ) / Imbalance   -  MTF      ( Multi Time Frame )    HH/LL/HL/LH  -  MTF      ( Multi Time Frame )  Choch  MTF      ( Multi Time Frame )  Volume Imbalance     ,  MTF          vIMB Gap’s Power of 3 Equal High
ICT, SMC, SMART MONEY CONCEPTS, SMART MONEY, Smart Money Concept, Support and Resistance, Trend Analysis, Price Action, Market Structure, Order Blocks, BOS/CHoCH,   Breaker Blocks ,  Momentum Shift,   Supply&Demand Zone/Order Blocks , Strong Imbalance,   HH/LL/HL/LH,    Fair Value Gap, FVG,  Premium  &   Discount   Zones, Fibonacci Retracement, OTE, Buy Side Liquidity, Sell Side Liquidity, BSL/SSL Taken, Equal Highs & Lows, MTF Dashboard, Multiple Time Frame, BigBar, HTF OB, HTF Market Structure
Easy Buy Sell Signal Alert
Franck Martin
4.86 (7)
Easy By Sell is a market indicator for opening and closing positions. It becomes easy to track market entries with alerts. It indicates trend reversal points when a price reaches extreme values ​​and the most favorable time to enter the market. it is as effective as a Fibonacci to find a level but it uses different tools such as an algorithm based on ATR indicators and Stochastic Oscillator. You can modify these two parameters as you wish to adapt the settings to the desired period. My othe
Dark Absolute Trend MT5
Marco Solito
5 (11)
Dark Absolute Trend   is an Indicator for intraday trading. This Indicator is based on   Trend Following  strategy but use also candlestick patterns and Volatility. We can enter in good price with this Indicator, in order to follow the main trend on the current instrument. It is advised to use low spread ECN brokers. This Indicator does   Not repaint   and   N ot lag . Recommended timeframes are M5, M15 and H1. Recommended working pairs: All. I nstallation and  Update Guide   -  Troubleshooting
Trend Sensor MT5
Yuriy Lyachshenko
该指标显示最合适的进入和退出点。它还显示所有信号的统计数据,以便更好地分析交易。 在这个指标的帮助下,你将能够更好地了解市场。 一旦趋势的力量开始减弱(这将显示在面板上),趋势线将引向水平位置 - 这是退出交易的信号。或者你可以在达到平均/中值利润水平时退出。 该指标是我自2010年以来的交易经验的结晶。 MT4的指标版本 特点 这个指标不会重新绘制。印在历史图表上的东西也将被实时打印出来。 它可以用于交易任何资产:加密货币、股票、金属、指数、商品和货币。 在所有的时间框架上都可以工作。 进入的信号出现在新蜡烛的开端。 退出交易的信号是暂定的,因为通常你可以用更大的利润关闭交易。 在左上方有一个详细的交易统计面板,它可以被最小化。 在M1到W1的时间框架上,一次显示趋势的方向和它的力量。 有一个轻量级的代码,所以它不需要加载,也不会降低终端的速度。 使用一个特殊的公式计算移动平均线,它决定了趋势的方向。 为了不错过交易的信号,你可以在警报窗口和推送中收到通知。 适用于所有级别的用户,从初学者到专家。 统计小组 取自信号历史的天数。 提供统计的信号总数。 盈利和亏损信号
PZ Support Resistance MT5
PZ TRADING SLU
4 (5)
厌倦了绘制支撑线和阻力线? 支撑阻力 是一个多时间指标,可以自动检测并绘制图表中的支撑线和阻力线,并具有非常有趣的变化:随着时间的推移测试价格水平及其重要性的提高,线变得越来越粗。 [ 安装指南 | 更新指南 | 故障排除 | 常见问题 | 所有产品 ] 一夜之间增强您的技术分析 无需浏览图表即可检测重要的价格水平 一目了然地识别所有价格水平的相对优势 每次交易最多可节省半小时的绘图线 指标显示所有价格水平的期限 指示器不重涂 过去和现在的价格水平因接近程度而崩溃,并根据当前的市场行为进行了调整。在动作发生的地方绘制了线条,而不一定在峰值处绘制了线条。 价格水平随着时间的推移而被拒绝,变得越来越暗 定期清除不重要的价格水平以避免噪音 可自定义的时间范围选择和崩溃因子 它实现了电子邮件/声音/推送警报的突破 输入参数 指标设置:指标将从当前时间段读取价格,但您可以选择另一个。例如,您可以在H4图表中显示D1支撑线和阻力线。您还可以使用 价格水平密度 参数选择在图表上显示多少价格水平。 颜色设置:根据重要性输入所需的支撑线和阻力线颜色。 标签设置:(可选)可以在指示器
MTF Supply Demand Zones MT5
Georgios Kalomoiropoulos
下一代自动化供需区。适用于任何图表的创新算法。所有区域都是根据市场的价格行为动态创建的。 两种类型的警报 --> 1) 当价格触及区域时 2) 当新区域形成时 你不会再得到一个无用的指标。您将获得一个完整的交易策略和经过验证的结果。     新的功能:     价格触及供需区时发出警报     创建新的供应/需求区时发出警报     推送通知警报     以点为单位的区域宽度标签     关于 MTF 的又一个时间表。因此,现在您将能够看到高于当前 3 个时间帧,而不是高于当前 2 个时间帧     启用/禁用警报/区域/MTF 功能的按钮 您获得的优势:     消除交易中的情绪。     客观化您的交易条目。     通过高概率设置提高您的利润。     节省绘图区域的时间。     像专业人士一样交易金融市场。     任何市场的即时多时间框架分析。 你在图表上看到了什么?     蓝色和红色矩形是当前时间范围的供需区。     虚线
Blahtech Market Profile MT5
Blahtech Limited
5 (9)
Was: $249  Now: $99   Market Profile defines a number of day types that can help the trader to determine market behaviour. A key feature is the Value Area, representing the range of price action where 70% of trading took place. Understanding the Value Area can give traders valuable insight into market direction and establish the higher odds trade. It is an excellent addition to any system you may be using. Inspired by Jim Dalton’s book “Mind Over Markets”, this indicator is designed to suit the
[ MT4 Version ] Only the next 10 units at current price! Final price: $299 Are you tired of spending months on demo or live accounts to test your trading strategies? The Backtesting Simulator is the ultimate tool designed to elevate your backtesting experience to new heights. Utilizing Metatrader historical symbol information, it offers an unparalleled simulation of real market conditions. Take control of your testing speed, test ideas quickly or at a slower pace, and witness remarkable improve
Volume by Price MT5
Brian Collard
3.6 (5)
The Volumebyprice.com Indicator for MetaTrader 5 features Volume Profile and Market Profile TPO (Time Price Opportunity). Volume and TPO histogram bar and line charts. Volume Footprint charts. TPO letter and block marker collapsed and split structure charts. Static, dynamic and flexible range segmentation and compositing methods with relative and absolute visualizations. Session hours filtering and segment concatenation with Market Watch and custom user specifications. Graphical layering, posit
AW Trend Predictor MT5
AW Trading Software Limited
4.78 (58)
一个系统中趋势和故障水平的组合。先进的指标算法过滤市场噪音,确定趋势、进入点以及可能的退出水平。指标信号记录在统计模块中,您可以选择最合适的工具,显示信号历史的有效性。该指标计算获利和止损标记。 手册和说明 ->   这里 / MT4 版本 ->   这里 如何使用指标进行交易: 使用趋势预测器进行交易只需三个简单的步骤: 第 1 步 - 开仓 收到买入信号,成功率超过 70% 第 2 步 - 确定止损 通过相反的信号选择中继线 第 3 步 - 定义止盈策略 策略一:达到 TP1 时平仓 策略 2:达到 TP1 时平仓 50%,达到 TP2 时平仓剩余 50% 策略三:在趋势反转时平仓 好处: 从不重绘结果,信号严格位于蜡烛收盘时 它可以在顾问中使用 获利和止损标记 对交易策略或独立策略的重要补充 市场噪音过滤算法 适用于任何工具 统计模块: 为了更好地选择配对,请使用内置的统计计算。 计算交易 - 给出统计数据的信号总数 成功评级 - 达到 TP1 的信号百分比,或反转那些正获利的信号时的百分比 TakeProfit1 Hit - 达到 TP1 的信号百分比 TakeProfit2
成為突破者,隨著價格反轉,市場結構會改變利潤。 訂單突破者指示器可以識別趨勢或價格走勢何時接近枯竭並準備好逆轉。它會提醒您市場結構的變化,通常會在發生逆轉或重大回調時發生。 該指標使用專有計算來確定突破和價格動能。每當在可能的耗盡點附近形成新的高點時,指標就會繪製最後一個生成該高點的順序塊。然後,它將隨價格移動隨價格跟隨定單。然後,當價格轉向相反方向並突破該訂單塊時,它會提醒您,從而創建新的市場結構並開始趨勢或重大回調的可能逆轉。 訂單塊是在創建高/低之前的最後一個相反的彩色蠟燭,並且當價格跌破這些關鍵區域以下時,這表明趨勢可能會發生短期或長期反轉。 特徵 提醒您關鍵耗盡點的市場結構變化 價格接近耗盡水平時自動提取訂單塊 在一個方向繼續移動時,在價格後面跟踪定單,以提醒您最佳的反轉輸入 將顏色更改為純色塊,以顯示何時發生市場結構中斷。 適用於所有交易品種和時間範圍 內置集成的彈出窗口和電子郵件警報 策略和如何與定單破壞者指標進行交易 當斷路器塊發生時,您有兩個選擇。 看左邊!我們正在尋求供應/需求或支撐/阻力位嗎?市場結構轉變(逆轉)通常發生在價格重新測試舊水平或
作者的更多信息
Ichimoku Advanced Pro MTF
Hoang Ngoc Thach
4.5 (2)
Ichimoku Kinko Hyo is a purpose-built trend trading charting system that has been successfully used in nearly every tradable market. It is unique in many ways, but its primary strength is its use of multiple data points to give the trader a deeper, more comprehensive view into price action. This deeper view, and the fact that Ichimoku is a very visual system, enables the trader to quickly discern and filter "at a glance" the low-probability trading setups from those of higher probability. This i
FREE
New Volume Profile
Hoang Ngoc Thach
4 (1)
Volume Profile is an advanced charting study that displays trading activity over a specified time period at specified price levels. The study (accounting for user defined parameters such as number of rows and time period) plots a histogram on the chart meant to reveal dominant and/or significant price levels based on volume. Essentially, Volume Profile takes the total volume traded at a specific price level during the specified time period and divides the total volume into either buy volume or s
Gann Fan Zigzag
Hoang Ngoc Thach
此技术分析的形成,基于市场是呈几何性和周期性的思想。 江恩扇形由一系列称为江恩角度的对角线组成,其中有九条。 这些角度叠加在价格图表上,显示出一组安全的支撑和阻力级别。 结果图像应该能够有助于技术分析师预测价格变动。 虽然曾经以手工绘制,今天江恩扇形可以由软件程序绘制。 此指标绘制的江恩扇形是基于之字折线级别的。江恩有 2 类: 水青色江恩是动态的支撑位; 红色江恩是动态的阻力位。 本指标有助于马丁格尔风格的交易者,寻找良好的支撑/阻力级别。
Advanced MA Signal
Hoang Ngoc Thach
This indicator was built based on Moving Average, but it always reset counter at the first bar of day/week/month. Simple arrow signal to show buy/sell signal. 3 lines of moving average can be used as price channel, this is market trend also. time_zone option allows choosing time for trading and session movement analysis.
Manual Panel
Hoang Ngoc Thach
5 (2)
I like trading manually, so I created this tool to make my trade more easier and faster. Features Money management. Click for place order ( Buy/Sell/BuyStop/BuyLimit/SellStop/SellLimit). Many buttons for control your account (Close All, Remove Pendings, Breakeven, Hedging). Auto hide if not use for 2 minutes. See profit on current symbol. Free to move panel to where you want. Save your settings for using on next time. Special: It's work on backtest mode! You can use this for training yourself.
Extrem Fast Channel
Hoang Ngoc Thach
This indicator helps to find high/low points. This is not perfect trend indicator, because sometime it shows anti-market trend. But it never misses highest and lowest price in history. So that, the rules for entry are: Sell with downtrend (red line), Buy with uptrend (blue line). Yellow arrows for Sell, but it should be confirmed by downtrend. Aqua arrows for Buy, but it should be confirmed by uptrend.
NoFear
Hoang Ngoc Thach
5 (1)
NoFear indicator is based on Advanced Moving Average. It is used in technical chart analysis providing signals whenever a rate change appears that exceeds the upper or lower border. The indicator works very well on trend market. It is easy to find good entry points by blue/violet arrows. The upper and lower bands should be used like support/resistance levels and stop/exit points. All signals do not repaint, and can be used immediately when they are coming. This means we do not need to wait for a
SuperTrend 2015
Hoang Ngoc Thach
The idea for indicator is using multi-SuperTrend line to define market trend and Multi Moving Average line to find good entry point. The signal doesn't repaint, wait until the bar closed to make sure the signal is confirmed. Lowest RoyalBlue line is used for Buy stoploss. Highest Magenta line is used for Sell stoploss. Indicator supports alert when signal is coming (sends email, push notifications, sound alert). High Timeframe is better for using. Indicator parameters: CountBars = 500 — How m
CCI Exit
Hoang Ngoc Thach
5 (1)
This is a great indicator to find an exit point. We never know when the market is going to change its trend. Many indicators give you a good entry point, but not good to use opposite signal as an exit point, because the signal always comes too late. This indicator will protect your profit as soon as possible when a signal to exit is found! Don't use this signal to enter, it may not be good for making an entry. The signal doesn't repaint, wait until a bar closes to make sure it is confirmed. Indi
Trend Trade 2015
Hoang Ngoc Thach
Trend Trade indicator is based on ADX indicator to define long/medium/short trend and good entry signals. The product supports virtual trade on chart to show where/when should we make an entry/exit. It works very well on D1 or above. The indicator is efficient on GOLD and CFDs. Alert_Settings = "+++++++++++++++++++++++" SendMailMode = true - Send email SendNotificationMode = true - Send notification to your phone AlertMode = true - Sound alert Show_Virtual_Trades = true - Show virtual trades Sin
Trend Prediction
Hoang Ngoc Thach
5 (3)
i-Regression Channel generates regression channel: Linear regression channel consists of two parallel lines located at the equal distance from the linear regression trend line. The distance between the channel borders and the regression line is equal to the value of the highest close price deviation from the regression line. degree - degree of regression, changes from 1 to 61; kstd - regression channel width; bars - the number of bars for the channel calculation; shift - the channel horizontal s
YourBigPlan
Hoang Ngoc Thach
The indicator is based on Moving Average to define the trend, then it finds a good entry point and follows the trend. We will keep open on a new signal until the trend is changed, and all trades exit on an opposite signal. The exit point is a bit late relative to the highest profitable point (at top/bottom), but it is the best point to exit your trades. Keep the trades, which are moving the right direction to get a high profit, and stop wrong trades as soon as possible when the trend is changed
Suport Resistance
Hoang Ngoc Thach
The indicator compares Fractal and Zigzag indicators to define hard Support and Resistance. The arrow signal appears when a new support or resistance emerges or when the price breaks through Support and Resistance zone. This indicator is efficient in conjunction with a rebound and breakout strategy. It works well on H4 and D1 for all pairs. Settings BarCounts = 200; FastPeriod = 7 - fast period SlowPeriod = 14 - slow period Show_SR = true - show support/resistance Show_Arrows = true - show up/
Using high-volatility channel breakout-style trading systems has historically worked well across major currency pairs, show promise in determining the opportune time to trade the channel breakout trading strategy. This Breakout Strategy may look simple, but it is good follow trade trader strategy. Setting: Channel Periods: default 20 BarsCount: bars count in history Alert_Settings = "+++++++++++++++++++++++" SendMailMode = true - Send email SendNotificationMode = true - Send notification to yo
Reversal Breakout
Hoang Ngoc Thach
Reversal Breakout is a real breakout strategy. It is based on Moving Average indicator to define market trend and breakout points. Try to entry when price reverse is not good, because there are many false reversal signal, so that it is better to trade breakout at reverse point. This EA will work for all Timeframe, but I prefer to use it on H1 or above. Should use it on major pairs which are lowest Spread, and lowest Slippage: EURUSD,GBPUSD,USDJPY,GOLD,... No martingale No Grid Always use Stoplos
The indicator uses 2 Moving Average: 1 fast EMA and 1 slow EMA to define trend, reversal signal and breakout point. Reversal Signal comes on open time, it can be used as scalping signal for short time, but be careful with this signal because it may be an anti-trend signal, the indicator tries to catch reverse point. Breakout signal is where support or resistance was broken out, the reversal signal has failed. Breakout signal is stronger than the Reversal Signal. We can use support/resistance lev
ATeam Sonic Hope
Hoang Ngoc Thach
ATeam Sonic Hope ATeam Sonic Hope is a fully automated Expert Advisor with no use of martingale, sometime EA open more trade with new signal and exit all trade with overall profit. Some ocillators indicator were used to generate signal and use Higher Timeframe as maintrend to entry. Real operation monitoring as well as my other products can be found here: https://www.mql5.com/en/users/rockyhoangdn/seller General Recommendations The minimum deposit is 100 USD,  Recomend low spread pair like :
ATeam Divergence
Hoang Ngoc Thach
The CCI Divergence is a reasonably useful indicator in itself, but it is even more effective when used with divergence pattern trading. The CCI Divergence indicator signal is one of the most potent signals among the indicators that exist in the market. Here is new version for Divergence Indicator using CCI method, with more improvements. Divergences indicate a potential investment point because the directional moment does not confirm the price. A bullish divergence occurs when the underlying
ATeam Impulse
Hoang Ngoc Thach
The Elder Impulse System was designed by Alexander Elder and featured in his book. According to Elder, “the system identifies inflection points where a trend speeds up or slows down”. The Impulse System is based on two indicators, a  exponential moving average and the MACD-Histogram. The moving average identifies the trend, while the MACD-Histogram measures momentum. As a result, the Impulse System combines trend following and momentum to identify tradable impulses. This unique indicator combina
ATeam Panel
Hoang Ngoc Thach
This is best control panel for trader who trade with Supply and Demand Zone. Easy to calculate entry lotsize by %risk/money risk/money target/fixed lot And support Half-Kelly feature: calculate the best Risk percentage for each trade follow Kelly criterion . Auto Change chart feature Exposure and Position manager Currencies Strength Meter And more features waiting you
If you have been anywhere near Forex forums or social media lately, you have no doubt been hearing people talk about   Smart Money Concepts (SMC)   trading. You may be wondering what SMC is, and whether it deserves all the hype. In this post, we will introduce Smart Money Concepts trading to you so you can make an informed decision about whether or not to give this strategy a try in your own trading. What is SMC Forex trading? Smart Money Concepts (SMC) is one of many forex trading methods. SMC
This indicator is the same as the popular Heiken Ashi Smoothed. The Heikin Ashi indicator for MetaTrader 5 already exists, but it has two disadvantages: It paints the candles not accurate. It's not possible to change the candle width. See also Heikin Ashi in MQL5 Code Base . In this version there are no such disadvantages.
Any financial instrument that is traded on the market is a position of some active towards some currency. Forex differs from other markets only in the fact, that another currency is used as an active. As a result in the Forex market we always deal with the correlation of two currencies, called currency pairs. The project that started more than a year ago, helped to develop a group of indicators under a joint name cluster indicators. Their task was to divide currency pairs into separate currenci
This indicator is a copy of the Gann Hi-Lo Activator SSL indicator which was rewritten in MQL5. The original indicator was one-colored, that is why for more visual definition of the trend direction it was necessary to make it colored. This version is Mutitimefame, now you can see multi-trends in a separate window and signals in the main chart. Alert mode and sending of emails has been also added.
Ichimoku MTF
Hoang Ngoc Thach
MTF Ichimoku is a MetaTrader 5 indicator based on well known Ichimoku. In MetaTrader 5 we have Ichimoku already included as a standard technical indicator. However it can be used only for the current timeframe. When we are looking for a trend, it is very desirable to have Ichimokuis showing higher timeframes. MTF Ichimoku presented here has additional parameter - TimeFrame. You can use it to set up higher timeframe from which Ichimokuis will calculate its values. Other basic parameters are not c
Ichimoku Kinko Hyo is a purpose-built trend trading charting system that has been successfully used in nearly every tradable market. It is unique in many ways, but its primary strength is its use of multiple data points to give the trader a deeper, more comprehensive view into price action. This deeper view, and the fact that Ichimoku is a very visual system, enables the trader to quickly discern and filter "at a glance" the low-probability trading setups from those of higher probability. This i
The Forex trading market operates 24 hours a day but the best trading times are when the major trading sessions are in play. The Sessions Moving Average indicator helps identify Tokyo, London and New York, so you know when one session starts, ends or even overlaps. This indicator also shows how session affects the price movement. Now, you can see the market trend by comparing the price with 3 Average lines or comparing 3 Average lines together.
CCI Trend
Hoang Ngoc Thach
The commodity channel index (CCI) is an oscillator originally introduced by Donald Lambert in an article published in the October 1980 issue of Commodities magazine (now known as Futures magazine). Since its introduction, the indicator has grown in popularity and is now a very common tool for traders in identifying cyclical trends not only in commodities, but also equities and currencies. The CCI can be adjusted to the timeframe of the market traded on by changing the averaging period. This indi
This is HTF (or MTF) of original Kolier SuperTrend indicator. On this version, you can use 4 Lines of supertrend to define the trend, it will be more powerful. Remade signals on smalls timeframes, the indicator will not repaint if used on small timeframes.
筛选:
Gennadiy Voltornist
11909
Gennadiy Voltornist 2017.12.01 18:09 
 

用户没有留下任何评级信息

Daniel Andrejczuk
5596
Daniel Andrejczuk 2017.11.09 03:08 
 

用户没有留下任何评级信息

Nork
6194
Nork 2016.03.31 10:20 
 

用户没有留下任何评级信息

Rodrigo da Silva Boa
7136
Rodrigo da Silva Boa 2016.01.10 21:25 
 

用户没有留下任何评级信息

[删除] 2014.05.16 07:28 
 

用户没有留下任何评级信息

Vadim Strelkov
7710
Vadim Strelkov 2014.03.28 13:30 
 

用户没有留下任何评级信息

回复评论
版本 2.0 2021.11.17
Update for new build of MT5