Volume Levels
- 指标
- Alexander Nikolaev
- 版本: 1.2
- 更新: 23 十一月 2021
- 激活: 15
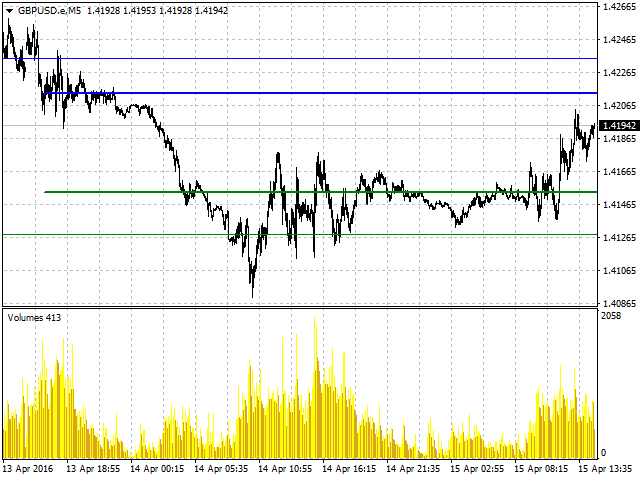
Volume Levels is a very important indicator for exchange trading. Most of the trades were performed on those levels. This indicator displays the price level that had the most trade volumes over a certain period of time. Often, the price bounces from those levels in the future, and it can be successfully used in trading. It works on any currency pair.
Parameters
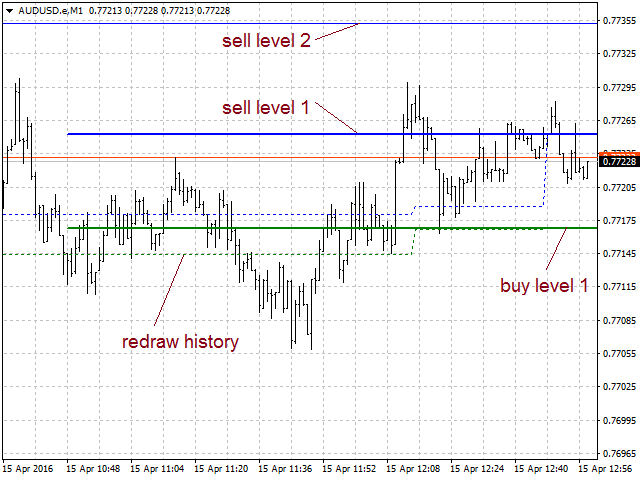
- HistoryBars - the number of bars to determine the near volume levels;
- Range - the maximum distance above and below the current price to determine the levels;
- HistoryBarsLevels2 - the number of bars to determine the distant volume levels;
- MinDistanceLevels2 - the minimum distance from the near level to the distant one;
- RedrawTime - the levels redrawing time;
- Step - the step to determine the levels (the smaller the step, the higher the accuracy, but the calculation of levels may take longer);
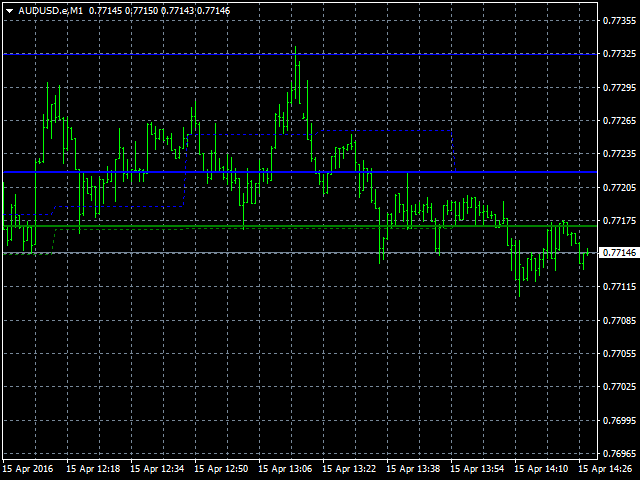
- ColorLow - color of the lower levels;
- ColorHigh - color of the upper levels.
Recommendations
The smaller the timeframe and at the same time the greater the HistoryBars parameter, the stronger are the levels. When using on a 5-digit account, it is better to increase the Range and MinDistanceLevels2 parameters 5-10 times. The indicator is best used on the smaller timeframes (М1, M5, M15, M30), but it can also be used on the higher ones.


Great product after months of using its worth to buy for sure !!