Advanced Power Trend MT5
- 指标
- Sergey Efimenko
- 版本: 1.2
- 更新: 12 七月 2022
- 激活: 10
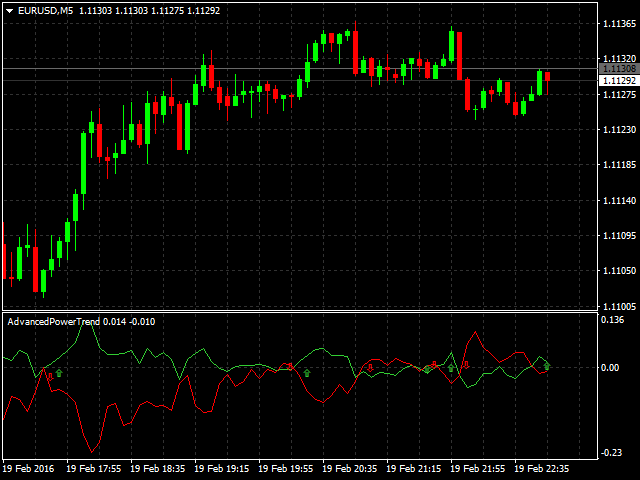
独特的“剥头皮”趋势指标,具有对结果线进行多层平滑和多种参数选择的功能。它有助于确定趋势的可能变化或几乎在运动开始时的修正。切换的交叉箭头固定并出现在新柱的开盘处,但是,如果有足够的经验,一旦指标线在未完成的柱上相交,就可以寻找入场机会。信号出现限制级别作为附加过滤添加到指标中。
参数:- PeriodMA - 主要移动平均线计算周期
- MethodMA - 主要移动平均计算方法
- PriceMA - 主要移动平均线计算应用价格
- BasePeriod - 基本趋势周期
- BaseMethod - 基本趋势线的平均方法
- BasePrice - 基本趋势线的应用价格
- PowerPeriod - 趋势强度计算周期
- PowerPrice - 趋势强度计算价格
- PeriodBaseSmooth - 趋势线额外平滑的周期
- BaseLineSmoothMethod - 附加平滑趋势线的方法
- PeriodPowerSmooth - 强度线额外平滑的周期
- PoweLineSmoothMethod - 强度线的附加平滑方法
- ShowArrows - 启用交叉箭头的显示
- Levels - 显示交叉箭头时的附加过滤级别
- ShowInitialLevels - 启用指标在图表上非零值的自动绘制
- ShowCrossCalcComment - 启用有关线的可能交点的当前值的通知
- ArrowUpCode - 向上箭头代码
- ArrowDnCode - 向下箭头代码
- AddDigits - 启用额外的读数精度