PZ Lopez Channel
- 指标
- PZ TRADING SLU
- 版本: 2.0
- 更新: 11 八月 2019
- 激活: 20
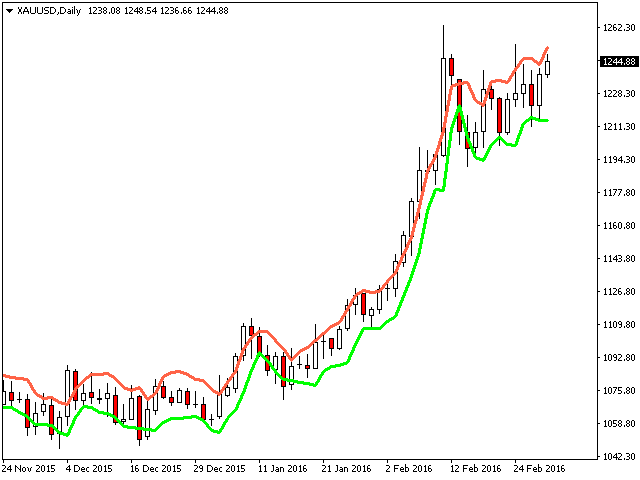
This multi-timeframe indicator identifies the market's tendency to trade within a narrow price band.
[ Installation Guide | Update Guide | Troubleshooting | FAQ | All Products ]
- It is easy to understand
- Finds overbought and oversold situations
- Draws at bar closing and does not backpaint
- The calculation timeframe is customizable
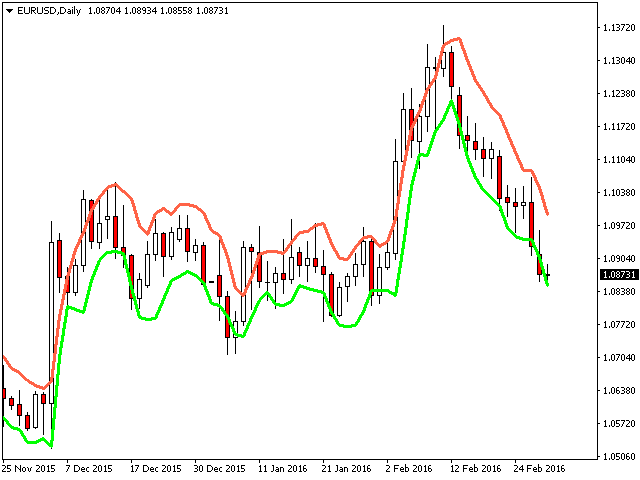
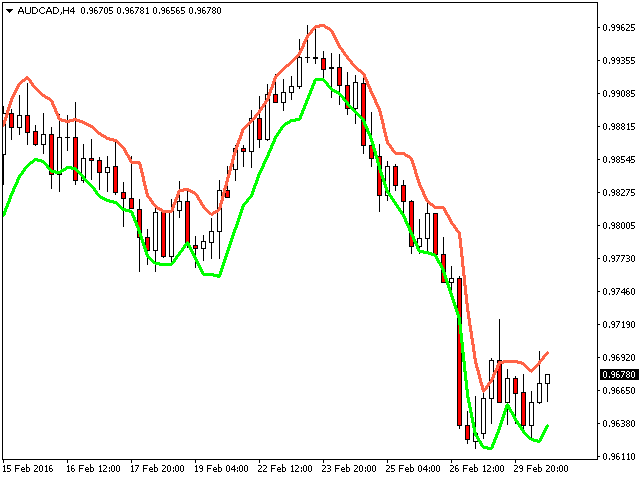
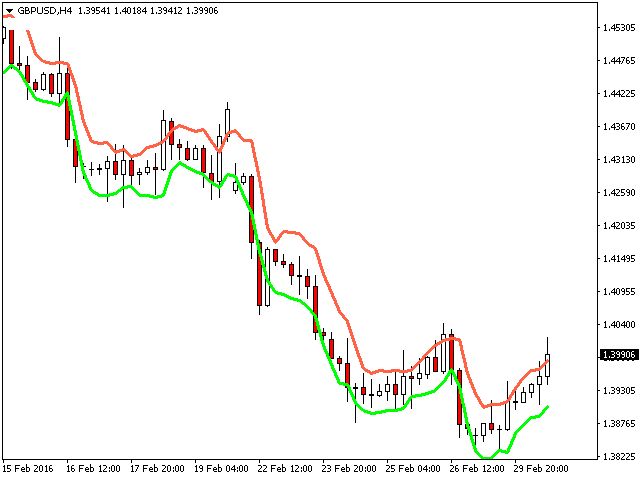
- The red line is the overbought price
- The green line is the oversold price
It has straightforward trading implications.
- Look for buying opportunities when the market is oversold
- Look for selling opportunities when the market is overbought
The indicator is calculated using a three-day moving average of the last two true highs minus ATR to derive the lower channel and a three-day moving average of the last two true lows plus ATR to derive the lower channel.
Input Parameters
- Timeframe: Timeframe to calculate the bands from
- Indicator Period: Amount of bars to look back to calculate the channel
Author
Arturo López Pérez, private investor and speculator, software engineer and founder of Point Zero Trading Solutions.
