• 概述
  • 评论
  • 评论 (2)

Zone with Alerts with Trend identification

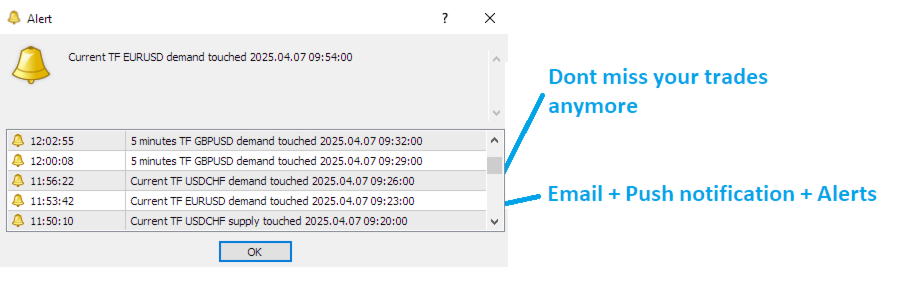
Supply demand zone with added Alerting system.

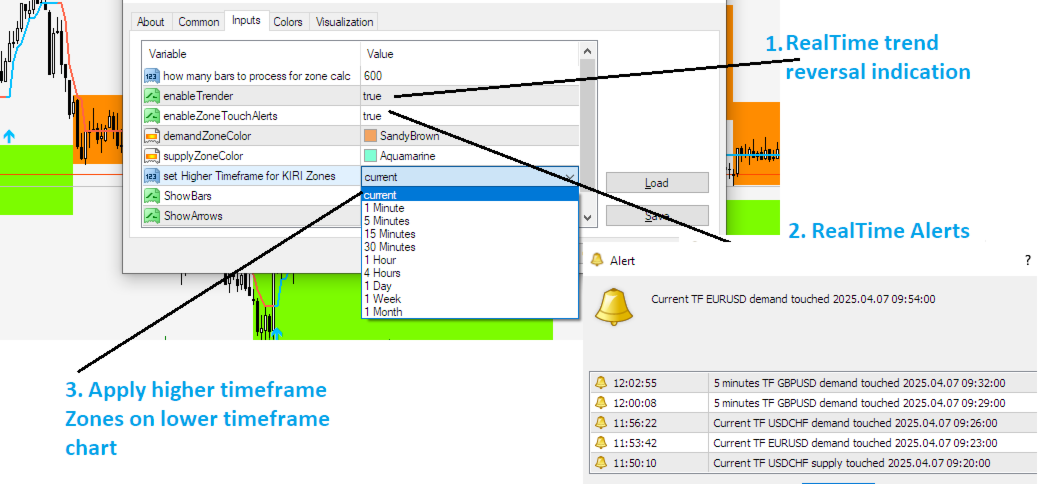
1. Most people including me have been missed out of trade because we somehow got distracted. no worries, i have added an alert to our zones now. (metatrader doesnt show alerts in strategy tester)

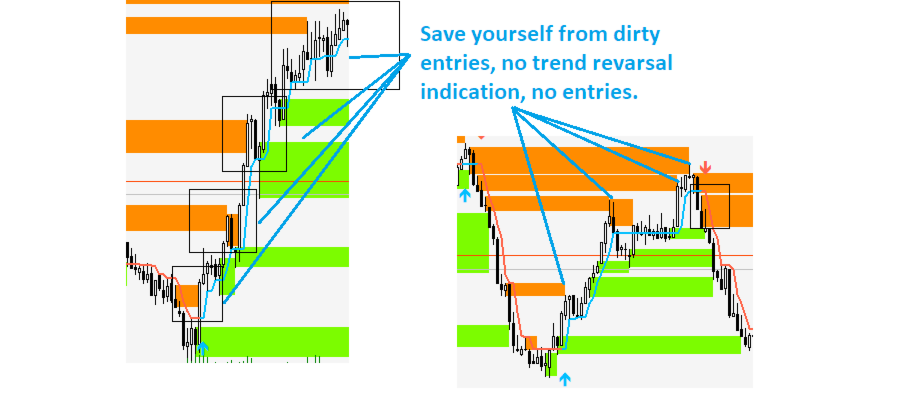
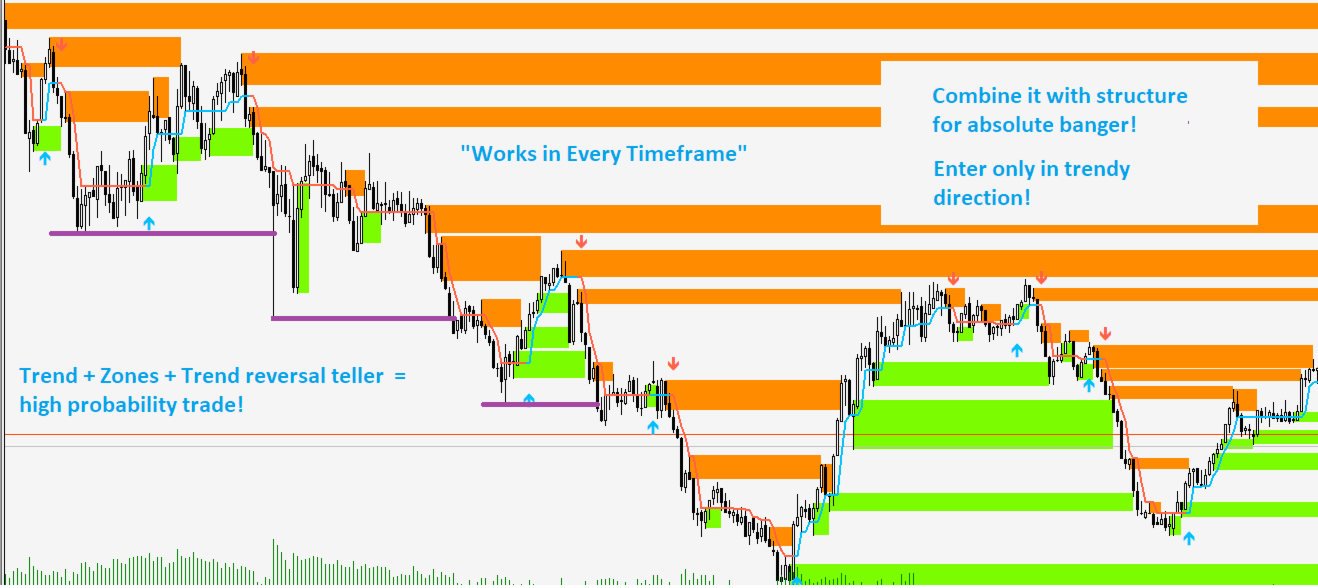
2. Most people dont know when to enter the market when it comes to zone based trading. no worries, i have added trend reversal identification mechanism.

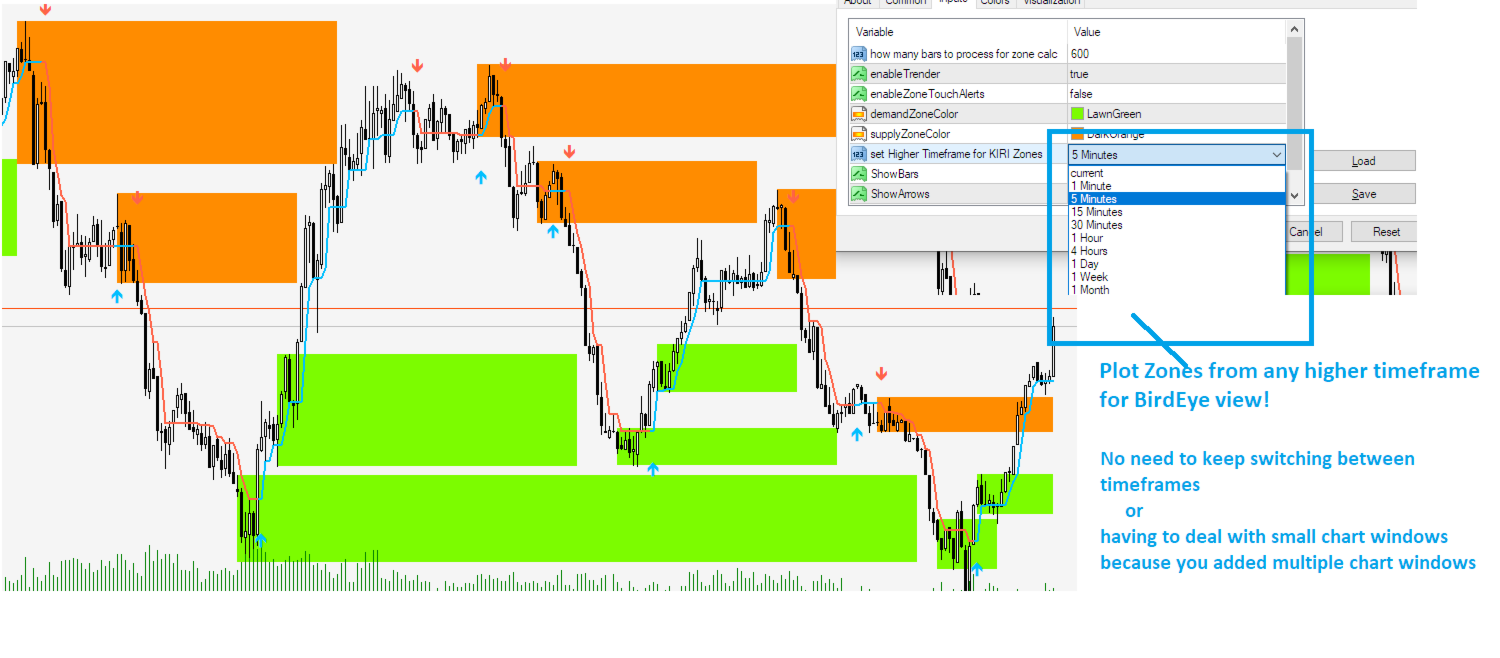
3. It's frustrating to mark zones in higher timeframe and switch back to lower timeframe and keep on watching if higher tf has created anything new, no worries, i have added that feature in the indicator.

4. Add indicator multiple times, its coded in such way that even if you add indicator 10 times, all will work seamlessly together.


Indicator comes with a manual; manual will help people who are yet to find edge in the market. 


Manual includes, (Check comments for manual)

- 2 Entry modules that works with two different market conditions.

- Multiple Concrete Exit methods that are each separately used in different market conditions.

- Method to choose high probability trades and ignore others.

- Guide on market structure to identify structure the right way that works with zones.

- Possible false break and trend reversal identification guide.

- I will answer all your questions in private chats.

- If you manage your psychology and use the strategies as it is then possibly i will add you in my community (after validations).


You dont need manual if you already have edge and just searching for the right indicator that fits your needs.


Happy trading :)


I also code indicators, before a trader i am a software engineer, trading is boring and i entertain my-self with challenging programmatic tasks. if you have anything that needs to be coded, feel free to have a conversation. 

推荐产品
Price Level Alerts
Snapdragon Systems Ltd
Introduction This indicator alerts you when certain price levels are reached. The alert can be on an intrabar basis or on a closing price basis. It will also send alerts when one forms, including via e-mail or push notification to your phone . It's ideal for when you want to be notified of a price level being reached but don't want to have to sit in front of your chart all day. Input Parameters DoAlert: if set to true a desktop pop-up alert will appear from your MetaTrader terminal when the
In the context of trading,   Malaysia SNR   (Support and Resistance) refers to the technical analysis of   support and resistance levels   in financial markets, particularly for stocks, indices, or other assets traded. There are three type of Malaysia SNR level Classic , GAP and Flipped 1. Classic Support   is the price level at which an asset tends to stop falling and may start to rebound. It acts as a "floor" where demand is strong enough to prevent the price from dropping further. Resistance
Ska ZigZag BuySell
NKATEKO VUKOSI LEROY MASANGO
Ska ZigZag BuySell indicator determines the overbought and oversold regions within a trend. The indicator determines the overbought region by the candlestick high and the oversold region by the candlestick low. This indicator only gives signals with arrow and audible alerts each and every time when a new candlestick appear. To utilize the full strategy i recommend using "Ska ZigZag BuySell" together with "Ska ZigZag Line". The Ska ZigZag Line indicator is available for free. NOTE: Indicator is h
The indicator compares pattern found on chart history with the current price movement. Since history repeats itself, then, by comparing the two patterns, indicator can predict the further movement of the price. The indicator allows you to overlay highlighted history pattern with current movement and you will visually see this movement and will be able to compare the past and the present. To compare two patterns, you need: It is necessary to find and highlight a pattern on the history chart of a
Doji Engulfing Paths
Boubacar Tidiane Traore
Presentation Doji Engulfing Paths enables to get signals and data about the doji and the engulfing patterns on charts. It makes it possible to get opportunities from trends, and to follow the directional moves to get some profits on the forex and stocks markets. It is a good advantage to take all the appearing opportunities with reversal signals and direct signals in order to obtain some profits on the forex market. System features With fast execution, it allows to register directly the informa
A arca v1
Wellington Macedo Da Paixao
产品名称 A arca 主要功能 自动识别关键区间 A arca可自动检测并标示支撑和阻力水平,帮助交易者更轻松地发现潜在的买卖点。 清晰的买卖信号 提供清晰的买入和卖出标记,帮助交易者定义进出场的最佳时机,提高交易决策的效率。 多周期分析 整合不同周期(如M5, M15, H1等)的图表数据,有助于从多角度洞察市场趋势,提高分析的准确度。 可自定义且易于使用的界面 允许用户根据个人需求和策略定制颜色、线条及水平,让技术分析环境更加个性化。 风险管理工具 通过识别可能出现的反转区域,A arca帮助交易者更轻松地设置止损与止盈,提升风险管理的有效性。 主要优势 决策更迅速、更准确 自动识别关键区域,减少手动分析的时间,提高决策速度与自信度。 节省时间和精力 清晰直观的可视化信号,让交易者可将更多精力投入策略和风险控制,而非纠结于繁琐的图表分析。 提升交易成功率 多周期分析与精准信号结合,能有效提高交易成功率并增强整体绩效。 兼容多种交易风格 无论是日内交易、剥头皮交易还是波段交易,A arca都能满足不同投资者的需求。 与众不同之处 智能化自动分析 采用高级算法自动
Indicators 14 in 1
Makarii Gubaydullin
5 (1)
14个指标和辅助工具,方便交易 该工具包含14个额外的工具,可能对交易者的某些操作有用,   从而简化和加速交易过程。 查看我的  #1 Trade Manager :包含66+功能和指标  |   联系我  如果您有任何问题 由于不同的显示器分辨率,一些用户可能会遇到标签显示重叠或太小的问题。如果您遇到此问题,可以 调整字体大小: 输入变量中的第1个参数。 专业的Price Action指标,可视觉配置模式。 未来柱指标。 倒计时任何时间框架的蜡烛关闭。 柱大小指标。 自动支撑和阻力水平。 自动斐波那契水平。 缺口指标。 潜在盈利/亏损水平。 在单个窗口中显示多个时间框架的实用工具。 全球交易时段指标。 计算未平仓交易结果的实用工具。 带有市场信息的状态栏。 所有时间框架上柱方向的指标。 专业的价格提醒实用工具。 每个辅助工具可以   单独打开/关闭   ,点击相应的   绿色   按钮。 要 关闭  所有指标,点击 [Disable All] 按钮。 指标的详细功能描述:  https://www.mql5.com/zh/blogs/post/743146 如果您对改进指标功能有任
Indicador de sesion de trabajo
Edmundo Antonio Bazan Garcia
Permite ver el horario comprendido entre la hora inicial que indique el usuario y la hora final, de esa manera, si el usuario desea ver sobre el grafico una sesion de trabajo, solo tiene que indicar la hora incial y la hora final de la sesion que desee. Esto permite que el usuario identifique con mayor facilidad el horario que comprenda la sesion de trabajo que el usuario desee vigilar, o trabajar, o simplemente tener como referencia.
The Best Choice compra y venta
Sandro Israel Hernandez Zamora
¿Has escuchado decir que la tendencia es tu amiga? pues nada es mas cierto en el mundo del trading. Este indicador analiza las tendencias y su fuerza para que puedas aprovecharlas y utilizamos un conjunto de indicadores como RSI, %W, MACD y EMAS para analizar el mercado y sus movimientos, por lo que podrás mantener tu gráfico limpio sabiendo que todos estos indicadores los tienes en uno solo. Este, como cualquier indicador, no representa una certeza de compra o venta definitiva, por lo siempre r
KT Price Border MT4
KEENBASE SOFTWARE SOLUTIONS
KT Price Border 创建了一个由三条带组成的价格通道,用于识别市场中的潜在高点和低点。这些水平还可以用作动态市场支撑和阻力。 中间带还可以用于识别趋势方向,因此它也可以作为趋势跟踪指标。此外,其简单易用的特点以及清晰的交易信号,使新手交易者受益匪浅。 功能特点 适用于大多数外汇货币对。 可用于低时间框架和高时间框架。 适用于剥头皮交易、日内交易和波段交易。 支持趋势交易和逆势交易策略。 当价格突破价格带时,可发送提醒通知。 价格带还可作为动态支撑和阻力水平。  理解价格边界的概念 该指标的工作原理类似于布林带。下轨表示市场超卖区域,同时充当动态支撑。 上轨表示市场超买区域,同时充当动态阻力。中间带用于确定趋势方向。 如果价格收于中间带上方,则表明市场仍处于上升趋势;相反,如果价格收于其下方,则表明市场仍处于下降趋势。 专业建议 使用 KT Price Border 进行交易时,可以自由选择自己偏好的入场、止损和止盈方法。 与任何指标一样,应遵循更广泛的市场趋势,并在模拟账户上进行练习,直到完全掌握。请记住,即使是最好的交易指标,在长期交易中也无法保证 100% 的胜
Please follow the "How To Trade" instructions exactly for best results Wycoff theory is vastly used by institutional traders but when it comes to retail traders the concept isn't well understood by most. It is even more difficult to implement in intraday & swing trading. This No REPAINT indicator helps you in analyzing the market cycles and plots buy/sell signals at the start of trending phase. It studies the market strength of bulls and bears and does a effort Vs reward matrix calculation befor
引入 布林带成交量突破检测器 ,这是一个强大的技术指标,旨在增强流行的 布林带突破策略 。该指标通过结合交易量数据将趋势跟踪提升到一个新的水平,有效地减少错误信号。该工具秉承“以量定价”的原则,使交易者能够识别伴随着成交量显着增加的价格突破,从而确保更准确的交易决策。该指标的可定制性使交易者能够利用大量数据微调他们自己的策略。 该指标的主要特点之一是其完全可定制的布林带,可根据个人喜好进行定制。此外,成交量数据的整合通过与移动平均线 (MA) 的颜色编码战斗直观地表示,从而可以轻松识别与 22 天平均线相关的成交量突破。交易者可以通过移动提醒、弹出消息和电子邮件提醒接收通知,通知他们成交量突破 22 天平均线以及价格突破上轨和下轨。可以根据偏好单独激活或停用每种通知方法。 为了进一步协助交易者,该指标在附加数据面板中显示相关数据,提供对市场动态的宝贵见解。此外,这种多功能工具适用于各种符号的应用,确保其在各种交易场景中的实用性。 该指标的参数提供了灵活性和对交易决策的控制。 Bollinger Signal Filter 允许用户选择移动平均线 (MA) 方法和 Applied Pri
TMoney OrderblockDay
Moises Orlando Urbina Sojo
The indicator is triggered at the start of each trading day and detects both bullish and bearish ORDERBLOCK potentials. These levels are of high operational probability, being able to use a minimum ratio of 3 to 1 to maximize profits. It is recommended to use TimeFrame M5 to M30 for a proper display and consider pending orders at the OB levels of the chart and place the SL up to a maximum of 20 pips from the entry price. Submit the indicator to Backtesting to become familiar with its performan
KT 4 Timeframe Trend MT4
KEENBASE SOFTWARE SOLUTIONS
The KT 4 Time Frame Trend is an invaluable forex indicator for traders seeking to identify the trend direction across 4-time frames accurately. This innovative indicator allows users to simultaneously observe and analyze price trends across four different timeframes. Whether you're a beginner or an experienced trader, this tool offers an enhanced understanding of trend dynamics, leading to improved trading strategies on your trading platform. The capability to concurrently monitor multiple timef
This indictor is developed to help traders identify pivot levels in market . Some people also call it support and resistance levels or zones. We have finally publishing the most advanced pivot indicator in mql5 market because it is developed using accurate pivot zones only  . Remember always use bigger timeframes to get strong pivot levels. It will help you reversal trading. Visit our website from here
Alert Up Down MT4
William Oswaldo Mayorga Urduy
METATRADER 5 的警报向上 - 向下 当价格离开 UP 和 DOWN 线之间的区域时,该指标会生成警报。 您可以生成各种类型的警报,例如: > 声音 > 留言框 > 在专家框中留言 > 邮件(之前配置) > 推送通知(先前配置) 线条必须从指标属性配置,而不是从线条属性配置,因为如果从线条属性完成,finonacci 可能会受到影响。 在这些设置中,您可以更改颜色、线条样式和宽度。 线条必须从指标属性配置,而不是从线条属性配置,因为如果从线条属性完成,finonacci 可能会受到影响。 在这些设置中,您可以更改颜色、线条样式和宽度。 线条必须从指标属性配置,而不是从线条属性配置,因为如果从线条属性完成,finonacci 可能会受到影响。 在这些设置中,您可以更改颜色、线条样式和宽度。
Welcome to enhanced pattern detection with the Double Top and Bottom Pattern Scanner ! Transform your trading approach with this powerful MT4 indicator designed for efficient pattern scanning and actionable alerts. Key Features: Advanced Zig Zag Pattern Detection : The Double Top and Bottom Pattern Scanner uses the zig zag pattern to detect tops and bottoms. It identifies points where the price bounces back twice from the same level after a long trend, signaling potential market reversals. Real
Breakout Entry Signals MT4
Christopher Graham Parish
!! FLASH SALE !!   Over 80% off !!     For ONE week only. Now only $47 - normally $297! >>>      Ends on 30 June 2023 - Don't miss it! Buy and Sell Alerts when price breaks out following strict price action. Sends Alerts – On MT4 To Your Phone To Your Email Does not repaint . Works on any Forex pair, any timeframe. 10 Activations allowed so you are free from limitations >> MT5 Version Here For spreads from a tiny 0.1 pips RAW/ECN Accounts,  click here . Check out my Waka Esque EA signal her
Moving Average Crossover Scanner and Dashboard Advanced Moving Average Scanner Moving Average Crossover Dashboard The indicator scans the market and sends signals and alerts for Moving Averages crossovers, death cross and golden cross. Crossovers are one of the main moving average ( MA ) strategies. MA Crossover ( cut ) strategy is to apply two moving averages to a chart: one longer and one shorter. When the shorter-term ( fast MA ) MA crosses above the longer-term ( slow MA ) MA, it's a buy sig
Trend Tracking System is an indicator that generates trade arrows. It generates trade arrows with its own algorithm. These arrows give buying and selling signals. The indicator certainly does not repaint. The point at which the signal is given does not change. You can use it in all graphics. You can use it in all pairs. This indicator shows the input and output signals as arrows and alert. When sl_tp is set to true, the indicator will send you the close long and close short warnings. It tells yo
KT Horizontal Lines MT4
KEENBASE SOFTWARE SOLUTIONS
In MetaTrader, plotting multiple   horizontal lines   and then tracking their respective price levels can be a hassle. This indicator automatically plots multiple horizontal lines at equal intervals for setting price alerts, plotting support and resistance levels, and other manual purposes. This indicator is suitable for Forex traders who are new and looking for chances to make quick profits from buying and selling. Horizontal lines can help traders find possible areas to start trading when the
Fractal Channel Breakout MT4
KEENBASE SOFTWARE SOLUTIONS
KT Fractal Channel Breakout draws a continuous channel by connecting the successive Up and Down fractals. It provides alerts and also plots the Up and Down arrows representing the bullish and bearish breakout of the fractal channel. Features If you use Bill Williams fractals in your technical analysis, you must also include it in your trading arsenal. It can be very effective and useful for stop-loss trailing. A new market trend often emerges after a fractal channel breakout in a new direction.
KT ZigZag Arrows MT4
KEENBASE SOFTWARE SOLUTIONS
The indicator plots the Up and Down arrows on every price swing made by the classic Zigzag indicator. When Zigzag makes a new swing low, a green arrow is plotted. Likewise, a red arrow is plotted when Zigzag makes a new swing high. Features Compared to the classic ZigZag, it marks the swing points more effectively. It helps to identify the forming chart patterns in advance. It comes with a Multi-Timeframe scanner which shows the Zigzag direction on each timeframe. All Metatrader alerts included
NOTE: PRICE WILL RISE VERY SOON. DON'T SKIP THIS OFFER! Dear traders I am glad to introduce the " Market Swing Scanner Board" indicator to you. This indicator was made mainly to be used in combination with the Market Swing Index Indicator. You use the  "Market Swing Scanner Board"  indicator to scan for trading opportunities on the  Market Swing Index Indicator . This tool is designed for serious traders who have decided to make a difference through trading. Be the next person to witness this st
a novel indicator by the maker of velvet.                                                                                                                                                                                                                                                                                                                                                                                                                                                                           
FREE
The indicator monitors the Dinapoli MACD trend in multiple timeframes for the all markets filtered and shows the results on Dashboard. Key Features Indicator can be used for all markets Monitors every timeframe, from 1 Min to Monthly Parameters UseMarketWatch: Set true to copy all symbols available in market watch MarketWatchCount : Set the number of symbols that you want to copy from the market watch list. CustomSymbols: Enter the custom symbols that you want to be available in dashboard. Ti
The Levels indicator has been created to simplify the process of plotting support and resistance levels and zones on selected timeframes. The indicator plots the nearest levels of the selected timeframes, which are highlighted in different colors. It significantly reduces the time needed to plot them on the chart and simplifies the market analysis process. Horizontal support and resistance levels are used to identify price zones where the market movement can slow down or a price reversal is lik
KT Auto Fibo
KEENBASE SOFTWARE SOLUTIONS
KT Auto Fibo draws Fibonacci retracement levels based on the ongoing trend direction. The Highs and Lows are automatically selected using the Maximum and Minimum points available on the chart. You can zoom in/out and scroll to adjust the Fibonacci levels accordingly. Modes Auto:  It draws the Fibonacci levels automatically based on the chart area. Manual: It draws the Fibonacci levels only one time. After that, you can change the anchor points manually. Usage: Helps to predict the future profi
Fibonacci colores
Carlos Augusto Cedeno Rocha
Fibonacci por color en niveles para aplicar estrategia profesional inicialmente se coloca en el punto mas alto del dia y mas bajo con esto es para ubicar operaciones a una distancia exacta con lo cual se busca generar ganancias residuales internas en el mismo dia con esto las lineas fusias es para colocar las entrdas sell y las lineas verdes amarillas van los buy
Super MA Trend indicator is an indicator designed to find trends. It uses a moving average, a set of candle combinations and High/Low levels to find trends. This indicator is a complete trading system. You can trade with this indicator as you like. Features and Recommendations You can use this indicator on all pairs except for the volatile pairs. It is recommended to use it on M15 and over graphics. The most important element in this indicator are alerts. Do not open orders unless you receive a
该产品的买家也购买
Gann Made Easy
Oleg Rodin
4.8 (117)
Gann Made Easy 是一个专业且易于使用的外汇交易系统,它基于使用先生理论的最佳交易原则。 W.D.江恩。该指标提供准确的买入和卖出信号,包括止损和获利水平。您甚至可以使用推送通知在旅途中进行交易。 购买后请联系我!我将免费与您分享我的交易技巧和丰厚的红利指标! 您可能已经多次听说过江恩交易方法。通常 Gann 的理论不仅对于新手交易者而且对于那些已经有一定交易经验的人来说都是非常复杂的东西。这是因为江恩的交易方法在理论上并不那么容易应用。我花了几年时间来完善这些知识,并将最好的原则应用到我的外汇指标中。 该指标非常易于应用。您所需要的只是将其附加到您的图表并遵循简单的交易建议。该指标不断进行市场分析工作并寻找交易机会。当它检测到一个好的入口点时,它会为您提供一个箭头信号。该指标还显示止损和获利水平。 换句话说,当您像先生一样进行交易时,该指标会为您提供最佳江恩建议。江恩亲自告诉你此时此刻该做什么。但最好的部分是您不需要了解任何有关江恩交易原则的知识,因为该指标会为您完成整个市场分析工作。
Cycle Maestro
Stefano Frisetti
NOTE: CYCLEMAESTRO is distributed only on this website, there are no other distributors. Demo version is for reference only and is not supported. Full versione is perfectly functional and it is supported CYCLEMAESTRO , the first and only indicator of Cyclic Analysis, useful for giving signals of TRADING, BUY, SELL, STOP LOSS, ADDING. Created on the logic of Serghei Istrati and programmed by Stefano Frisetti ; CYCLEMAESTRO is not an indicator like the others, the challenge was to interpret only t
目前八折优惠! 对任何新手或专家交易者来说都是最好的解决方案! 这个仪表板软件适用于28种货币对。它基于我们的两个主要指标(高级货币强度28和高级货币冲动)。它对整个外汇市场提供了一个伟大的概述。它显示高级货币强度值,货币运动速度和28个外汇对在所有(9)时间段的信号。想象一下,当你可以使用图表上的单一指标观察整个市场,以确定趋势和或剥头皮的机会时,你的交易将得到改善 我们已经在这个指标中建立了一些功能,使你更容易识别强势和弱势货币,同时识别和确认潜在的交易。该指标以图形方式显示货币的强势或弱势是增加还是减少,以及它在所有时间段的表现。 增加的新功能是动态市场斐波那契水平,它适应当前的市场条件变化,这是一个已经在我们的高级货币强度28和高级货币冲动指标中使用的成熟的加分项。 在交易时,总是将弱势货币和强势货币配对,这个新指标将帮助你做到这一点。 用户手册:点击这里  https://www.mql5.com/en/blogs/post/708783 特点  显示每个时间段的ACS28和GAP-speed(冲动)的货币强度值。 列:颜色代码以7种颜色显示货币强度:强势
Scalper Inside PRO
Alexey Minkov
4.76 (63)
!SPECIAL SALE! An exclusive indicator that utilizes an innovative algorithm to swiftly and accurately determine the market trend. The indicator automatically calculates opening, closing, and profit levels, providing detailed trading statistics. With these features, you can choose the most appropriate trading instrument for the current market conditions. Additionally, you can easily integrate your own arrow indicators into Scalper Inside Pro to quickly evaluate their statistics and profitability
Gold Stuff
Vasiliy Strukov
4.86 (257)
Gold Stuff 是专为黄金设计的趋势指标,也可用于任何金融工具。 该指标不会重绘,也不会滞后。 推荐时间框架 H1。 在它指标工作全自动专家顾问 EA Gold Stuff。 你可以在我的个人资料中找到它。 重要! 购买后立即与我联系,以获得说明和奖金!   您可以免费收到我们的强力支持和趋势扫描指标的副本,请私信。大部头书! 购买后立即联系我以获得设置和个人奖励!   设置 绘制箭头 - 打开关闭。 在图表上绘制箭头。 警报 - 打开关闭声音警报。 电子邮件通知 - 打开关闭。 电子邮件通知。 Puch-notification - 打开关闭。 推送通知。 接下来,调整色域。 Gold Stuff 是专为黄金设计的趋势指标,也可用于任何金融工具。 该指标不会重绘,也不会滞后。 推荐时间框架 H1。 在它指标工作全自动专家顾问 EA Gold Stuff。 你可以在我的个人资料中找到它。 购买后立即联系我以获得设置和个人奖励!   设置 绘制箭头 - 打开关闭。 在图表上绘制箭头。 警报 - 打开关闭声音警报。 电子邮件通知 - 打开关闭。 电子邮件通知。 Puch
Algo Pumping MT4
Ihor Otkydach
5 (5)
PUMPING STATION – 您的专属“全包式”交易策略 我们为您推出PUMPING STATION —— 一款革命性的外汇指标,它将使您的交易变得更加有趣且高效。这不仅仅是一个辅助工具,而是一套完整的交易系统,具备强大的算法,帮助您开始更加稳定的交易。 购买本产品,您将免费获得: 专属设置文件:用于自动配置,实现最大化性能。 逐步视频教程:学习如何使用PUMPING STATION策略进行交易。 Pumping Utility:专为PUMPING STATION打造的半自动交易机器人,让交易变得更加方便和简单。 购买后请立即联系我,我将为您提供所有额外资源的访问权限。 PUMPING STATION如何工作: 趋势监控:能够即时识别市场趋势方向。趋势是您最好的朋友。 进场信号:图表上的箭头会提示您何时进场以及交易方向。 明确的交易目标:指标会自动识别最佳的平仓时机。 回调交易:内置的基于布林带的价格通道可检测修正结束并发出新趋势开始的信号。 效率分析:如果当前设置效果较差,系统会自动提示。只需调整PUMPING STATION,即可获得最佳性能。 功能强大: 推送和邮件通知:即
Golden Trend Indicator
Noha Mohamed Fathy Younes Badr
5 (10)
Golden Trend indicator  is The best indicator for predicting trend movement this indicator never lags and never repaints and never back paints    and give  arrow buy and sell    before the candle appear  and it will help you and  will make your trading decisions clearer its work on all currencies and  gold and crypto and all time frame This unique  indicator uses very secret algorithms to catch the  trends, so you can trade using this indicator and see the trend clear on charts  manual guide and
M1 Arrow
Oleg Rodin
5 (17)
M1 Arrow - 基于市场的两个基本原则的盘中策略。 该算法基于使用附加过滤器对交易量和价格波动的分析。该指标的智能算法仅在两个市场因素合二为一时才会发出信号。该指标使用较高时间框架的数据计算 M1 图表上某个范围的波浪。为了确认波浪,该指标使用了成交量分析。 从理论上讲,该指标可以与其他时间框架一起使用,但您需要考虑到该指标最初是为在 M1 上交易而开发的这一事实。 该指标是一个现成的交易系统。交易者所需要的只是跟随信号。此外,该指标可以成为您自己的交易系统的基础。交易仅在分钟图表上进行。 尽管指标使用 MTF 原理,但指标算法尽可能稳定。 购买后,一定要写信给我!我将与您分享我的交易设置和建议!祝您交易成功!感谢您的关注!
Trend Screener
STE S.S.COMPANY
4.78 (93)
趋势指标,趋势交易和过滤的突破性独特解决方案,所有重要趋势功能都内置在一个工具中! 它是 100% 非重绘多时间框架和多货币指标,可用于所有符号/工具:外汇、商品、加密货币、指数、股票。 限时优惠:支撑和阻力筛选指标仅售 50美元,终身有效。(原价 250 美元)(优惠延长) 趋势筛选器是有效的指标趋势跟踪指标,它在图表中提供带有点的箭头趋势信号。 趋势分析器指标中可用的功能: 1.趋势扫描仪。 2. 具有最大利润分析的趋势线。 3.趋势货币强度计。 4. 带有警报的趋势反转点。 5. 带有警报的强趋势点。 6. 趋势箭头 每日分析示例,每日信号表现...等与我们的趋势筛选指标,可以在这里找到: 点击这里 限时优惠:Trend Screener Indicator 仅售 50 美元且终身可用。原价 125$) 通过访问我们的 MQL5 博客,您可以找到我们所有的高级指标以及分析示例、每日信号表现...等。 : 点击这里 我们的趋势系统由 2 个指标组成: 1. Trend Screener Indicator:显示趋势仪表盘、图表中的趋势线、入场点...等。 2. Trend
GOLD Impulse with Alert
Bernhard Schweigert
4.6 (10)
这个指标是我们2个产品 Advanced Currency IMPULSE with ALERT  +   Currency Strength Exotics 的一个超级组合。 它适用于所有时间框架,并以图形方式显示8种主要货币和一种符号的强势或弱势冲动! 该指标专门用于显示任何符号的货币强度加速,如黄金、异国货币对、商品、指数或期货。这是它的第一个指标,任何符号都可以被添加到第9行,以显示黄金、白银、石油、DAX、US30、MXN、TRY、CNH等的真实货币强度加速(冲动或速度)。 建立在新的基础算法上,它使识别和确认潜在的交易更加容易。这是因为它以图形方式显示了一种货币的强势或弱势是否正在加速,并测量了这种加速的速度--把它想象成你汽车中的速度表。当你加速时,事情显然会发生得更快,这在外汇市场上也是一样的,即如果你配对的货币正在向相反的方向加速,你就会发现一个潜在的有利可图的交易。 动态市场斐波那契28水平被用作警报触发器,将适应市场活动。如果冲动击中黄色触发线,你将收到警报。然后你就知道作为一个交易员应该做什么。货币对和方向已经给出。只需点击警报按钮,就可以切换到该货
Enigmera
Ivan Stefanov
5 (7)
ENIGMERA: 市场的核心 重要提示:MQL5.com 演示版本在策略测试器中运行,可能无法完全反映 Enigmera 的功能。请查看描述、截图和视频了解详细信息。如有任何问题,请随时联系我! 该指标的代码已完全重写。版本 3.0 增加了新功能并修复了自指标发布以来积累的错误。 简介 这个指标和交易系统是金融市场的一种独特方法。ENIGMERA 使用分形周期来精确计算支撑和阻力水平。它展示了真实的积累阶段,并提供了方向和目标。无论是在趋势中还是在修正中,这个系统都能工作。 它是如何工作的 指标的大部分功能通过图表左侧的按钮控制,使得能够快速响应不同的市场情况。 按钮 ON/OFF – 显示或隐藏整个指标。 Channel – 激活支撑通道,显示可接受的偏差范围。 Dev1 (第一偏差) – 指示价格在支撑偏差内的波动,信号表示市场正在整合或积累力量。 Dev2 (第二偏差) – 显示价格在偏差之间的波动,表示趋势形成和方向。 Dev3 (第三偏差) – 表示趋势的显著加速和高波动性。 45deg (45度) – 显示市场的节奏和相对于 45 度线的运动稳定性。 Tgt1/2
PZ Harmonacci Patterns
PZ TRADING SLU
3.17 (6)
可以说,这是您可以为MetaTrader平台找到的最完整的谐波价格形成自动识别指标。它检测19种不同的模式,像您一样认真对待斐波那契投影,显示潜在的反转区域(PRZ),并找到合适的止损和获利水平。 [ 安装指南 | 更新指南 | 故障排除 | 常见问题 | 所有产品 ] 它检测19种不同的谐波价格形态 它绘制了主要,衍生和互补的斐波那契投影(PRZ) 它评估过去的价格走势并显示每个过去的形态 该指标分析其自身的质量和性能 它显示合适的止损和获利水平 它使用突破来表明合适的交易 它在图表上绘制所有样式比率 它实现了电子邮件/声音/视觉警报 受斯科特·M·卡尼(Scott M. Carney)的书的启发,该指标旨在满足最纯粹和最熟练的交易者的需求。但是,它采取了一种使交易更容易的方式:在向交易发出信号之前,它会等待Donchian朝正确方向突破,从而使交易信号非常可靠。 斐波那契投影与向量无关 它实现了电子邮件/声音/推送警报 它绘制了ABCD投影 重要提示: 为了符合 Scott M. Carney先生 的商标申诉,某些图案名称已重命名为不言自明的替代方式, Scott M.
TPSproTREND PrO
Roman Podpora
4.68 (25)
VERSION MT5        —        ИНСТРУКЦИЯ RUS           —        INSTRUCTIONS  ENG 主要功能: 准确的输入信号,无需渲染! 如果出现信号,它仍然相关!这是与重提指标的一个重要区别,重提指标可以提供信号然后改变信号,这可能导致存款资金的损失。现在您可以以更高的概率和准确度进入市场。还有一个功能是在箭头出现后为蜡烛着色,直到达到目标(止盈)或出现反转信号。 显示止损/获利区域 为了提高搜索切入点时的视觉清晰度,创建了一个模块,该模块最初显示买入/卖出区域,在该区域中搜索进入市场的最佳点。用于处理止损水平的附加智能逻辑有助于随着时间的推移减小其大小,从而降低进入交易(移动 sl)时的初始风险。 显示较高时间范围内的最小值/最大值(MTF 模式) 添加了一项功能,可以显示较高时间间隔的最小/最大校正位置,并显示趋势变化。此外,MIN/MAX 现在有编号,显示修正内容。 风险回报率 (RR) 使用指标算法,可以检测精确的入场点,平均风险回报比超过1k2。这也伴随着视觉效果,例如,收到信号后会出现蜡烛的彩色草图。 无论价
Easy Breakout
Mohamed Hassan
5 (11)
After your purchase, feel free to contact me for more details on how to receive a bonus indicator called VFI, which pairs perfectly with Easy Breakout for enhanced confluence!   Easy Breakout is a powerful price action trading system built on one of the most popular and widely trusted strategies among traders: the Breakout strategy ! This indicator delivers crystal-clear Buy and Sell signals based on breakouts from key support and resistance zones. Unlike typical breakout indicators, it levera
Dynamic Forex28 Navigator
Bernhard Schweigert
5 (5)
Dynamic Forex28 Navigator - 下一代外汇交易工具。 当前 49% 折扣。 Dynamic Forex28 Navigator 是我们长期流行的指标的演变,将三种功能合二为一: 高级货币强度 28 指标 (695 条评论)+ 高级货币 IMPULSE 带警报 (520 条评论)+ CS28 组合信号(奖励)。 有关指标的详细信息 https://www.mql5.com/en/blogs/post/758844 下一代强度指标提供什么? 您喜欢的原始指标的一切,现在通过新功能和更高的精度进行了增强。 主要特点: 专有货币强度公式。  所有时间范围内的平滑和准确的强度线。 非常适合识别趋势和精确进入。 动态市场斐波那契水平(市场斐波那契)。  此指标独有的独特功能。 斐波那契应用于货币强度,而不是价格图表。 适应实时市场活动以获得准确的反转区域。 实时市场动量。  第 9 行显示市场是活跃还是被动。 对于定时交易至关重要。 全面的警报和显示。  每种货币最强的买入和卖出动量。 ​​28 对的双重动量买入和卖出。 超买/超卖警告外部范围和止损。 反转
IX Power MT4
Daniel Stein
4.78 (9)
IX Power:解锁指数、大宗商品、加密货币和外汇市场洞察 概述 IX Power 是一款多功能工具,可分析指数、大宗商品、加密货币和外汇市场的强弱表现。 FX Power 提供针对货币对的最高精度,利用所有可用货币对数据进行分析,而 IX Power 专注于基础资产的市场数据。这使得 IX Power 成为非外汇市场的理想选择,同时在需要简单外汇分析时也非常可靠。它可以无缝适用于任何图表,提供清晰的、有行动价值的洞察,帮助提升您的交易决策。 1. 为什么 IX Power 对交易者非常有价值 多市场强弱分析 • IX Power 分析指数、大宗商品、加密货币和外汇市场的强弱表现,为每个市场提供量身定制的洞察。 • 监控 US30、WTI、黄金、比特币等资产的表现,发现交易机会。 适用于更广泛的市场 • 对于外汇交易, FX Power 提供无与伦比的精度,通过分析所有相关货币对。 • IX Power 专注于基础资产的市场数据,非常适合非外汇市场及简化的外汇分析。 实时适应性 • 借助自适应算法, IX Power 实时响应市场数据变化,保持分析的最新性。 • 实时更新
Stratos Pali
Michela Russo
5 (2)
Stratos Pali Indicator   is a revolutionary tool designed to enhance your trading strategy by accurately identifying market trends. This sophisticated indicator uses a unique algorithm to generate a complete histogram, which records when the trend is Long or Short. When a trend reversal occurs, an arrow appears, indicating the new direction of the trend. Important Information Revealed Leave a review and contact me via mql5 message to receive My Top 5 set files for Stratos Pali at no cost! Dow
Scalper Vault
Oleg Rodin
5 (29)
Scalper Vault 是一个专业的剥头皮系统,为您提供成功剥头皮所需的一切。该指标是一个完整的交易系统,可供外汇和二元期权交易者使用。推荐的时间范围是 M5。 该系统为您提供趋势方向的准确箭头信号。它还为您提供顶部和底部信号以及江恩市场水平。无论您拥有何种交易经验,该系统都易于使用。您只需要遵循简单的规则并每天重复该过程。 建议将此系统用于主要货币对。感谢您的关注! 请注意,该指标在策略测试器中可能无法正常工作。因此,我建议仅在模拟或真实账户的真实交易条件下使用该系统。 指示器提供所有类型的警报,包括推送通知。 购买指标后请与我联系。我将免费与您分享我的个人交易建议和出色的奖励指标! 祝您交易愉快,盈利!
RelicusRoad Pro
Relicus LLC
4.63 (104)
RelicusRoad 用户手册 + 培训视频 + 访问 Private Discord Group + VIP 身份 一种看待市场的新方式 RelicusRoad 是世界上最强大的外汇、期货、加密货币、股票和指数交易指标,为交易者提供保持盈利所需的所有信息和工具。我们提供技术分析和交易计划,帮助每一位交易者取得成功,从初学者到高级。它是一个关键的交易指标,可以提供足够的信息来预测未来的市场。我们相信一个完整的解决方案,而不是图表上几个没有意义的不同指标。这是一个多合一指标,显示无与伦比且非常准确的信号、箭头 + 价格行为信息。 RelicusRoad 基于强大的人工智能,提供缺失的信息和工具来教育您并使您成为交易专家,成为成功的交易者。 几乎所有技术指标都滞后,这意味着它们只能报告已经发生的事情。因此,他们只确认您过去可以看到的价格已经在哪里。我们相信领先指标可以预测未来价格,而无需重新绘制,也不要过度依赖可能改变并导致重新绘制的滞后指标。如果您根据滞后指标进行交易并建立头寸,您就知道您已经大部分时间在赌博。我们相信,在您考虑建仓之前,您需要了解市场并了解价格变动的位置和原
- Real price is 80$ - 40% Discount (It is 49$ now) - Lifetime update free Contact me for instruction, add group and any questions! Related Products:  Bitcoin Expert , Gold Expert - Non-repaint - I just sell my products in Elif Kaya profile, any other websites are stolen old versions, So no any new updates or support. Introduction The breakout and retest strategy is traded support and resistance levels. it involves price breaking through a previous level.  The break and retest strategy is design
Advanced Supply Demand
Bernhard Schweigert
4.91 (294)
现在优惠 33%! 任何新手或专业交易者的最佳解决方案! 该指标是一款独特、高质量、且价格合理的交易工具,因为我们已经整合了许多专有功能和新公式。 依据此更新,您将能够显示双重时间帧区域。 您不仅可以显示一个较高的时间帧,还可以同时显示图表时间帧,加上更高的时间帧:显示嵌套时区。 供需双方所有交易者都会喜欢它。 :) 重要信息披露 高级供需的最大潜力,请访问 https://www.mql5.com/zh/blogs/post/720245   想象您的交易如何得以改善,是因为您能够精准定位入场或目标位吗? 构建于新的底层算法,它可以更轻松地识别出买卖双方之间的潜在失衡。 这是因为它以图形方式展示供需最强劲区域,及其过去的表现(显示旧区域)。 这些功能旨在帮助您更轻松地发现最佳入场区域和价位。 现在您可以针对您的交易品种和时间帧来优化和编辑区域强度! 高级供需指标适用于所有产品和时间帧。 它是一个新的公式,非常新的功能是两个区域强度函数可由用户输入进行调整! 这在交易中是一大优势。 当您学习如何使用专有功能,例如带有价格游离最小 X 因子的区域强度时,您能够判断该区域强劲与否。 供需
FX Power MT4 NG
Daniel Stein
4.94 (18)
FX Power:分析货币强度,助您做出更明智的交易决策 概述 FX Power 是一款专业工具,帮助您全面了解主要货币和黄金在任何市场条件下的真实强度。通过识别强势货币用于买入,弱势货币用于卖出, FX Power 简化了交易决策,并帮助您发现高概率的交易机会。不论您是想跟随趋势还是通过极端的 Delta 值预测反转,这款工具都能完美适应您的交易风格。别再盲目交易——用 FX Power 让您的交易更加智慧。 1. 为什么 FX Power 对交易者极具价值 实时货币和黄金强度分析 • FX Power 实时计算并显示主要货币和黄金的相对强度,助您全面了解市场动态。 • 监控领先或落后资产,轻松识别值得交易的货币对。 全面的多时间框架视图 • 跟踪短期、中期和长期时间框架的货币和黄金强度,以便将您的交易策略与市场趋势保持一致。 • 无论是快进快出的短线交易还是更长期的投资策略, FX Power 都能为您提供所需的信息。 Delta 动态分析用于趋势和反转 • 极端 Delta 值常常预示反转机会,而平缓的 Delta 变化则确认趋势延续。 • 使用 Delta 分析,轻
KT Renko Patterns MT4
KEENBASE SOFTWARE SOLUTIONS
2.33 (3)
KT Renko Patterns 会逐砖扫描整个 Renko 图表,寻找那些在各种金融市场中被交易者频繁使用的著名图表形态。 与基于时间的图表相比,Renko 图由于其简洁清晰的特性,更容易识别图表形态,尤其适合基于形态的交易策略。 KT Renko Patterns 包含多种常见的 Renko 图形模式,其中许多都在 Prashant Shah 所著的《用 Renko 图表实现盈利交易》一书中有详细说明。 基于 KT Renko Patterns 指标开发的 100% 自动交易EA已发布,点击这里了解 - KT Renko Patterns EA 。 特点 可交易多达八种清晰明确的 Renko 图形模式,无任何模糊。 每种模式都配有止损位和斐波那契目标位,确保交易策略客观明确。 KT Renko Patterns 实时监测每种模式的准确率,并将关键统计信息显示在图表上。 当 Renko 砖块发生反转时会自动标记并提醒,有助于在行情突变时提前计划退出。 已识别的图形不会重绘或重新绘制,信号稳定可靠。 包含的图形模式 W-M 形态 强势旗形 AB=CD 形态 三顶/三底 双顶
Quantum Breakout Indicator PRO
Bogdan Ion Puscasu
4.96 (26)
介绍     Quantum Breakout PRO   ,突破性的 MQL5 指标,正在改变您交易突破区域的方式!   Quantum Breakout PRO 由拥有超过 13 年交易经验的经验丰富的交易者团队开发,旨在通过其创新和动态的突破区域策略将您的交易之旅推向新的高度。 量子突破指标将为您提供带有 5 个利润目标区域的突破区域的信号箭头,以及基于突破框的止损建议。 它既适合新手交易者,也适合专业交易者。 量子 EA 通道:       点击这里 MT5版本:   点击这里 重要的!购买后请私信我领取安装手册。 建议: 时间范围:M15 货币对:GBPJPY、EURJPY、USDJPY、NZDUSD、XAUUSD 账户类型:ECN、Raw 或 Razor,点差极低 经纪商时间:GMT +3 经纪商:IC Markets、Pepperstone with Raw 和 Razor 的点差最低 规格: 不重漆! 最多 5 个建议利润目标区域 建议止损水平 可定制的盒子。您可以设置自己的 Box Time Start 和 Box Time End。 接触 如果您
MTF Supply Demand Zones
Georgios Kalomoiropoulos
4.82 (22)
下一代自动化供需区。适用于任何图表的创新算法。所有区域都是根据市场的价格行为动态创建的。 两种类型的警报 --> 1) 当价格触及区域时 2) 当新区域形成时 你不会再得到一个无用的指标。您将获得一个完整的交易策略和经过验证的结果。     新的功能:     价格触及供需区时发出警报     创建新的供应/需求区时发出警报     推送通知警报     以点为单位的区域宽度标签     关于 MTF 的又一个时间表。因此,现在您将能够看到高于当前 3 个时间帧,而不是高于当前 2 个时间帧     启用/禁用警报/区域/MTF 功能的按钮 您获得的优势:     消除交易中的情绪。     客观化您的交易条目。     通过高概率设置提高您的利润。     节省绘图区域的时间。     像专业人士一样交易金融市场。     任何市场的即时多时间框架分析。 你在图表上看到了什么?     蓝色和红色矩形是当前时间范围的供需区。     虚线样式线是当前上方第一个时间范围内的供需区域。     实线样式线是当前上方第二个时间范围内的
Chart Patterns All in One
Davit Beridze
4.68 (19)
以演示模式试用 "Chart Patterns All in One" 并获得奖励。试用后,请发送消息给我以领取奖励。 购买后留言即可获得8个高质量的指标作为赠品。 Chart Patterns All-in-One 指标帮助交易者可视化技术分析中常用的各种图表形态。它帮助识别潜在的市场行为,但不保证盈利。建议在购买前在模拟模式下测试该指标。 当前优惠 : “Chart Patterns All in One” 指标享受 50% 折扣。 包含的形态 : 1-2-3 形态 :通过三个关键点(高点或低点)检测市场反转。 买入 :连续两个低点后出现较低的高点。 卖出 :连续两个高点后出现较高的低点。 可视化 :线条和箭头连接识别的点。 双顶和双底 :当价格形成两个连续的高点(双顶)或低点(双底)且它们大致相等时,表明反转趋势。 双顶 :看跌反转。 双底 :看涨反转。 可视化 :线条连接峰值或低谷,箭头标记反转点。 三顶和三底 :与双顶/双底类似,但有三个连续的高点或低点,信号更强的反转趋势。 三顶 :看跌反转。 三底 :看涨反转。 可视化 :线条和箭头标记形态。 三角形 :在趋势延续前识别
Matrix Arrow Indicator MT4
Juvenille Emperor Limited
5 (3)
矩阵箭头指标 MT4 是一种独特的 10 合 1 趋势,遵循 100% 非重绘多时间框架指标 ,可用于所有符号/工具:外汇、商品、加密货币、指数、股票。  Matrix Arrow Indicator MT4 将在其早期阶段确定当前趋势,从多达 10 个标准指标中收集信息和数据,它们是: 平均定向运动指数 (ADX) 商品渠道指数 (CCI) 经典 Heiken Ashi 蜡烛 移动平均线 移动平均收敛散度 (MACD) 相对活力指数 (RVI) 相对强弱指数 (RSI) 抛物线SAR 随机振荡器 威廉姆斯的百分比范围 当所有指标给出有效的买入或卖出信号时,相应的箭头将打印在图表上,在下一根蜡烛/柱线开盘时,指示强劲的上升趋势/下降趋势。用户可以选择使用哪些指标,并可以单独调整每个指标的参数。 Matrix Arrow Indicator MT4 仅从选定的指标中收集信息,并仅根据其数据打印箭头。 Matrix Arrow Indicator MT4 还可以为所有新信号发送终端、推送通知或电子邮件警报。无论您是黄牛、日内交易者还是波段交易者, Matrix Arrow Indicat
Reversal Master
Alexey Minkov
4.92 (13)
!SPECIAL SALE! The Reversal Master is an indicator for determining the current direction of price movement and reversal points. The indicator will be useful for those who want to see the current market situation better. The indicator can be used as an add-on for ready-made trading systems, or as an independent tool, or to develop your own trading systems. The Reversal Master indicator, to determine the reversal points,  analyzes a lot of conditions since the combined analysis gives a more accura
Apollo Secret Trend
Oleg Rodin
5 (6)
Apollo Secret Trend 是一个专业的趋势指标,可用于查找任何货币对和时间范围内的趋势。该指标可以轻松成为您的主要交易指标,无论您喜欢交易什么货币对或时间框架,您都可以使用它来检测市场趋势。通过在指标中使用特殊参数,您可以使信号适应您的个人交易风格。 该指标提供所有类型的警报,包括推送通知。指示器的信号不要重绘!在提供的屏幕截图中,您可以看到 Apollo Secret Trend 指标与超买/超卖振荡器指标相结合,我将完全免费为您提供。该交易系统可用于日间交易、剥头皮和长期交易。 购买后请联系我免费获得第二个超买超卖震荡指标!我还将为您提供有关如何使用该系统的说明。我还将与您分享丰厚的奖金! 祝您交易愉快,盈利!感谢您的关注!
FX Volume
Daniel Stein
4.6 (35)
FX Volume:从经纪商视角洞察真实市场情绪 简要概述 想要提升您的交易策略? FX Volume 可提供零售交易者和经纪商的持仓实时数据——远早于诸如 COT 之类的延迟报告。不论您希望获得持续稳定的收益,还是想在市场中多一分制胜的砝码, FX Volume 都能帮您识别重大失衡、确认突破以及完善风险管理。立即开启体验,让真实的成交量数据为您的交易决策带来革新! 1. 为什么 FX Volume 对交易者格外有用 极具准确度的早期预警 • 快速捕捉有多少交易者正在买入或卖出某个货币对——比大多数人提前一步。 • FX Volume 是 唯一 能够整合多家零售经纪商真实成交量数据并以简洁方式呈现的工具。 强力风险管理 • 及时识别多头或空头仓位的巨大不平衡,这往往预示着潜在的趋势反转,帮助您更自信地设置止损和目标位。 • 独家而真实的数据让每一次交易决策更具可靠性。 优化进场与出场点 • 发现“过度集中”的交易(大多数交易者都在同一方向),并通过真实成交量来确认突破。 • 避免依赖常见指标可能带来的误导信号,而是利用真实的实时成交量。 适配各种交易策略 • 将 FX
作者的更多信息
Title: 3 Trading Strategies to Exploit Market Structure (Without Overcomplicating It) Trading isn’t about predicting the future—it’s about spotting patterns, managing risk, and acting when odds favor you. Below are two timeless strategies (and one hybrid) that align with how markets   actually   move, not how we wish they would. Please ping me up for the strategy i have been using for last 8 years and the strategy that led me to leave my IT job. i am 100% sure that my strategy will blow your mi
GodMode
Rahul Shrikrishna Dani
This strategy allowed me to leave my IT job 5 years back. This strategy is the one that showed me profits in forex. I used it for 4 years. I had never spent a single week where i was not profitable. As profits allowed me to be part of some hidden traders communities, i found out strategies that are more accurate and have some great profit enhancing techniques. so i guess this is the time where i will share my old strategy that i used for 4 years that i had coded a long time ago and to this day
/* V2 of the Perfect structure.*/ Whats Inherited from v1? # This is the finest structure marking you will ever find in any market. # indicator is coded considering the actual structure any trader would use. # indicator is coded based on actual candle breaks and not coded based on any pivot or predefined values or specific number of candles high and low. # please check out the screenshot. # if you want me to fine tune it according to your needs then i am open for it. Whats new in V2? 1. AI bas
This is the finest structure marking you will ever find in any market. indicator is coded considering the actual structure any trader would use. indicator is coded based on actual candle breaks and not coded based on any pivot or predefined values or specific number of candles high and low. please check out the screenshot. if you want me to fine tune it according to your needs then i am open for it. IMPORTANT A demo version of an indicator cannot be run and seen on an online chart. Its behavior
Win big scalper v2
Rahul Shrikrishna Dani
Effective zone with added [Alerting system, visual trend reversal, pdf guide to gain edge]. 1. Follow Trend with swing breakout's, 2. Find zones in the correct direction 3. Use trender to enter and exit. what else? 1. Alerts are placed    (metatrader doesnt show alerts in strategy tester) 2. See higher timeframe zones in lower timeframe chart 3. A guide/manual (Check comments for manual) - 2 Entry modules that works with two different market conditions. - Multiple Concrete Exit methods that ar
Trade King v2
Rahul Shrikrishna Dani
Effective Trade system with added [Alerting system, visual trend reversal, pdf guide to gain edge]. 1. Follow Trend with swing breakout's (Simplified in provided manual), 2. Find zones in the correct direction 3. Use trender to enter, exit filter trades. what else? 1. Alert system is in place  (metatrader doesnt show alerts in strategy tester) 2. See higher timeframe entry/exit zones in lower timeframe chart 3. A guide/manual (Check comments for manual) - 2 Entry modules that works with two d
XMaster v2 denoised version
Rahul Shrikrishna Dani
The   X-master V2 Denoised Indicator   is a base original indicator with added multi layer filters to remove noise. This tool enhances the   ability   to identify both the   strength   and   direction   of a trend with greater accuracy. The   X-master   Metatrader 4 Indicator   provides   Entry Signals   for traders using   green   and   red arrows . 1. With easy sell and buy comes with alerting system that informs the user about the trend shift so user dont have to stick to the screen. 2. It wo
筛选:
无评论
回复评论