Anchored Linear Regression Channel
- 指标
- Jorge Adalberto Do Valle Junior
- 版本: 1.10
- 激活: 5
锚定线性回归通道(ALRC)
简介:
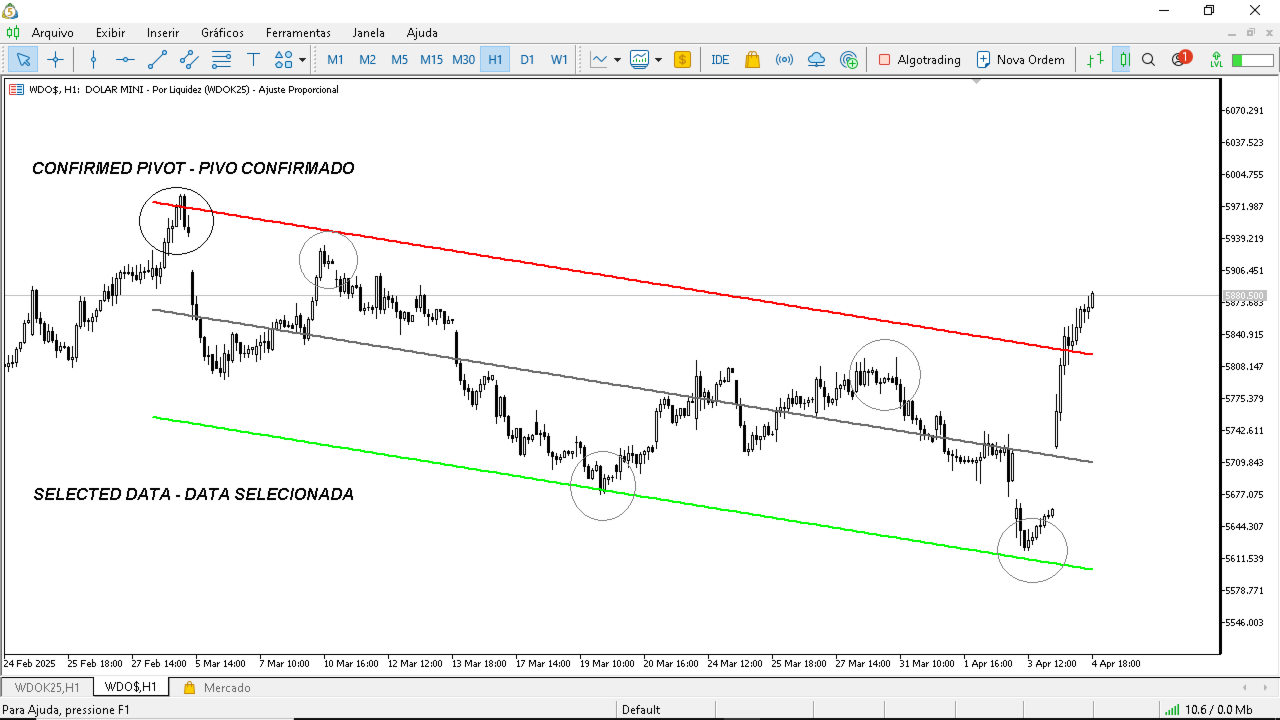
锚定线性回归通道(Anchored Linear Regression Channel,ALRC) 是一种先进的技术分析工具,它在传统线性回归通道的基础上进行了增强,允许用户将通道锚定在一个已确认的关键转折点(Pivot)。
这使得分析更加精确和可靠,能够更好地反映价格在图表关键结构点附近的行为。
主要特点:
锚定已确认的关键点: 手动选择图表中一个明确的、已形成的转折点作为起点,提升通道的有效性。
清晰的趋势可视化: 观察价格如何在锚定通道内运行,识别潜在的反转、突破或通道扩张。
高可靠性: 基于已验证的市场结构构建通道,使交易信号更稳健。
适用场景:
在通道内部识别动态的支撑和阻力区域
提前发现潜在的趋势反转信号
基于通道边界进行更有效的风险管理
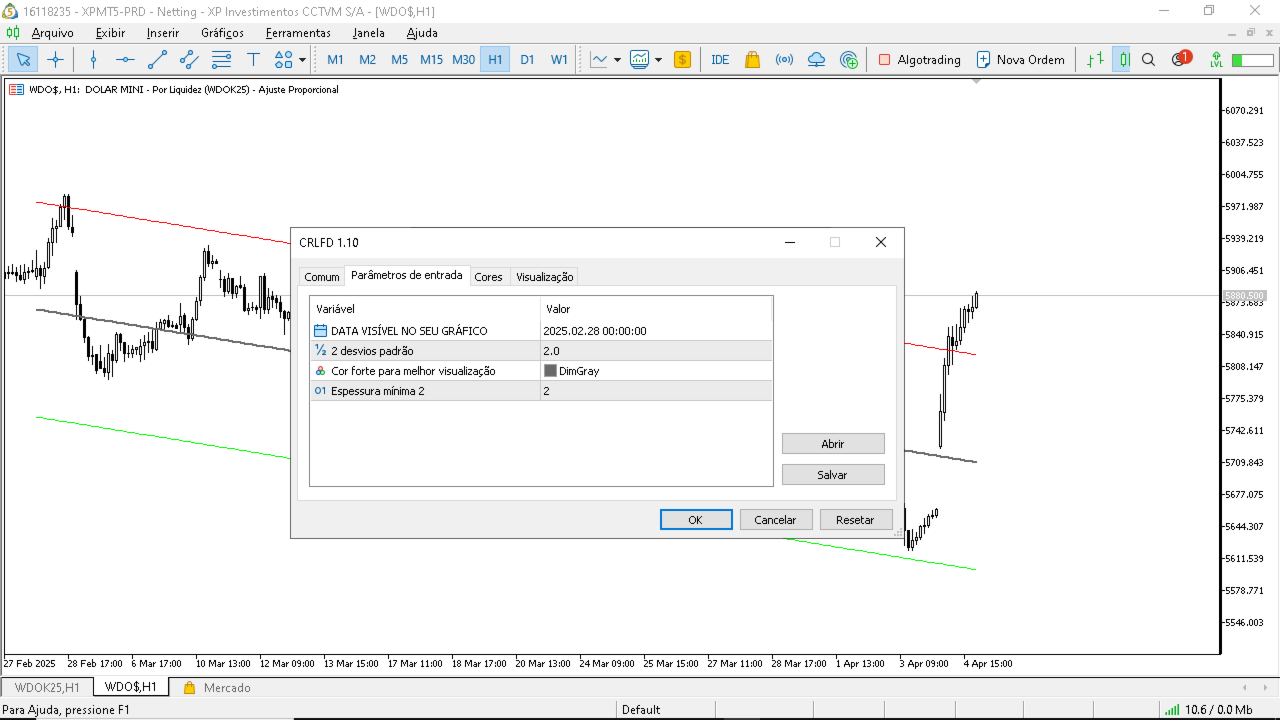
可自定义参数:
锚定点选择: 用户可自由选择图表中的关键枢纽点作为通道的起始点
回归周期: 设置用于回归计算的K线数量
通道偏差: 根据您的交易策略调整通道的宽度
注意事项:
本指标适用于 MetaTrader 5,并已在多种资产和不同周期下进行了广泛测试,以确保稳定性和性能。