WapPrag 4
- 指标
- Damian Blaha
- 版本: 1.5
- 更新: 7 四月 2025
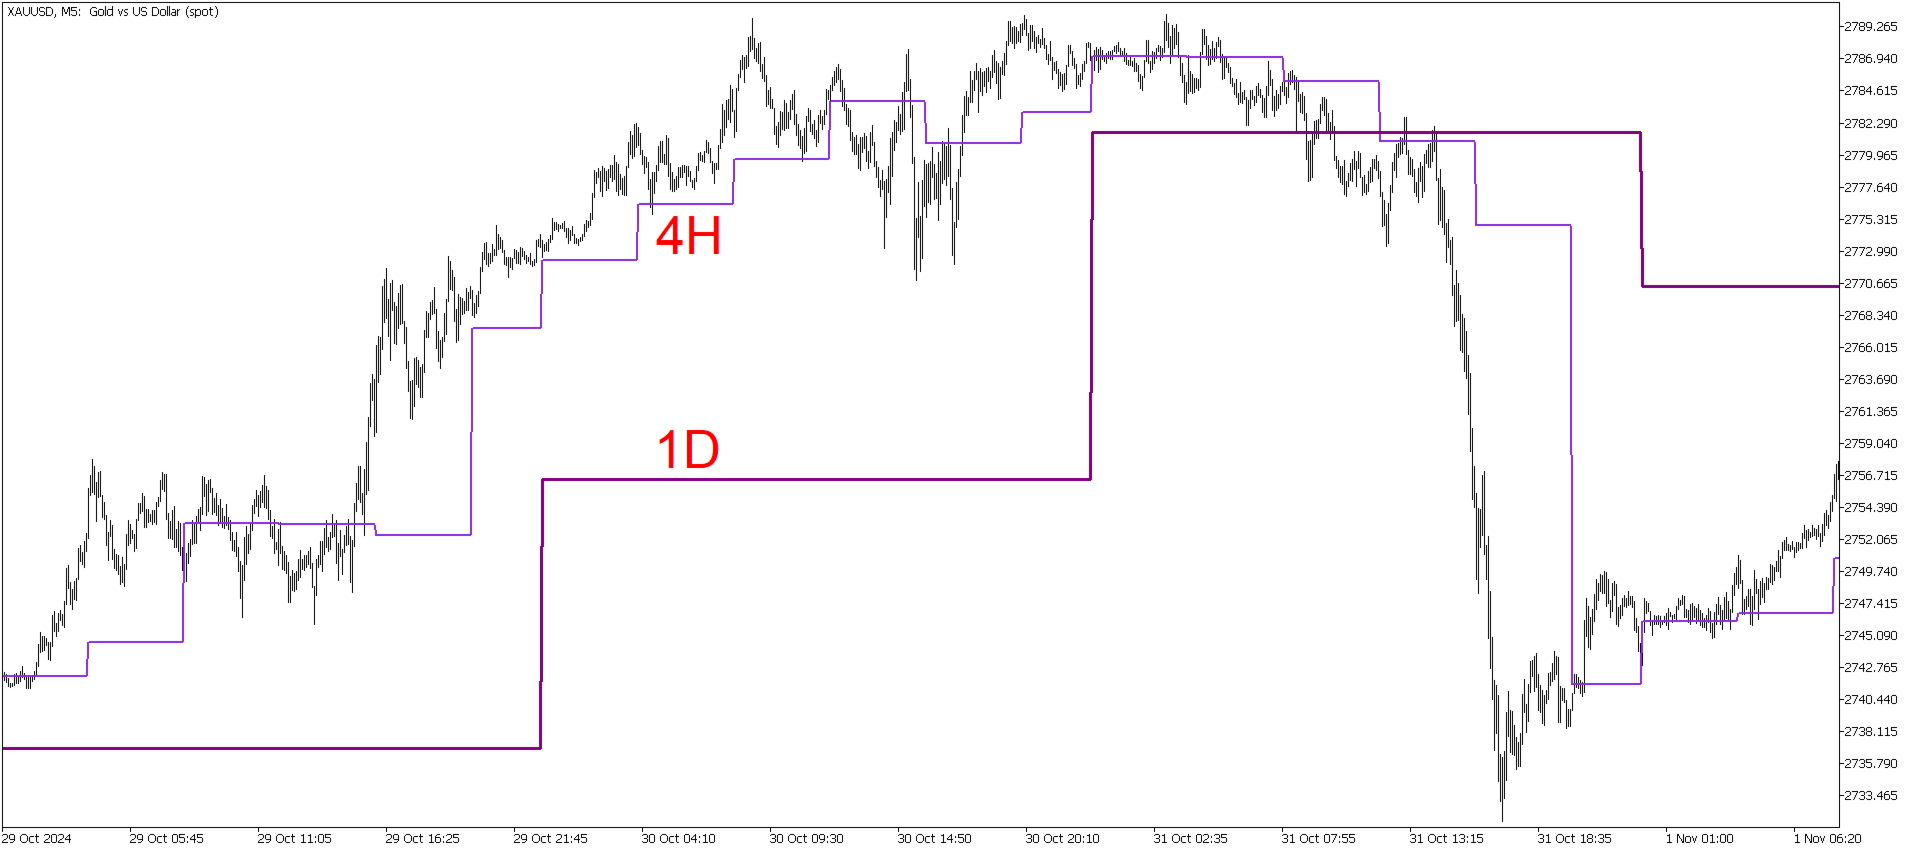
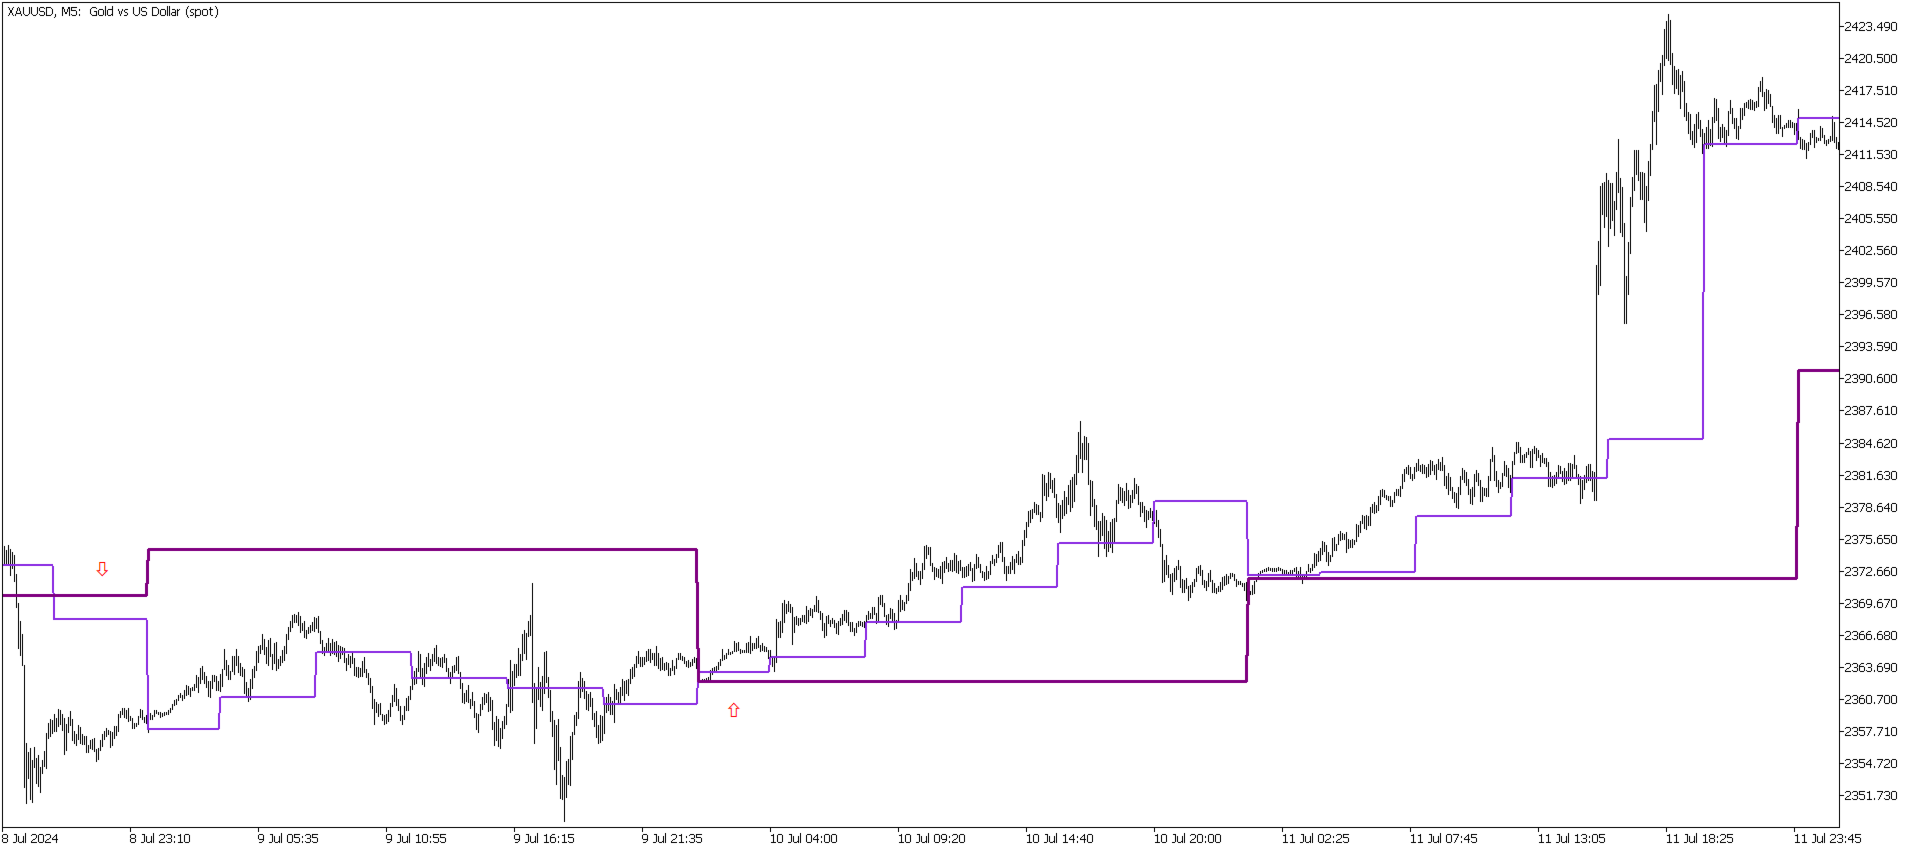
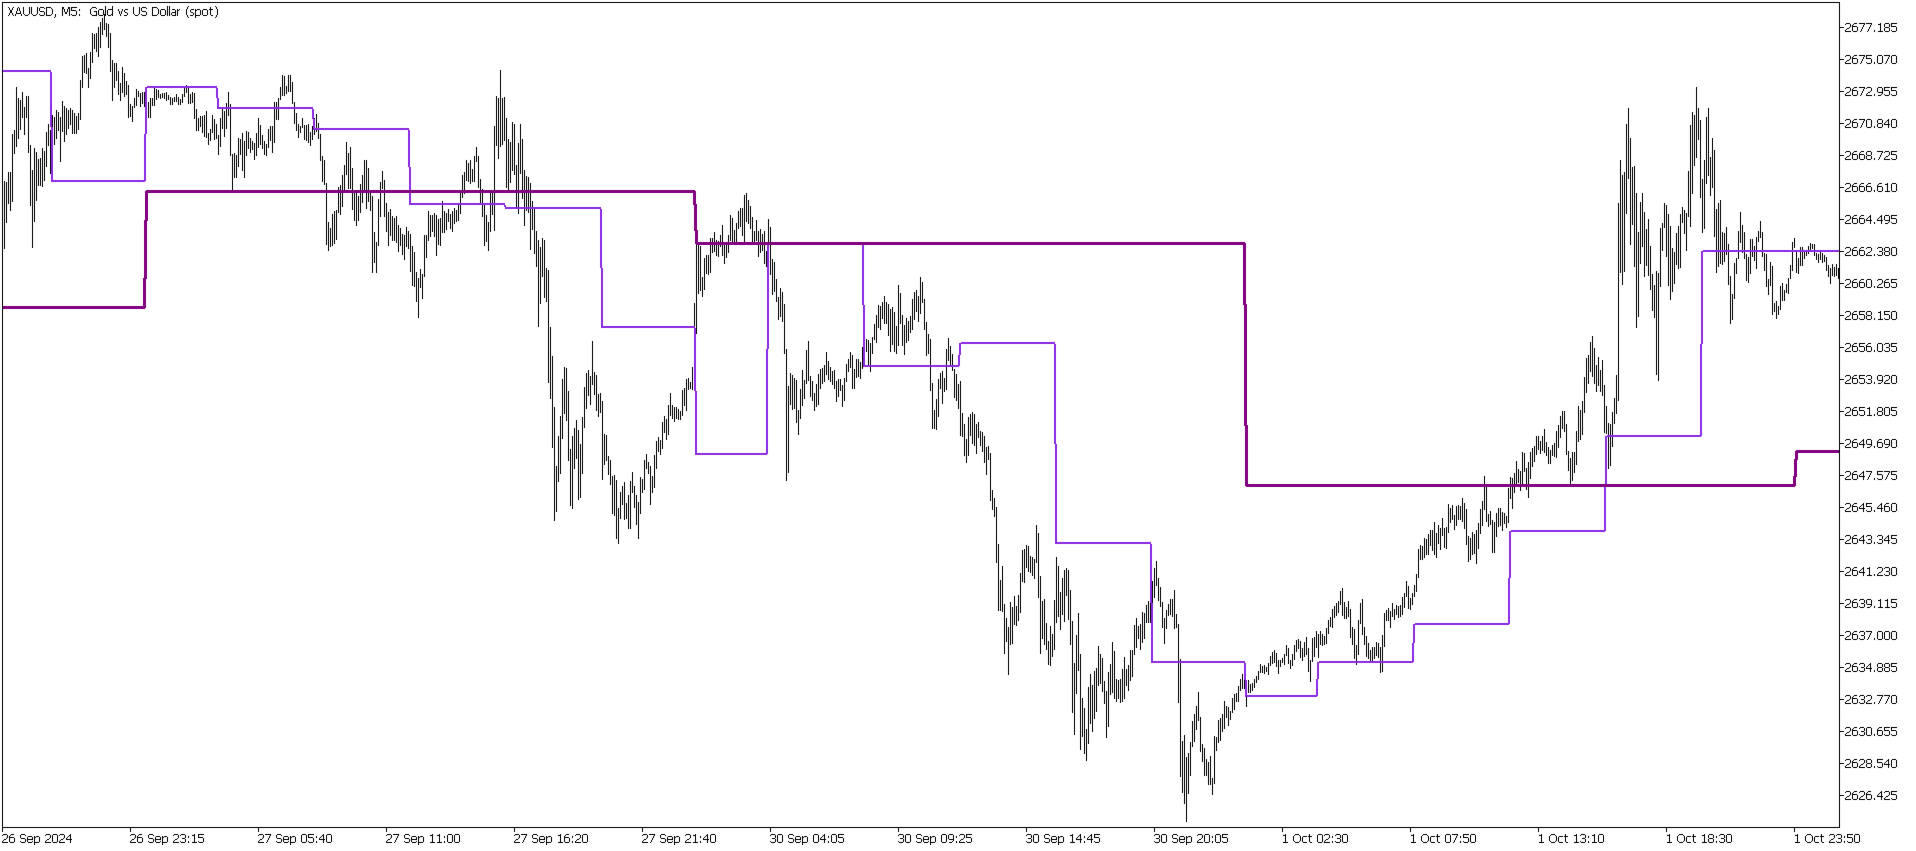
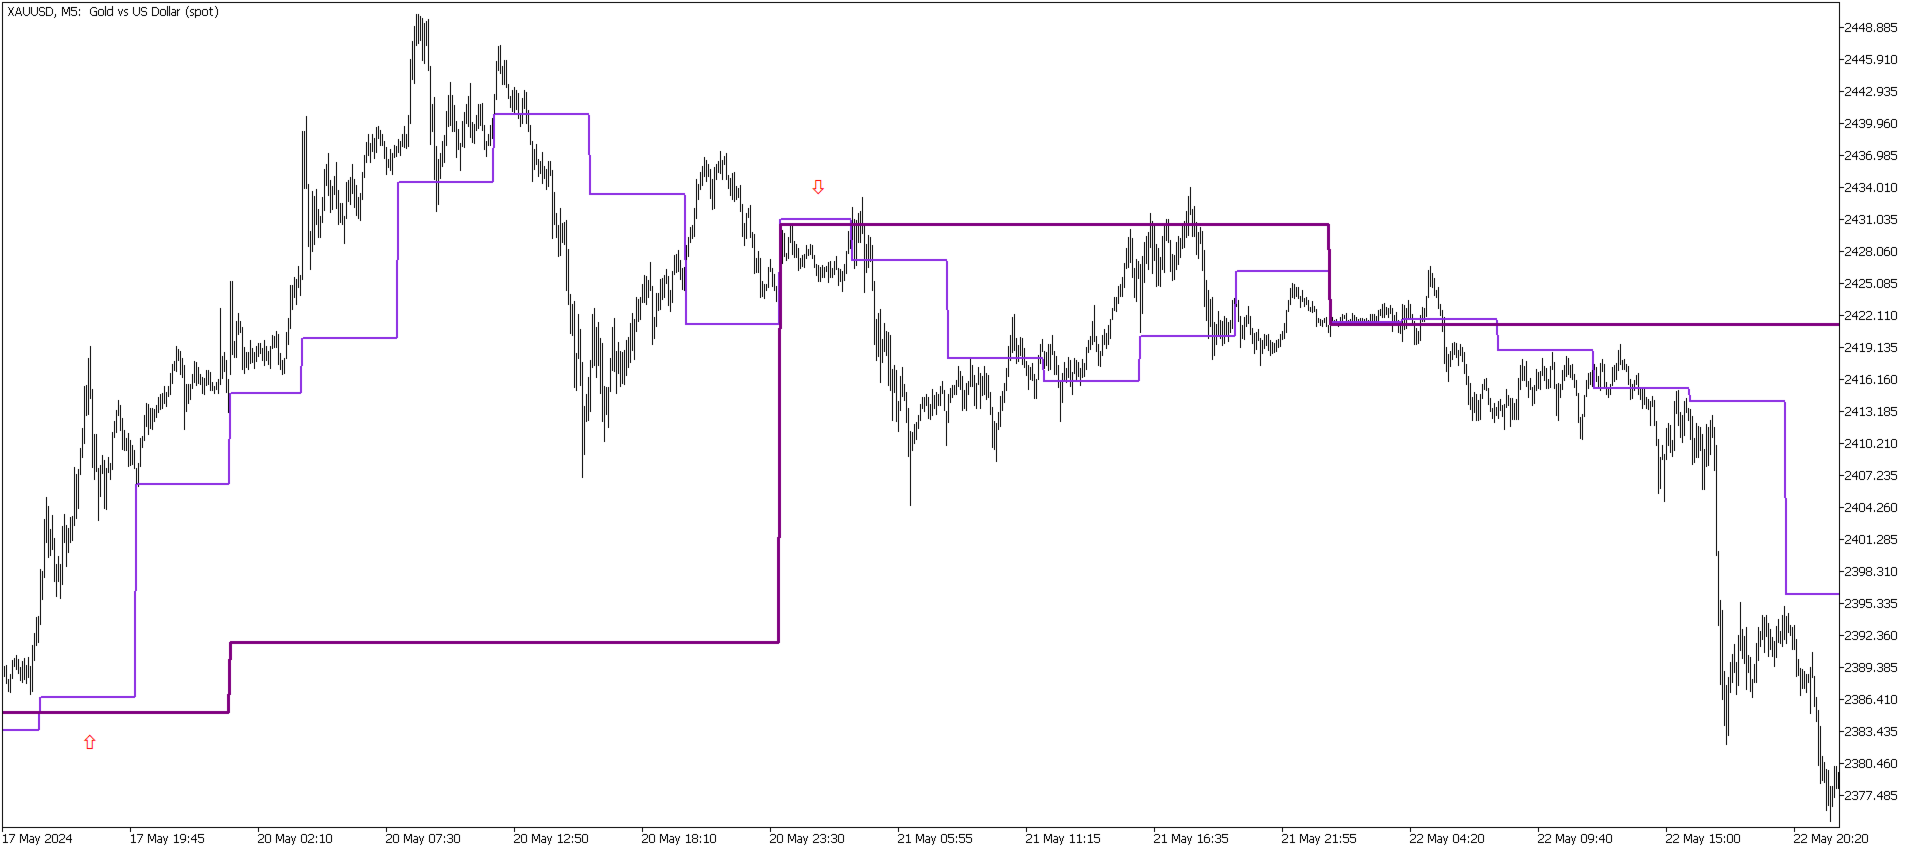
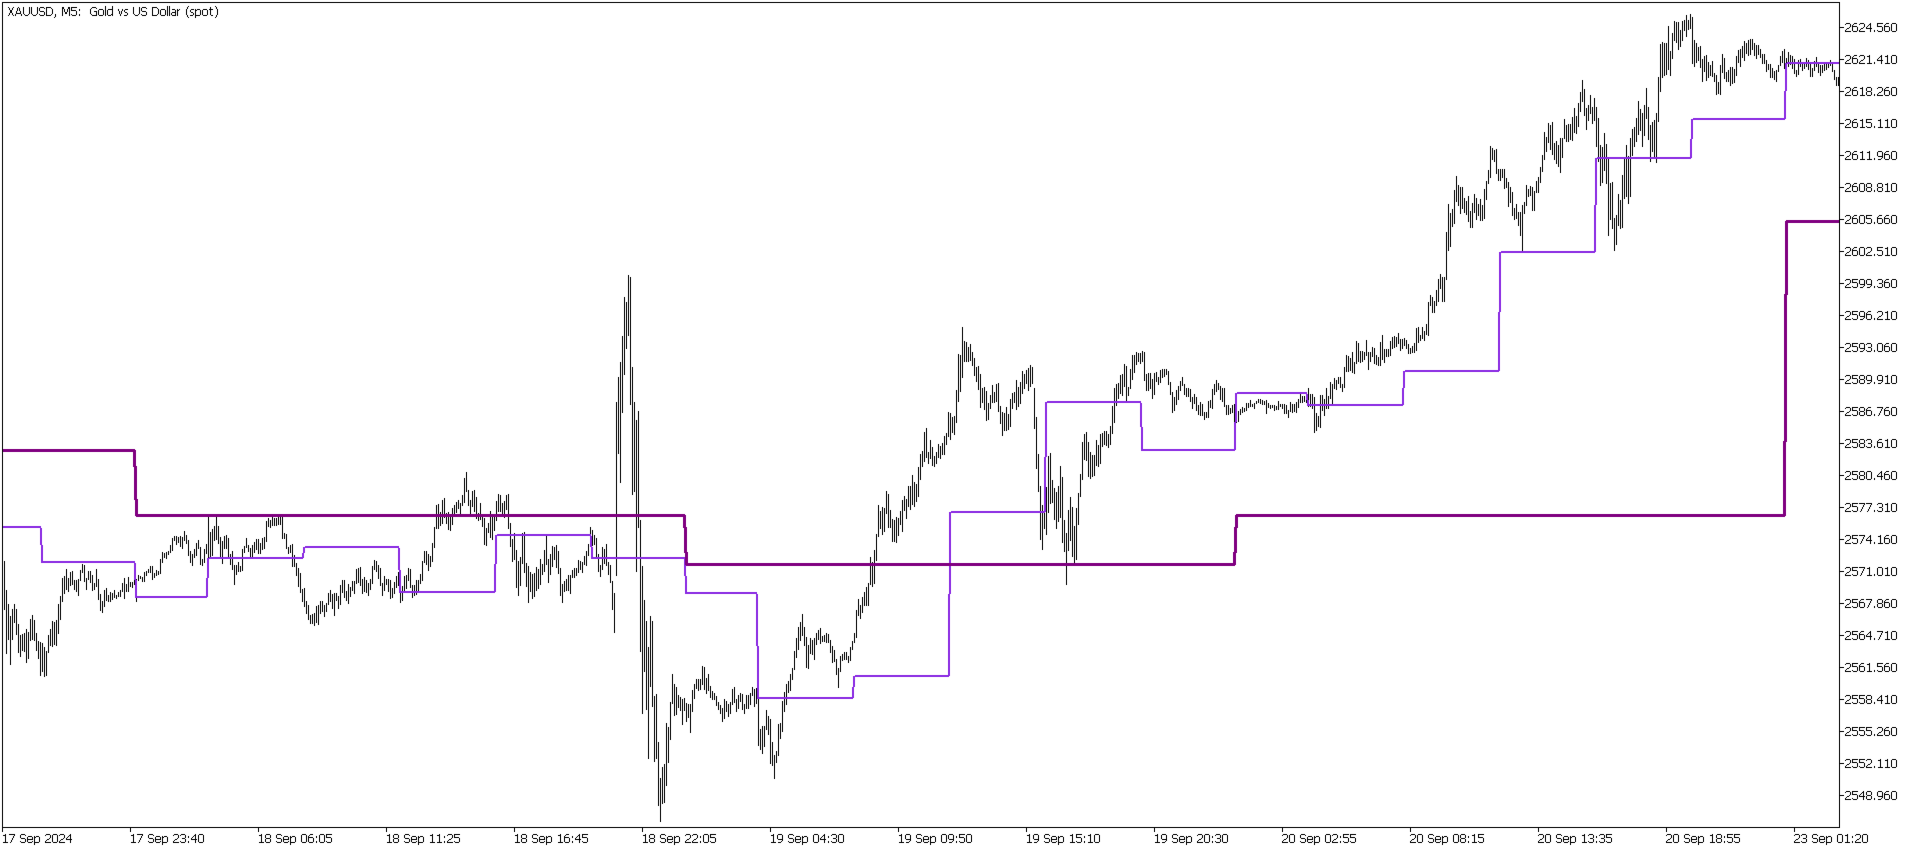
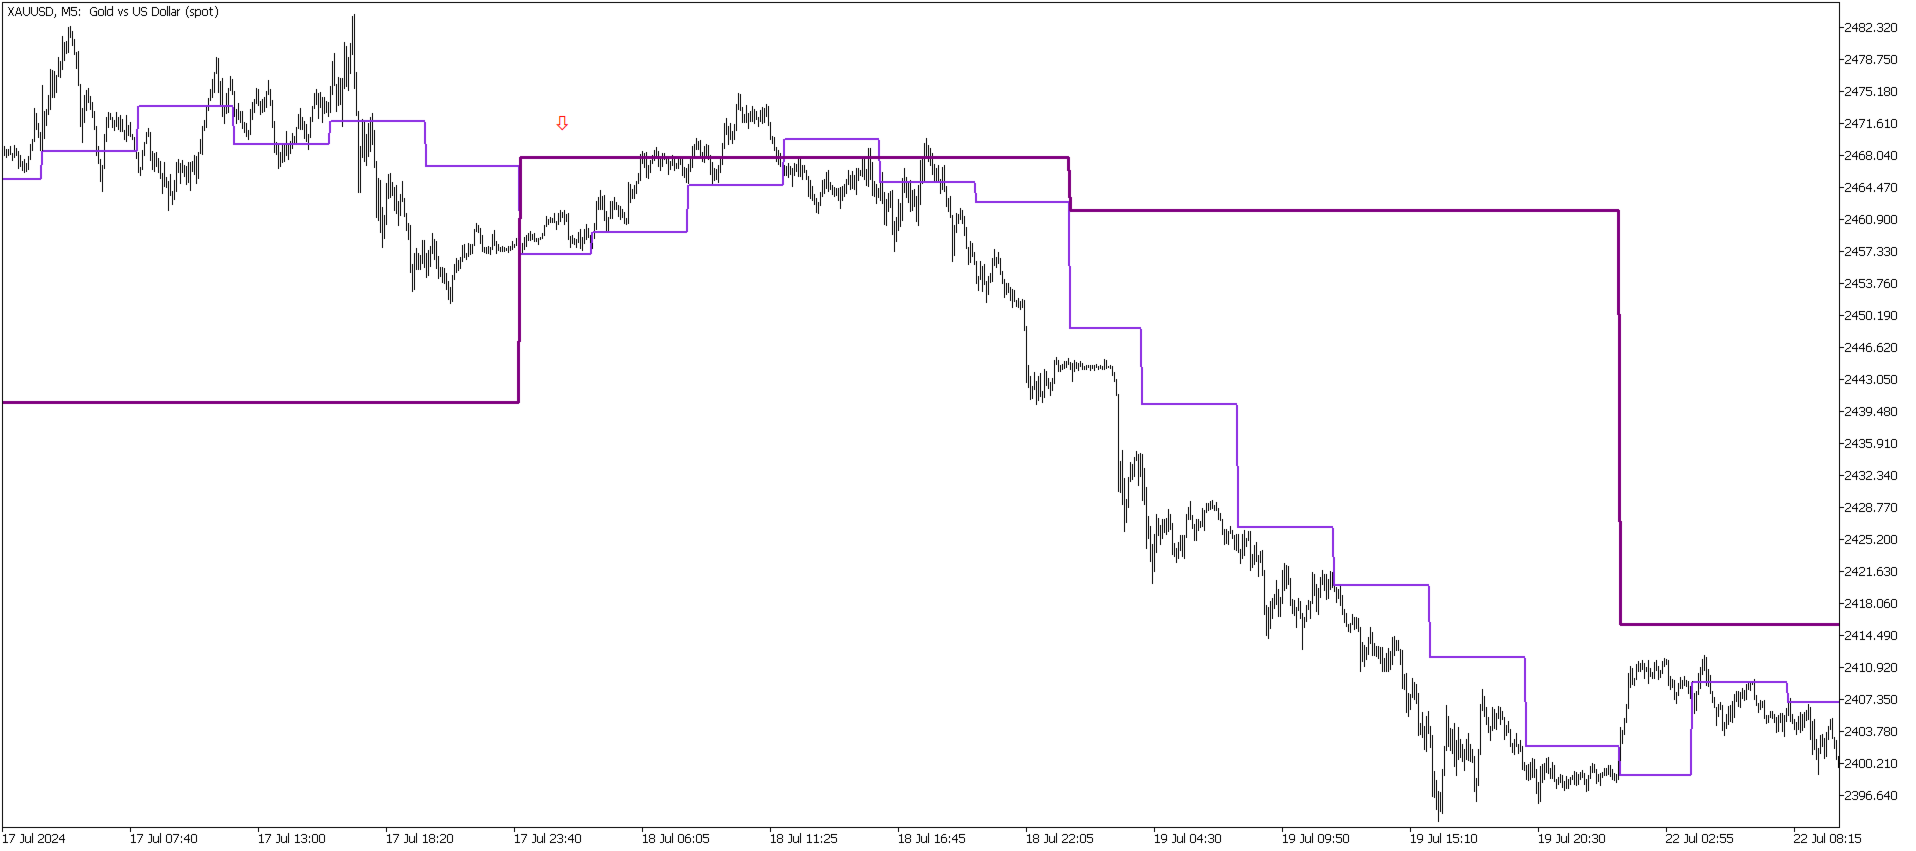
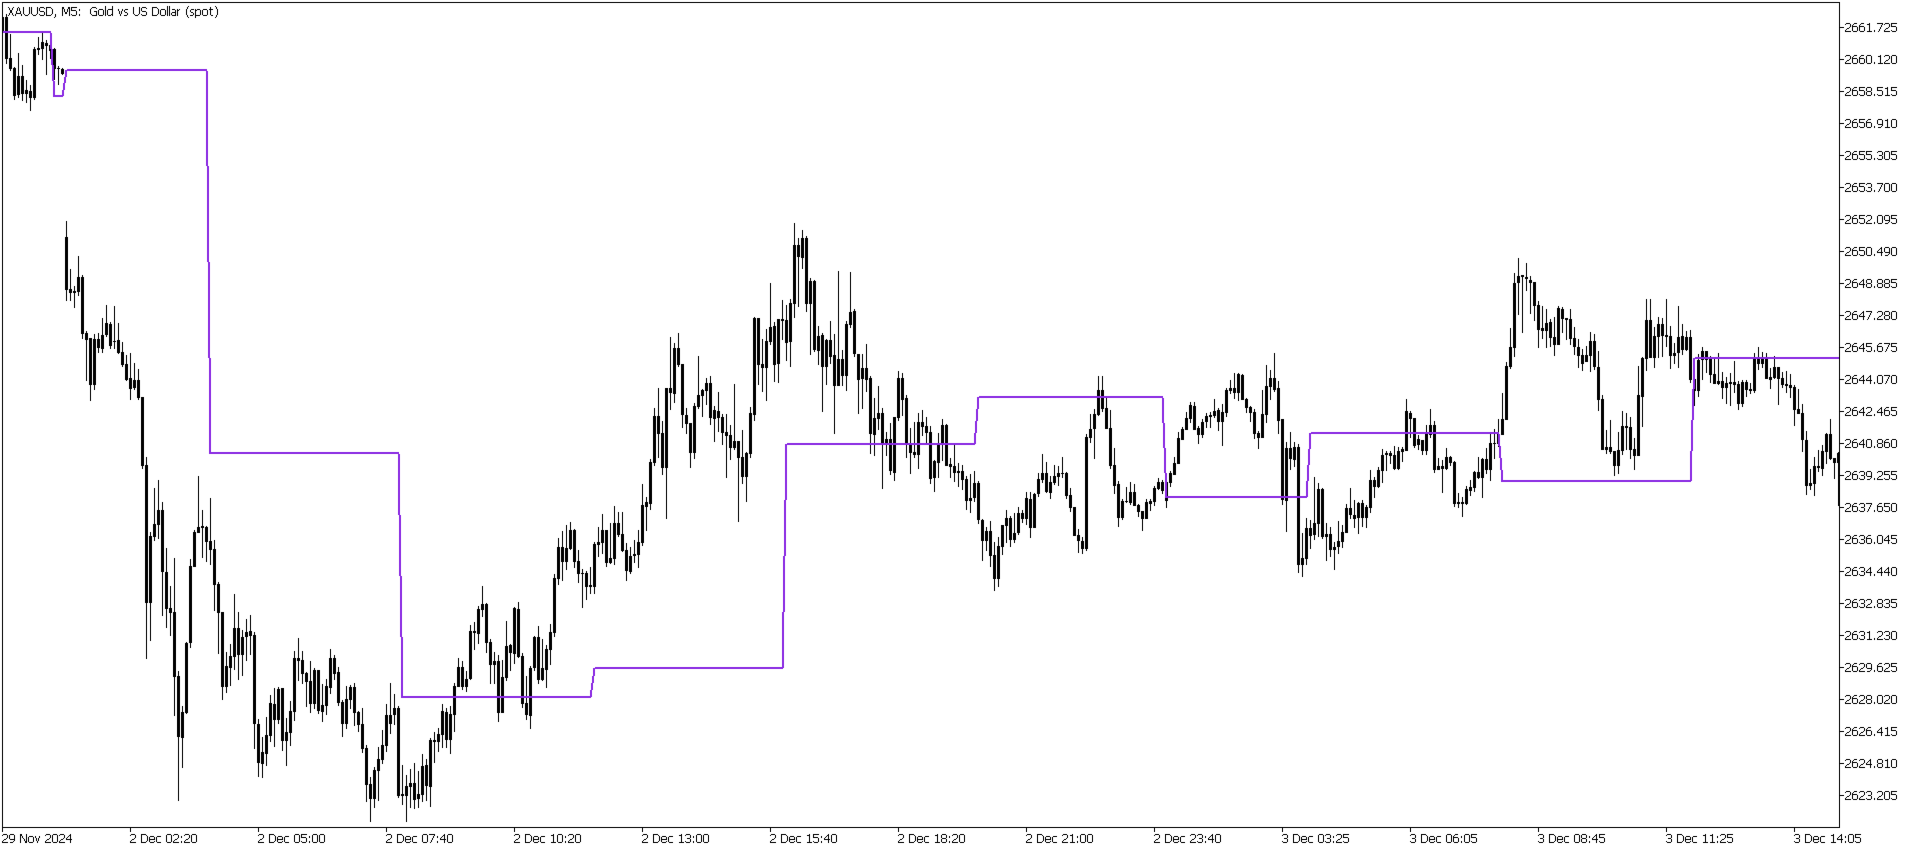
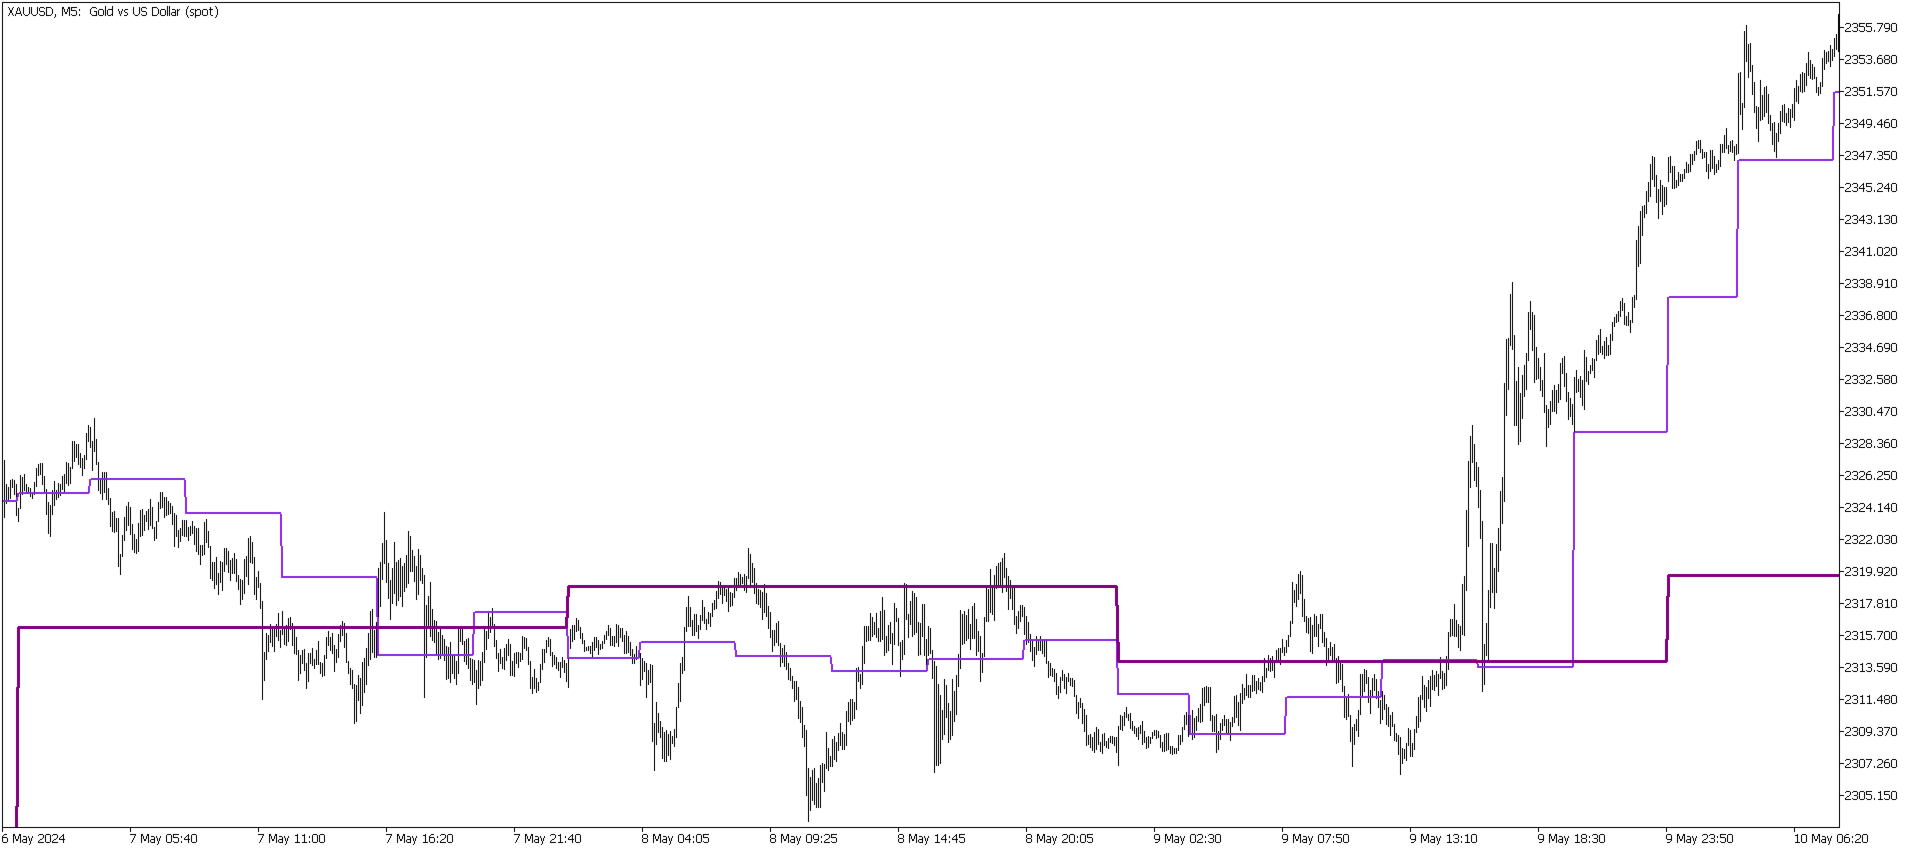
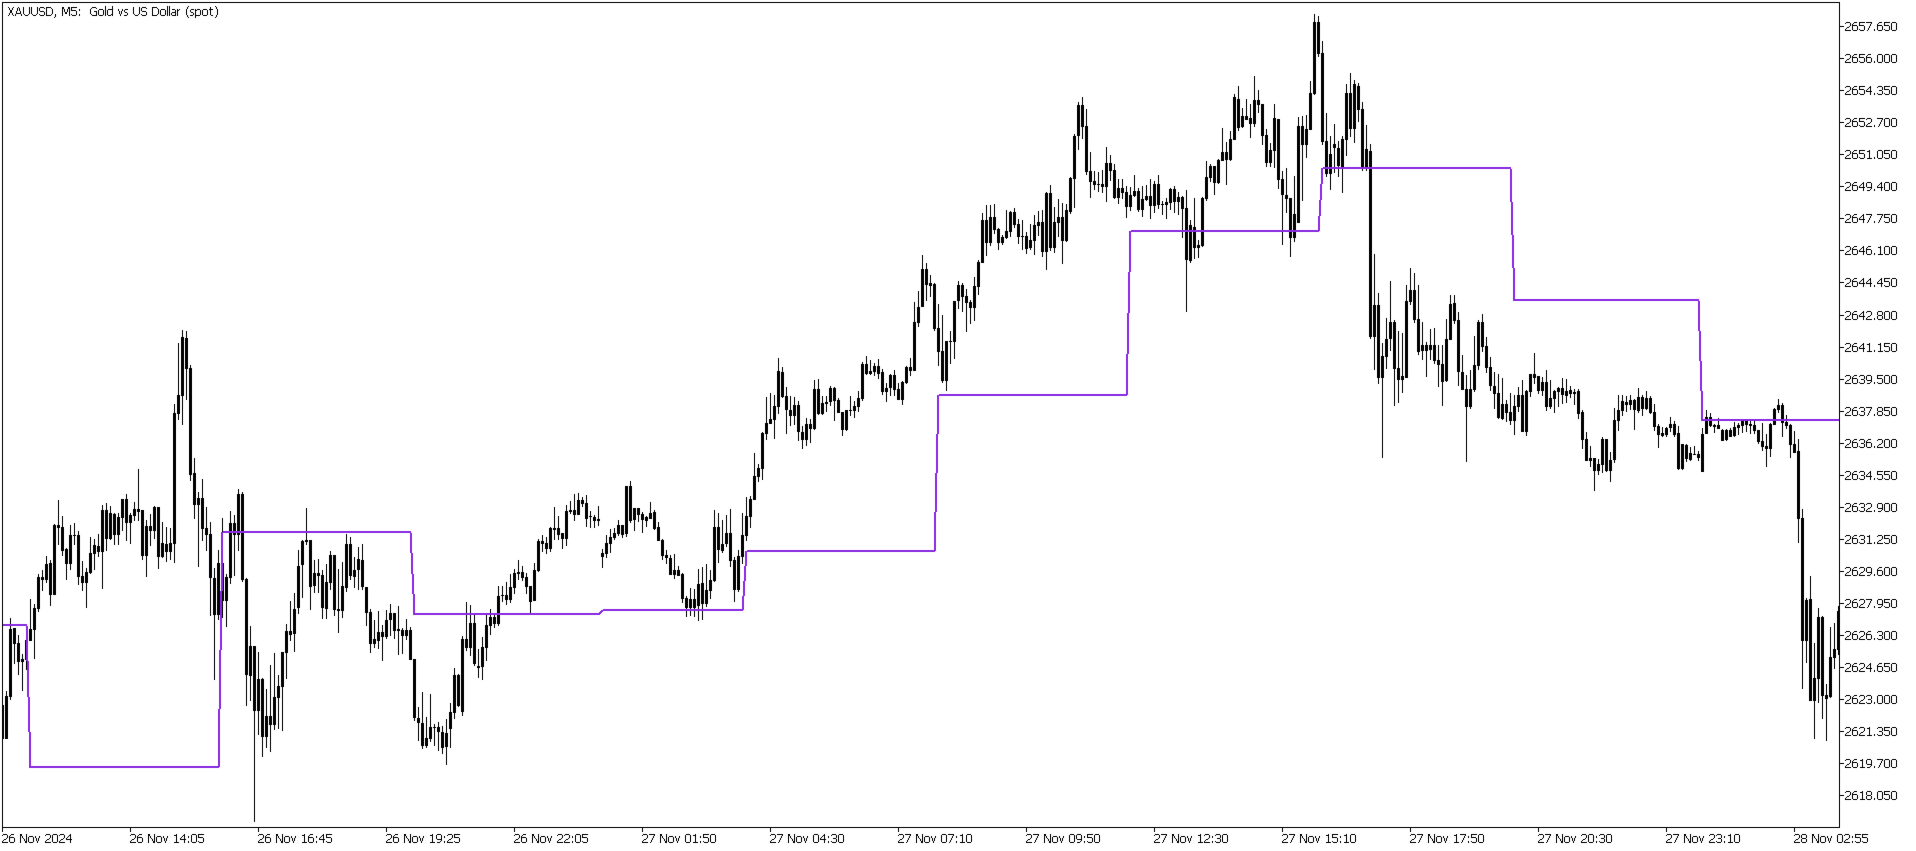
WapPrag is a powerful custom VWAP (Volume Weighted Average Price) indicator, adapted to a user-selected period, from 5 minutes to a year. It displays the (last) weighted average price for the previous period, based on candle price and volumes.
The indicator calculates the weighted average price (based on High, Low and Close) during the selected timeframe, and saves the last value as a constant level to display in the current chart. This allows traders to target the key level of the fair price of the previous period.
Available settings - WapPeriod - period selection.