Hidden SMT Divergence ICT Indicator MT5
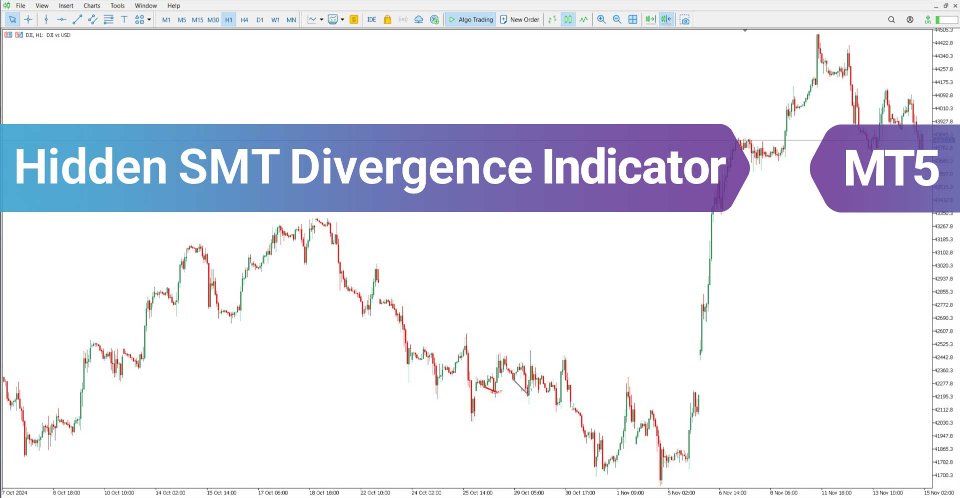
Hidden SMT Divergence Indicator for MT5
The Hidden SMT Divergence Indicator is designed to uncover subtle market imbalances between three stock indices.
Using liquidity dynamics and Smart Money principles, this indicator assesses strength variations across correlated assets. When these instruments diverge in movement, it often suggests a potential trend shift.
Hidden Smart Money Divergence Indicator Specifications
Below is an outline of the key features of the Hidden SMT Divergence Indicator:
| Category | ICT - Smart Money - Liquidity |
| Platform | MetaTrader 5 |
| Skill Level | Advanced |
| Indicator Type | Reversal - Continuation |
| Timeframe | Multi timeframe |
| Trading Style | Intraday Trading |
| Market | Stocks |
Overview of the Hidden SMT Divergence Indicator
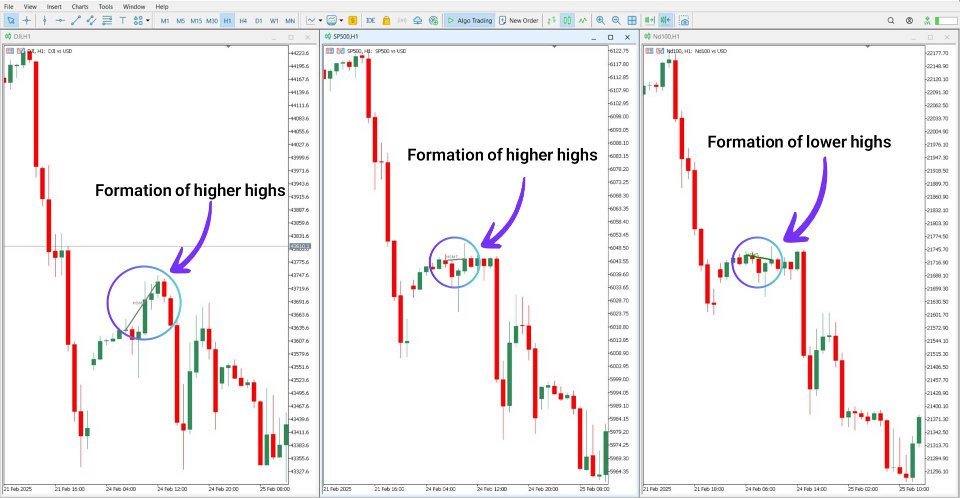
A hidden divergence forms when one financial asset reaches a new high or low, while its correlated counterpart fails to confirm the movement. This pattern can signal both bullish and bearish setups.
Bullish Scenario
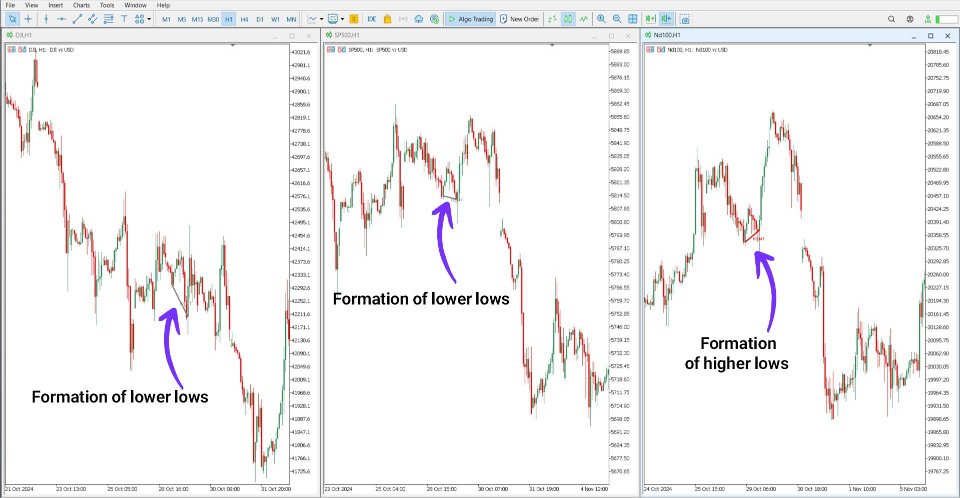
On a 1-hour timeframe, an analysis of DJI, SP500, and ND100 demonstrates the indicator’s effectiveness. In one case, while DJI and SP500 created lower lows, ND100 instead formed a higher low, indicating divergence.
Bearish Scenario
In contrast, during an uptrend, DJI and SP500 registered higher highs near a resistance zone, while ND100 formed lower highs, reflecting weakening bullish pressure.
Hidden SMT Divergence Indicator Settings
Below is a breakdown of the customizable parameters available in the indicator:
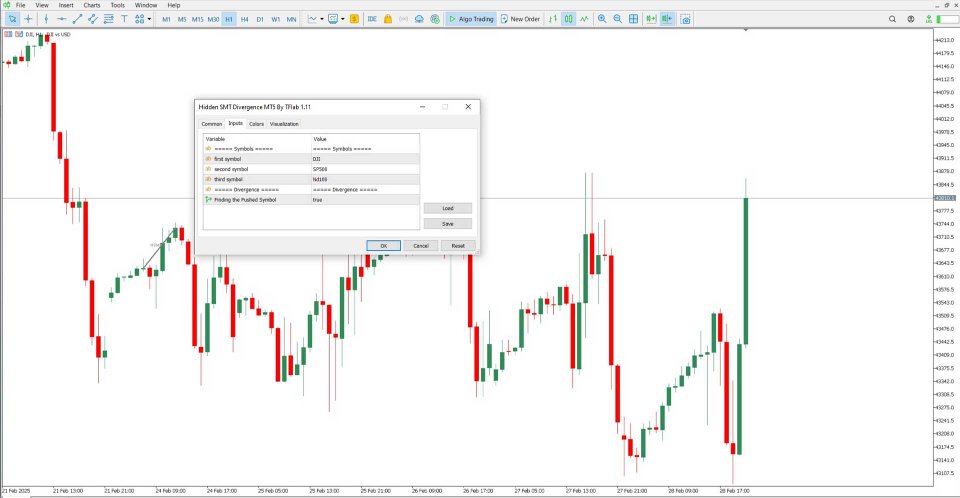
- First Symbol – Assigns the primary trading instrument
- Second Symbol – Defines the secondary asset
- Third Symbol – Selects the third instrument for analysis
- Finding the Pushed Symbol – Enables automatic detection of the asset showing divergence
Conclusion
By identifying divergence patterns across major indices like DJI, SP500, and ND100, the Hidden SMT Divergence Indicator helps traders anticipate trend movements. This MT5 tool maps price fluctuations and highlights potential market reversals. To maximize its effectiveness, apply it to the First Symbol’s chart before analysis.
