Swing Failure Pattern Sfp ICT Indicator MT4
Swing Failure Pattern SFP ICT Indicator MT4
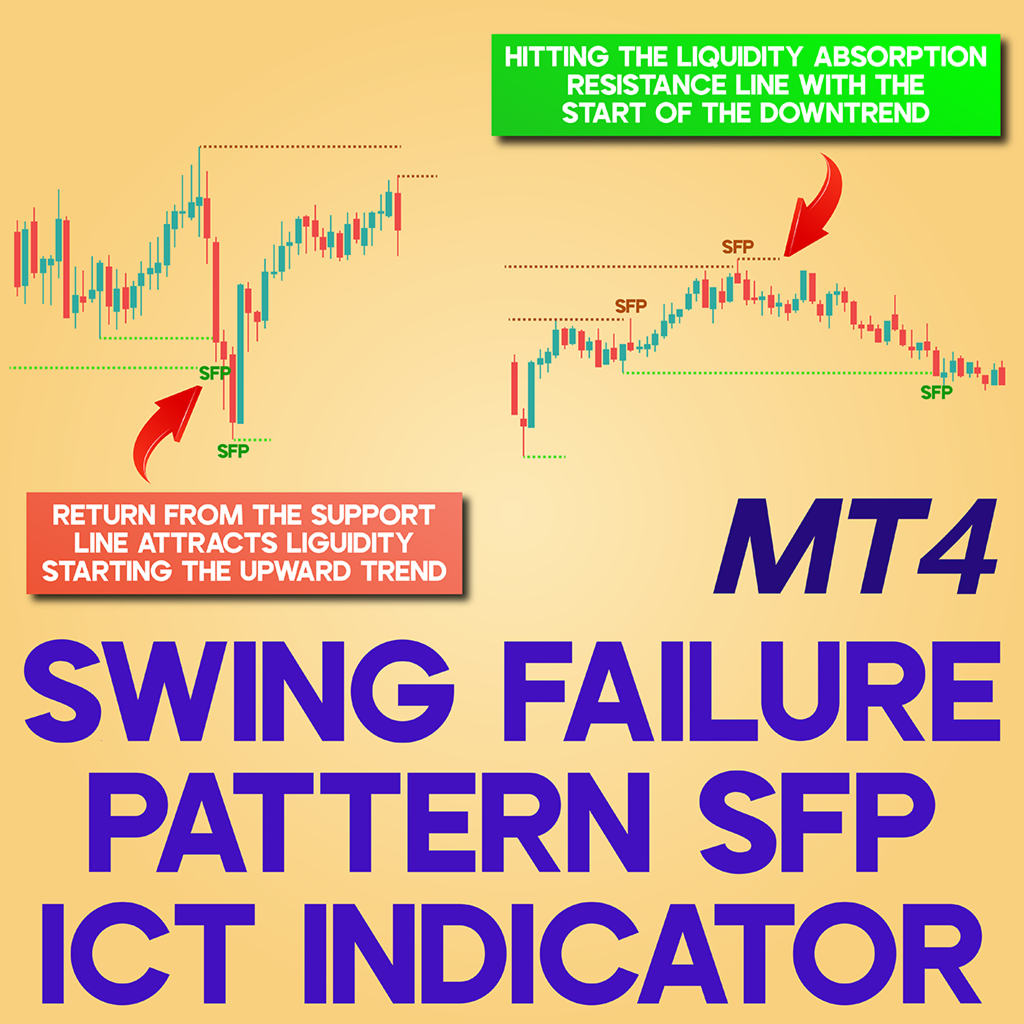
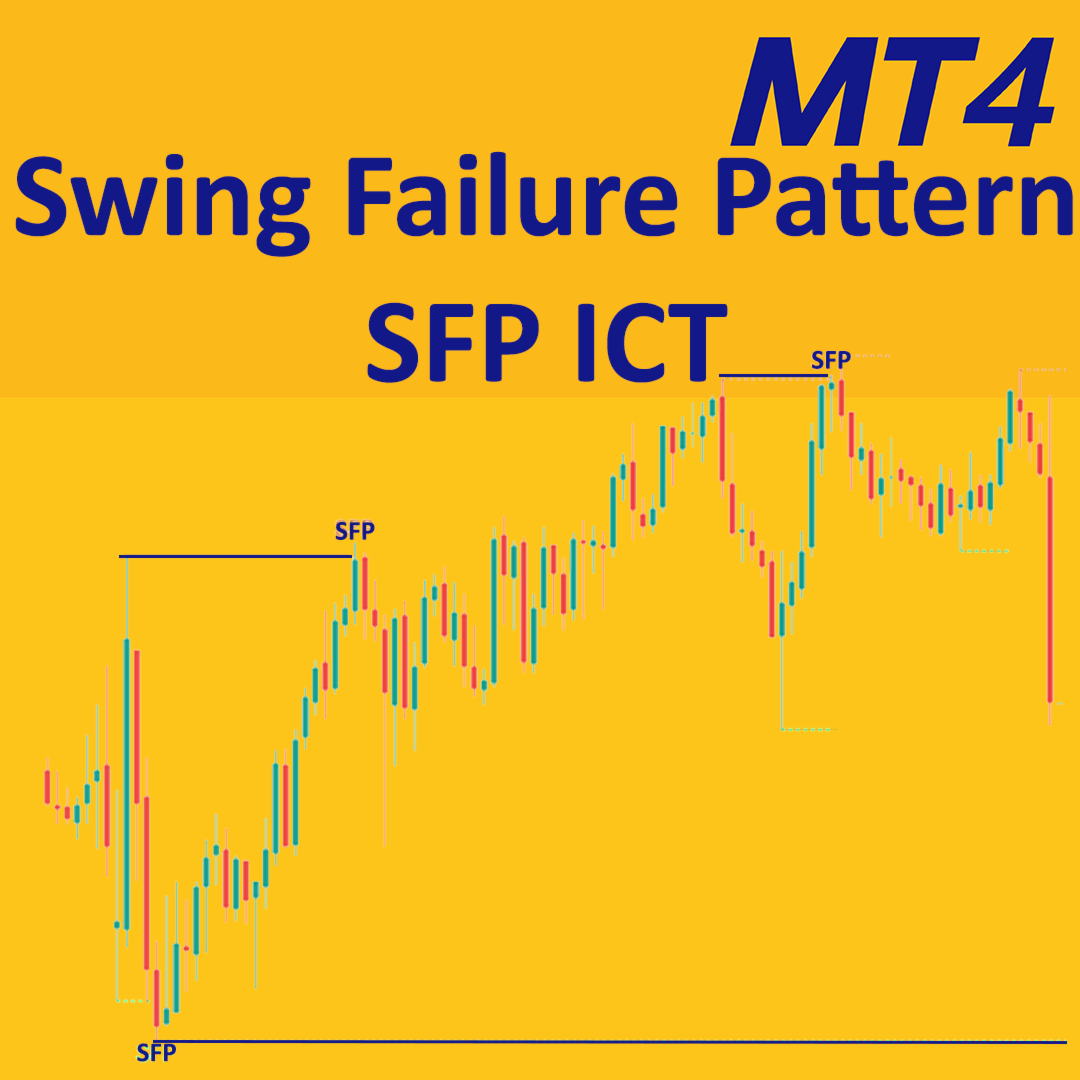
The Swing Failure Pattern (SFP) Indicator in ICT methodology occurs when the price momentarily breaches a critical support or resistance level but swiftly retraces and closes back within the range. This specialized tool for MetaTrader 4 highlights liquidity accumulation at these key points using green and orange lines, allowing traders to spot potential reversal zones effectively.
«Indicator Installation & User Guide»
MT4 Indicator Installation | Swing Failure Pattern Sfp ICT Indicator MT5 | ALL Products By TradingFinderLab | Best MT4 Indicator: Refined Order Block Indicator for MT4 | Best MT4 Utility: Trade Assistant Expert TF MT4 | TP & SL Tool: Risk Reward Ratio Calculator RRR MT4 | Money Management: Easy Trade Manager MT4
Swing Failure Pattern (SFP) ICT Specifications Table
Below are the essential details of the SFP ICT Indicator:
| Category | ICT – Smart Money – Liquidity |
| Platform | MetaTrader 4 |
| Skill Level | Advanced |
| Indicator Type | Reversal – Breakout |
| Timeframe | Multi timeframe |
| Trading Style | Intraday Trading |
| Trading Market | All Markets |
Indicator Overview
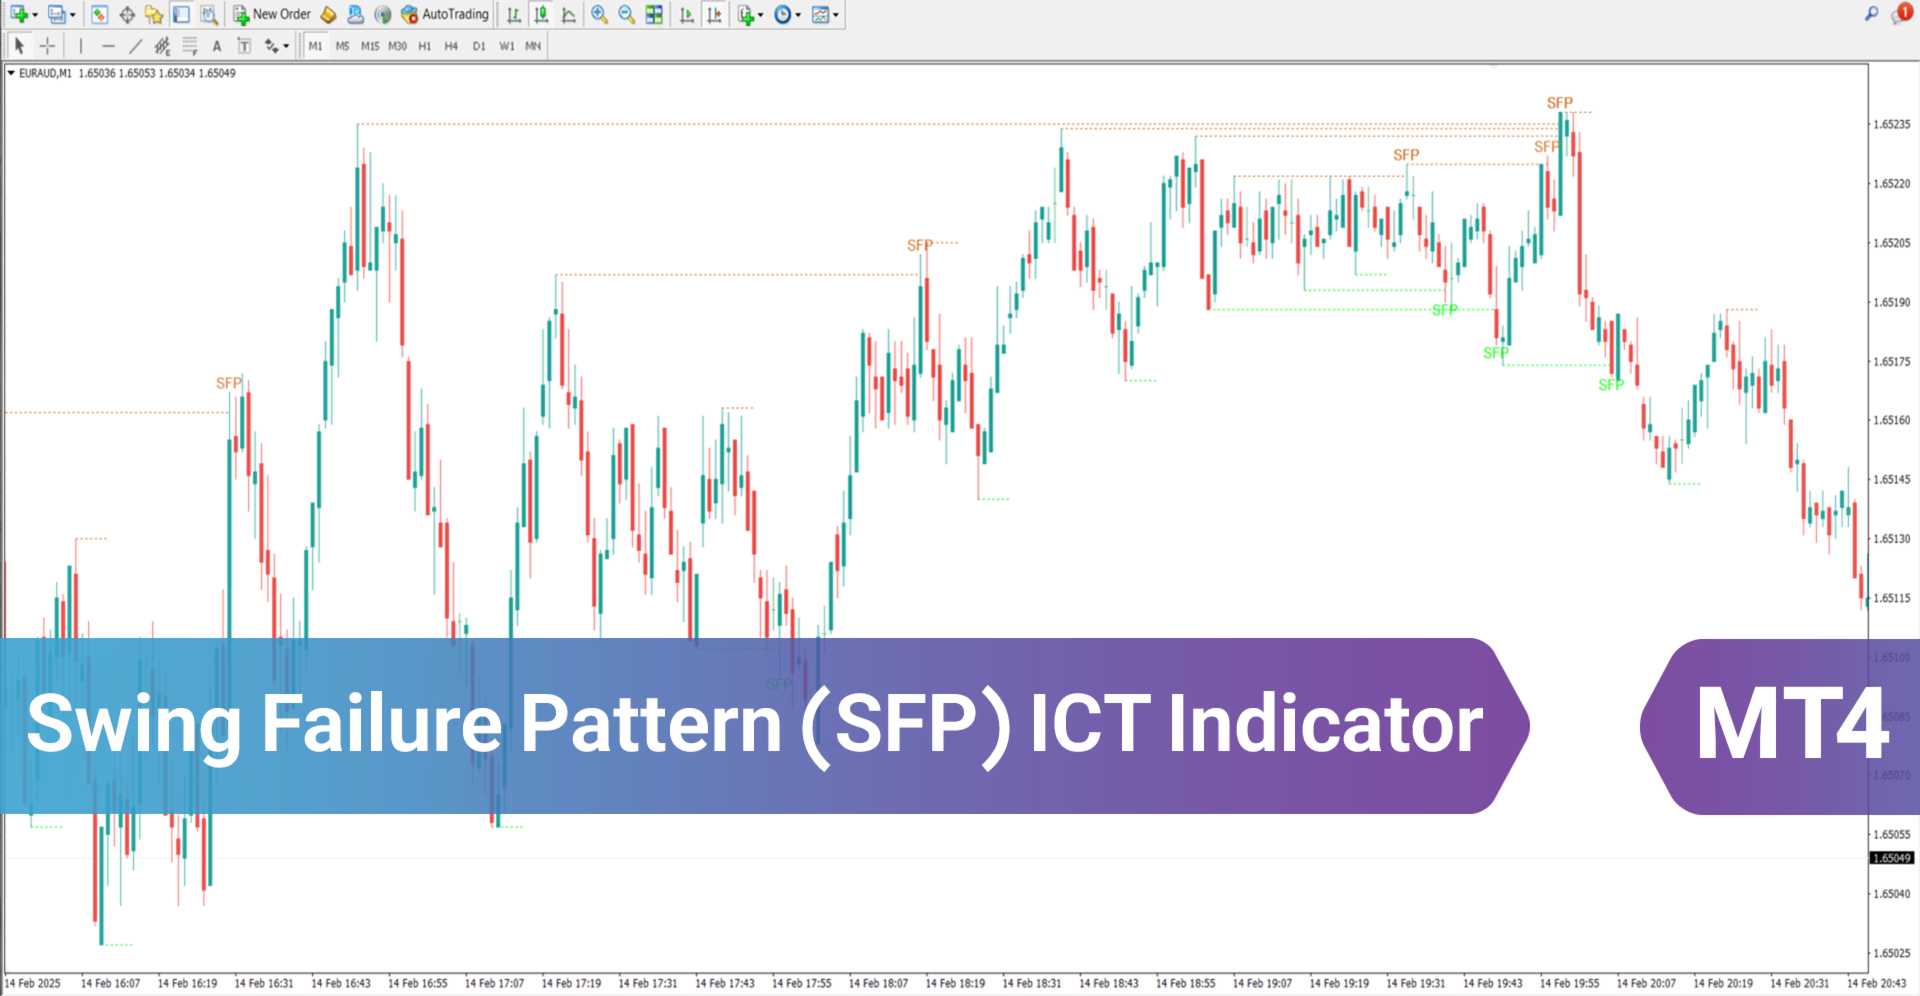
The SFP ICT Indicator detects reversal signals at crucial market levels following liquidity absorption. A genuine trend reversal occurs when the price pierces a swing high or low but fails to hold the breakout. Additionally, this tool helps traders identify fake breakouts by evaluating recent swing highs and lows, making it an essential component of liquidity-based trading strategies.
Uptrend Conditions
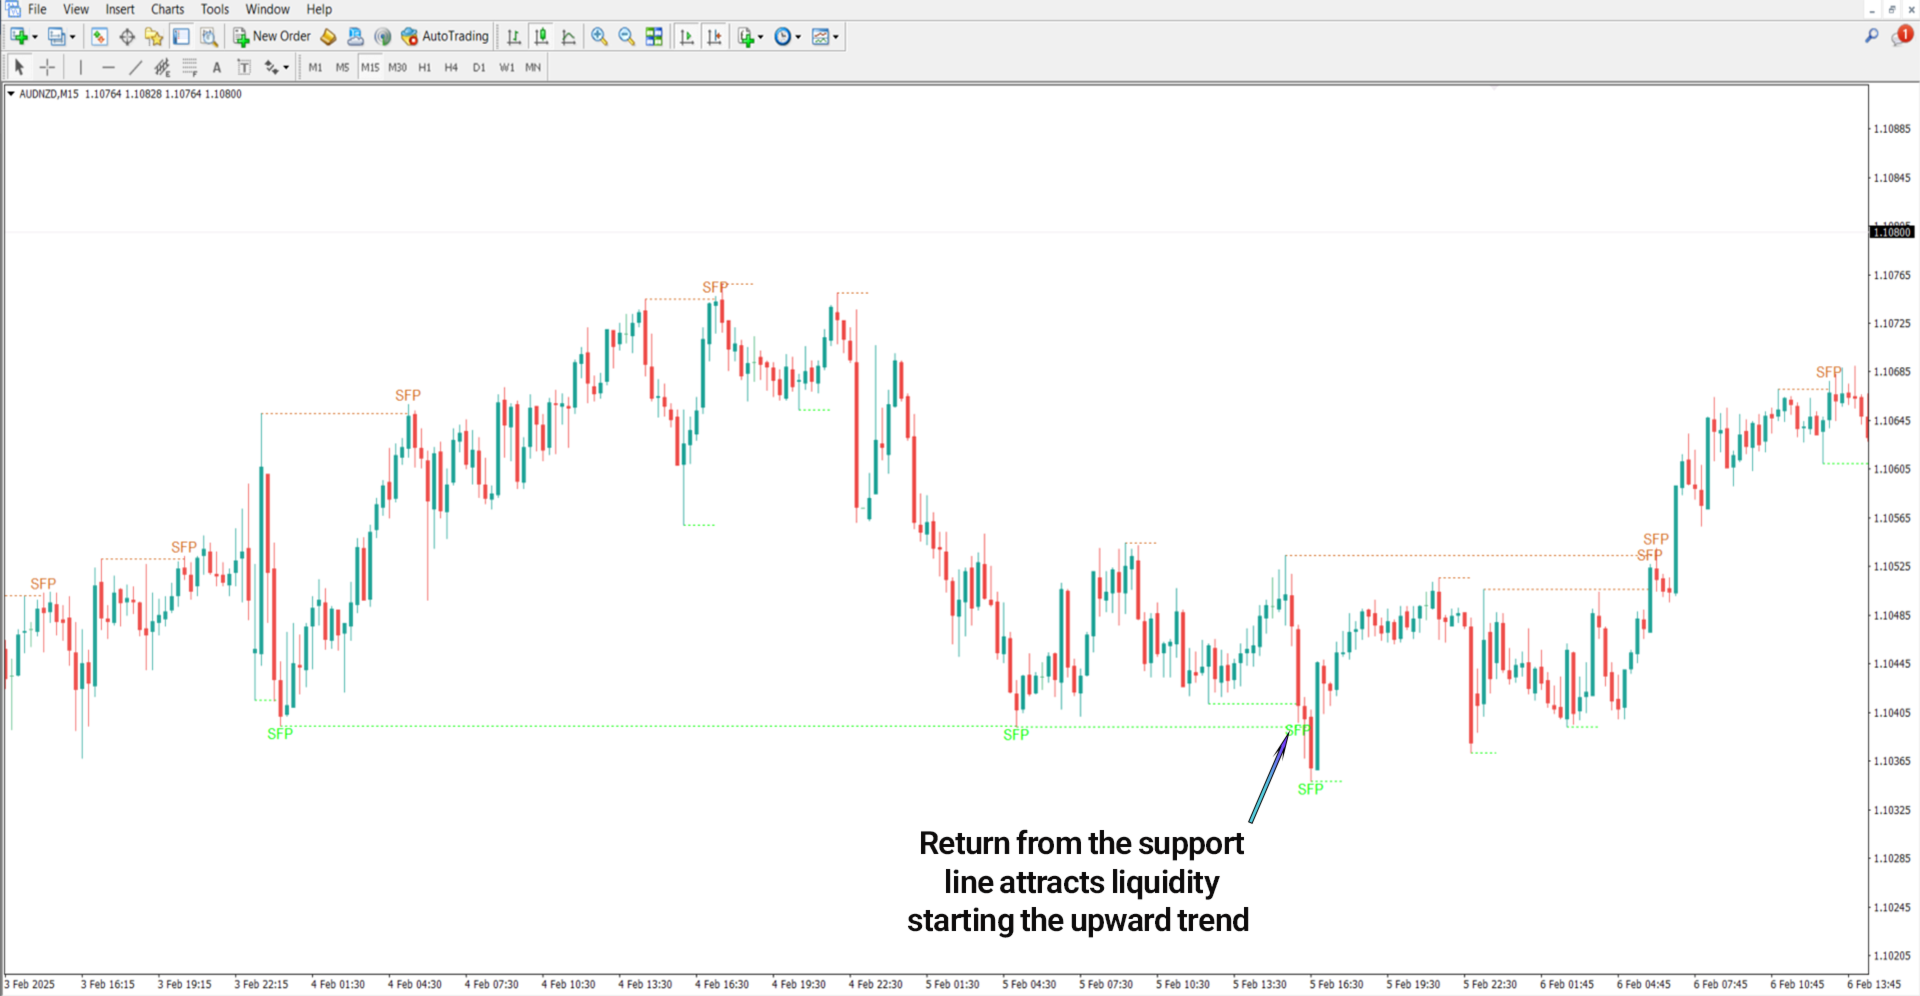
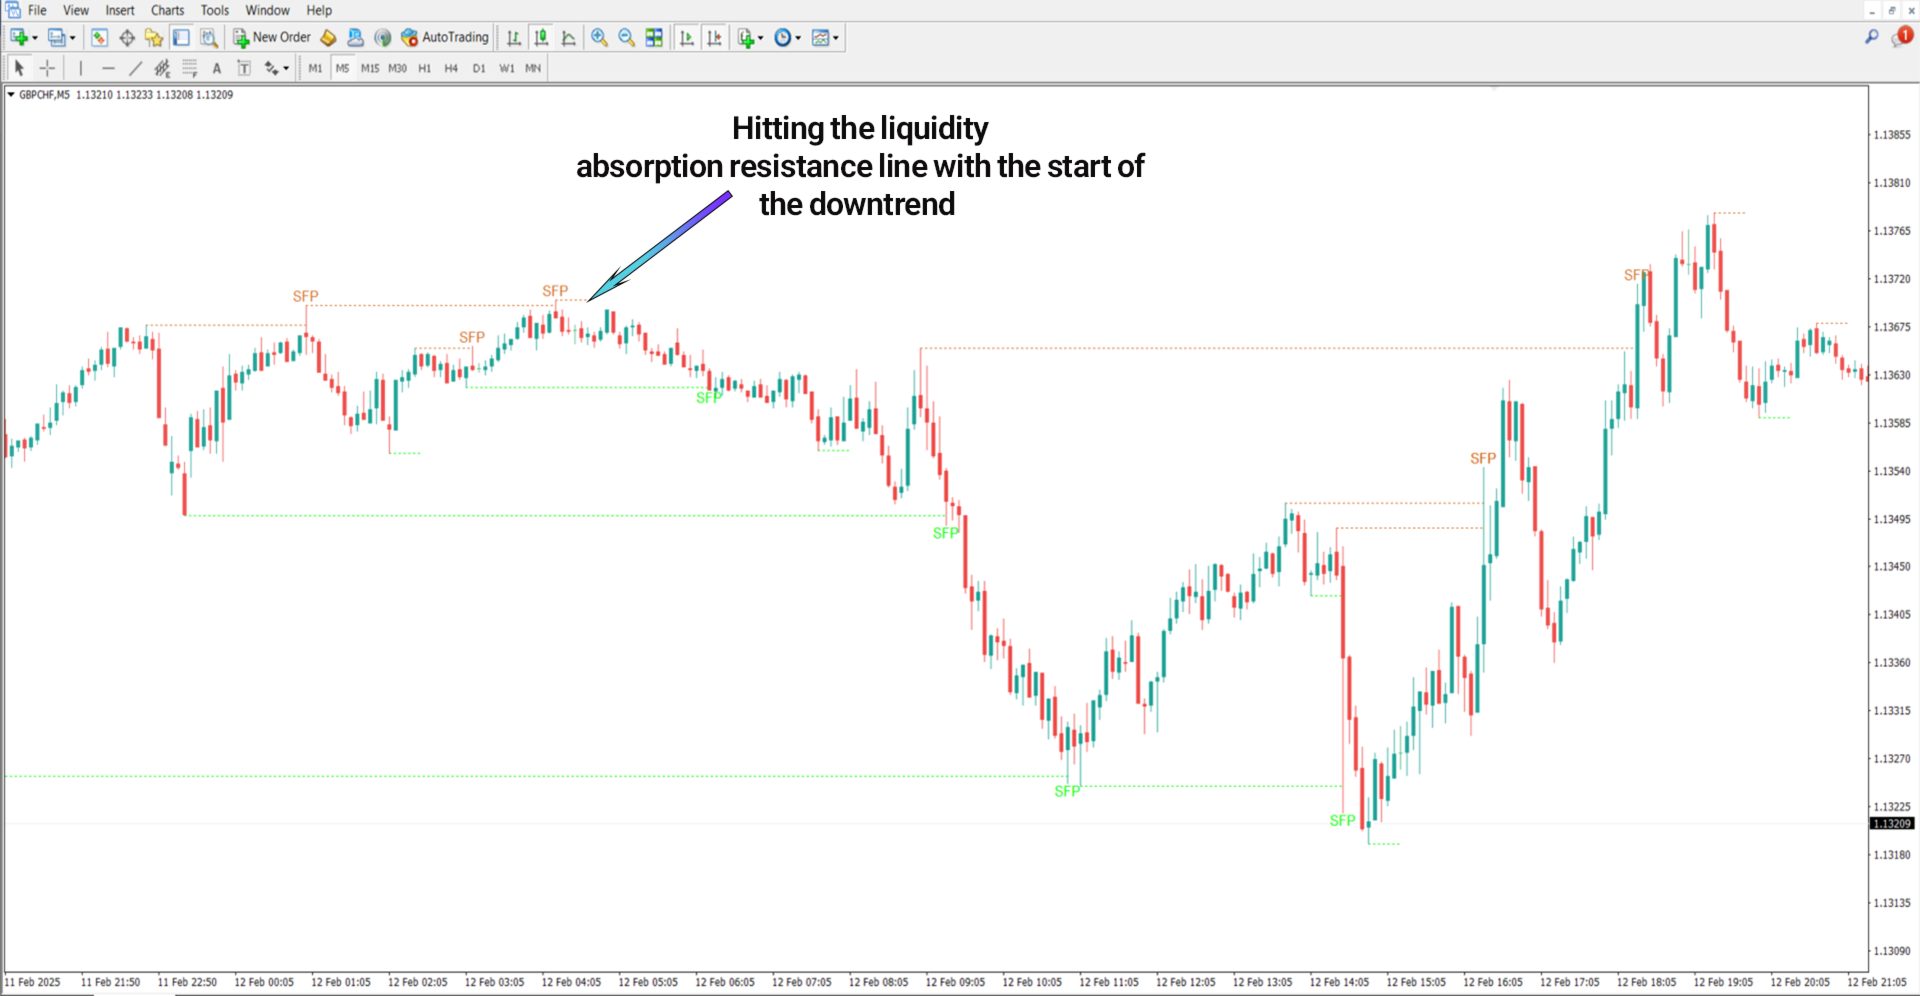
An example of bullish price action in the GBP/CHF pair on a 5-minute timeframe showcases a false breakout at a support zone. Initially, the price dips below support, forming an extended wick, but then rebounds and closes above the level, confirming liquidity absorption and signaling a potential buying opportunity.
Downtrend Conditions
A scenario on the CHF/JPY 1-minute chart illustrates bearish price movement, where the price temporarily breaks a resistance level and leaves a long wick before reversing sharply and closing below resistance. This confirms liquidity grab behavior, making it a prime selling setup.
Indicator Settings
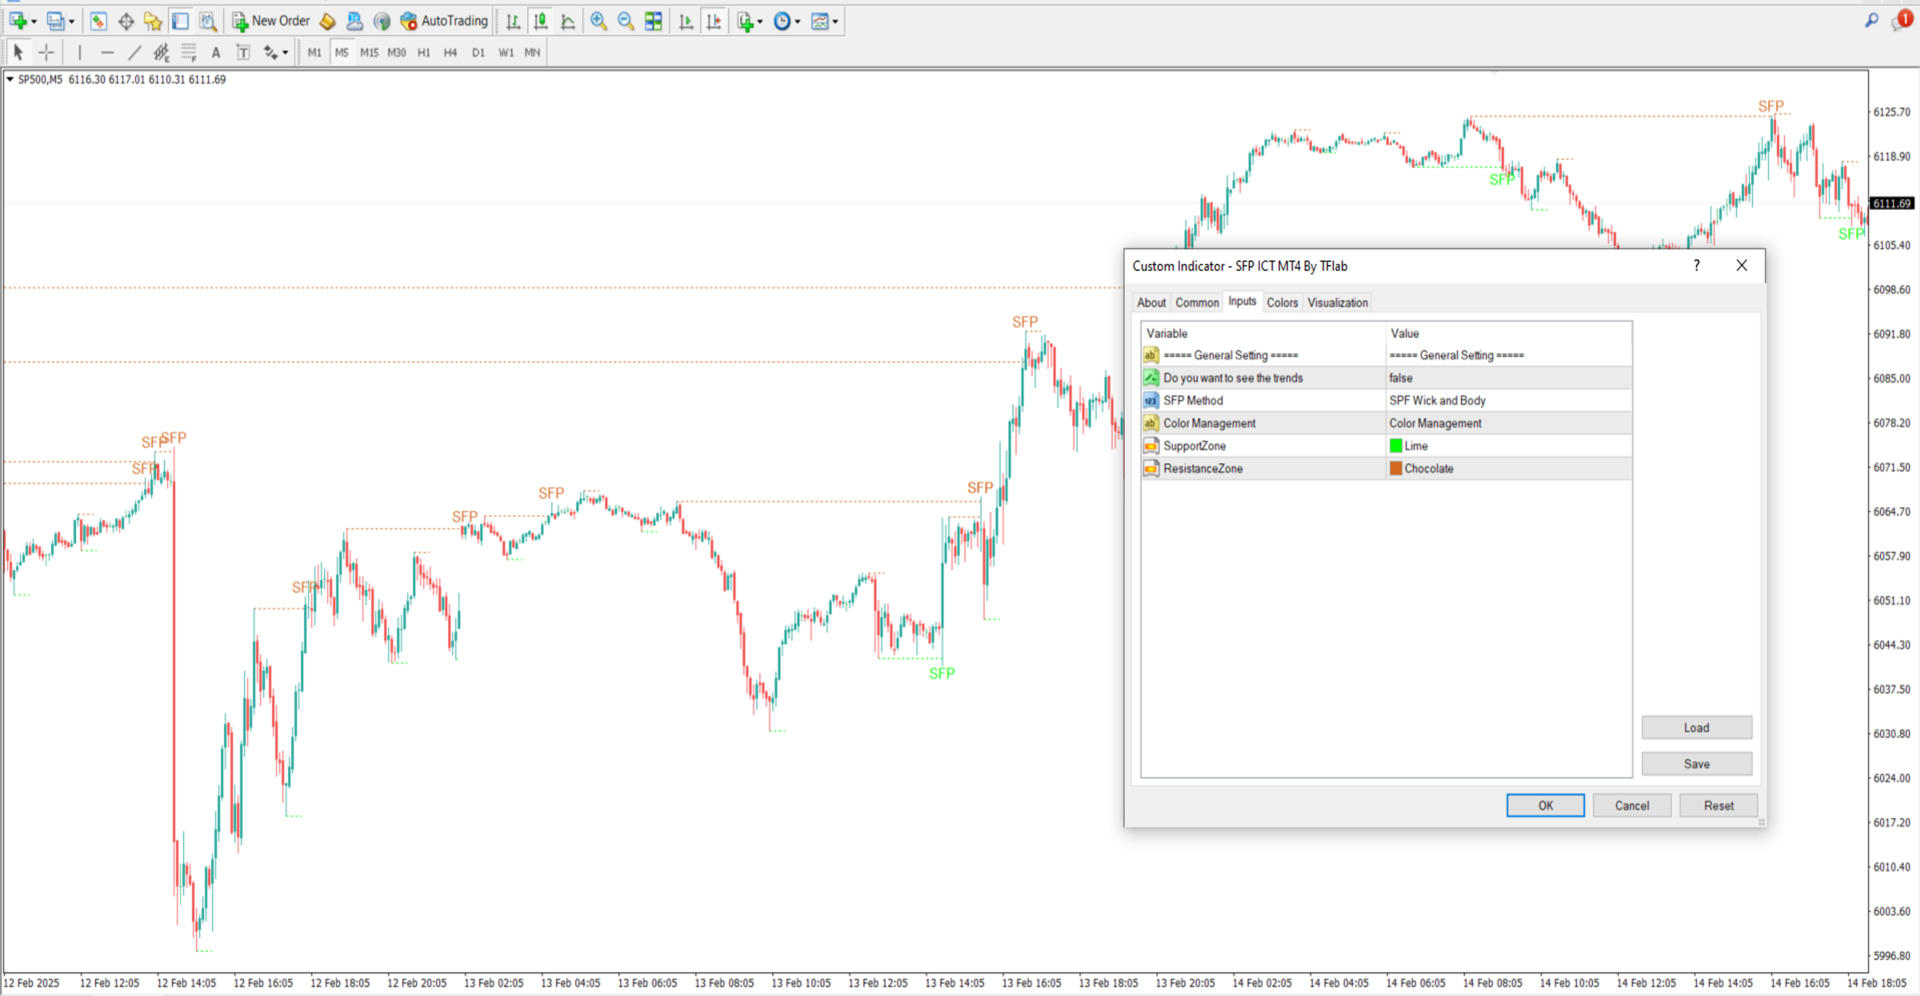
The SFP ICT Indicator provides various customization options to fine-tune its application for trend detection, liquidity zones, and visual preferences:
- Do you want to see the trends → Enables trend analysis visibility
- SPF Method → Selects the SFP trading approach
- Color Management → Adjusts indicator display settings
- Support Zone → Identifies price levels where buying pressure emerges
- Resistance Zone → Marks price levels where selling pressure increases
Conclusion
The SFP ICT Indicator is a valuable tool for recognizing failed breakouts and spotting high-probability trade setups. By identifying liquidity absorption areas at significant support and resistance levels, this indicator enhances precision in market analysis. It effectively highlights these reversal points using green and orange markers, allowing traders to capitalize on smart money-driven price movements.