MAYER Crosshair
- 指标
- Mihail Baier
- 版本: 1.0
- 激活: 5
📌 同步十字光标 & 极值线指标
🔹 简单解释(适合所有交易者)
该指标可以让你在多个相同品种的图表上同步十字光标,帮助你同时跟踪不同时间周期的价格走势。
主要功能:
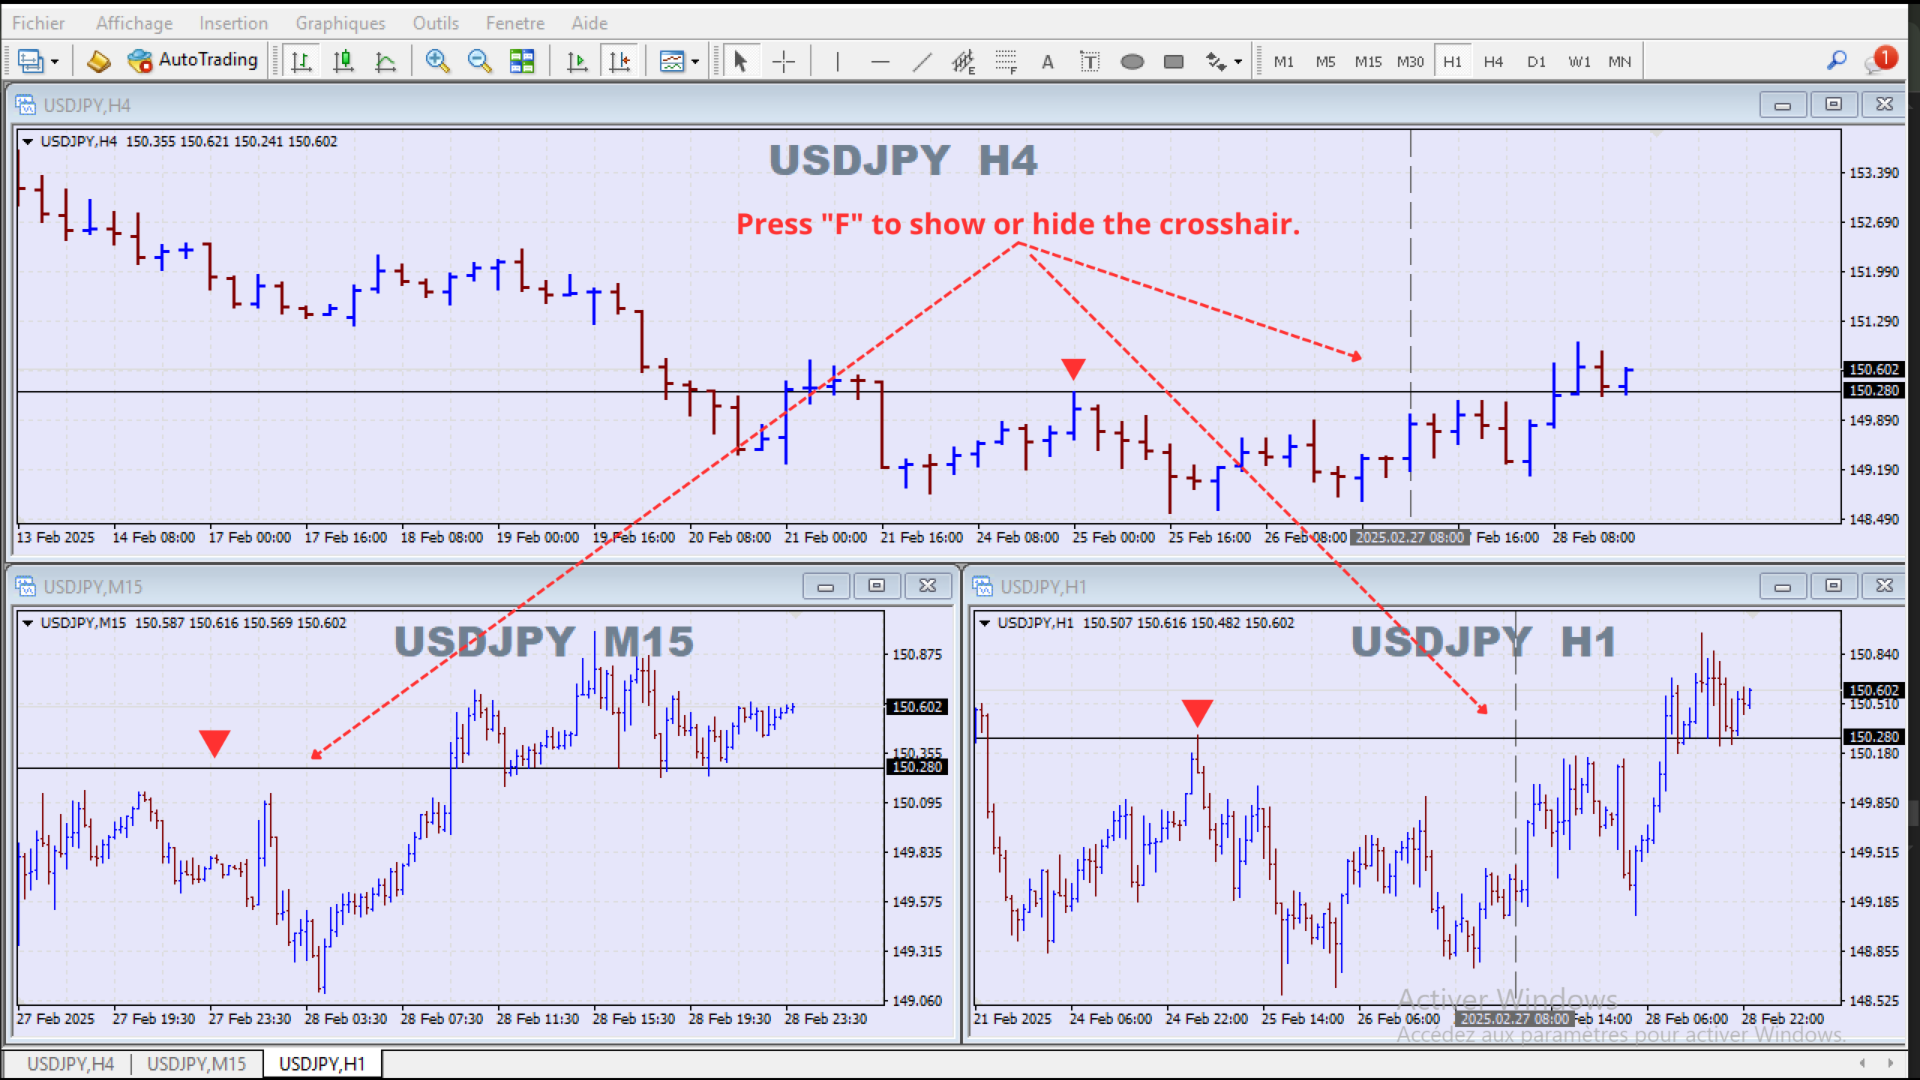
✅ 同步十字光标:在一个图表上移动光标,其他相同品种的图表也会自动更新。
✅ 快捷键操作:
- "F" – 显示/隐藏十字光标。
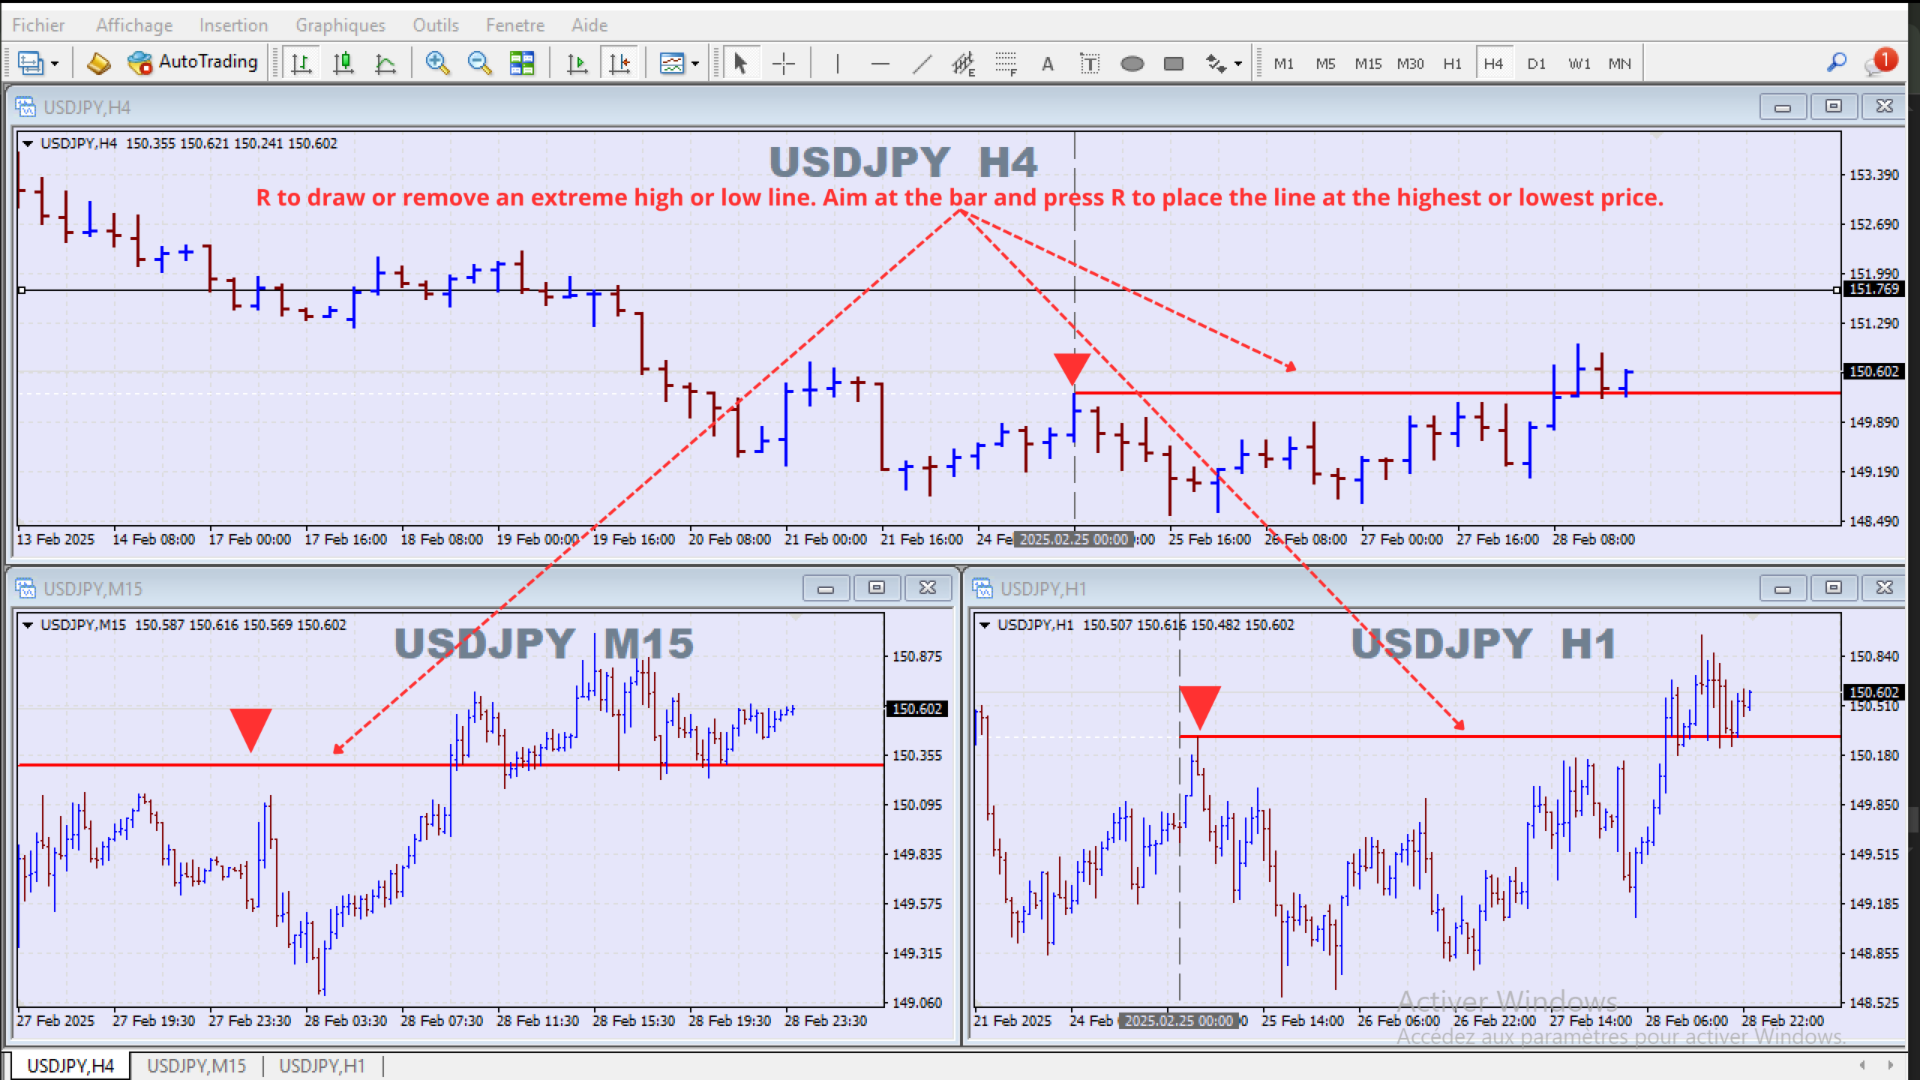
- "R" – 添加或删除极值线(最高价/最低价)。
- "T" – 在选定的K线位置添加或删除垂直线。
✅ 完全可自定义:你可以调整颜色、线条样式和宽度,以适应你的交易风格。
这个工具适用于多周期分析,让你无需手动对齐光标,即可快速对比市场走势。
🔹 高级解释(适合专业交易者和开发者)
同步十字光标 & 极值线指标是一款多图表同步工具,专为技术分析交易者设计,帮助他们精确跟踪价格水平,并在多个时间周期中同步关键点位。
核心功能:
-
同步十字光标:
- 在当前图表上绘制垂直和水平十字光标。
- 当光标移动时,所有相同品种的图表都会实时更新。
- 快捷键 "F" 可开关光标显示。
-
极值线(最高/最低价标记):
- 按 "R" 键可在选中的K线上绘制最高价或最低价的极值线。
- 极值线包括两条线:
- 主要参考线(虚线),用于指示当前极值。
- 确认线(实线),用于历史趋势分析。
- 若该K线已经有极值线,按 "R" 键可删除。
-
垂直线标记:
- 按 "T" 键可在选中的K线上同步绘制垂直线,所有相同品种的图表都会显示该标记。
- 若该K线已有垂直线,按 "T" 可删除。
自定义选项 & 兼容性:
- 你可以调整:
- 十字光标颜色、样式和宽度(水平线和垂直线可分别调整)。
- 极值线颜色、样式和宽度(可单独设置最高价和最低价)。
- 垂直线颜色、宽度和样式。
- 支持所有时间周期和图表类型(K线、柱状图、折线图等)。
为什么要使用这个指标?
✅ 多时间周期分析:快速对比不同时间周期的市场走势,提升交易决策效率。
✅ 精准标记关键价位:极值线功能帮助你更好地识别市场趋势。
✅ 高效、直观、易用:快捷键控制,无需繁琐设置,即可快速应用到交易中。
这款指标是Price Action(价格行为)交易者的必备工具,让你专注于市场走势,而不是手动调整图表!🚀