Trend Correlation Strength
- 指标
- Guillermo Pineda
- 版本: 1.0
- 激活: 5
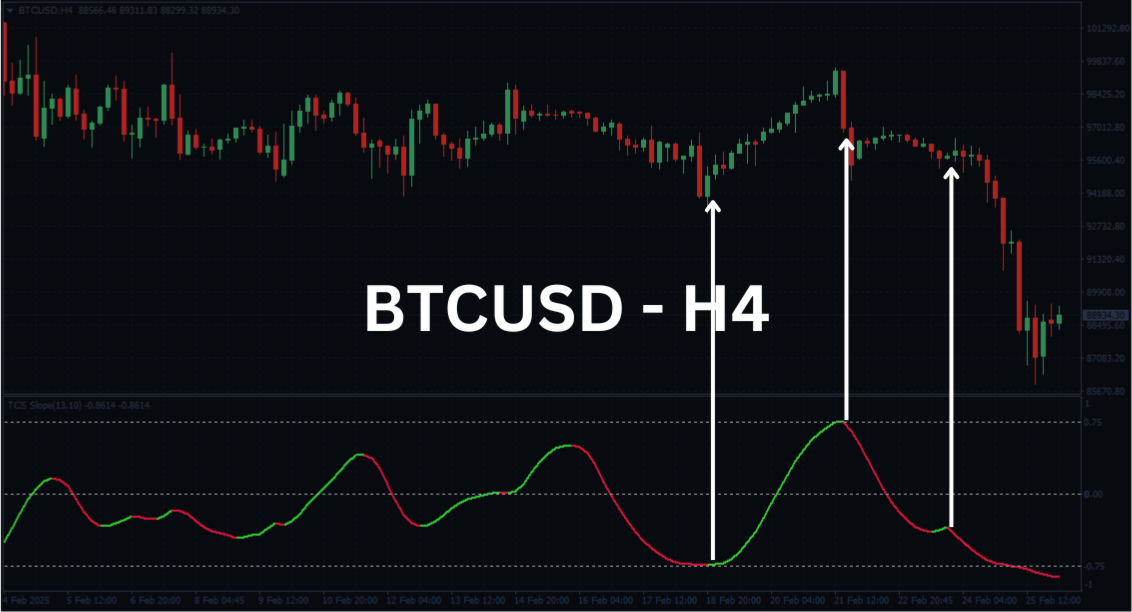
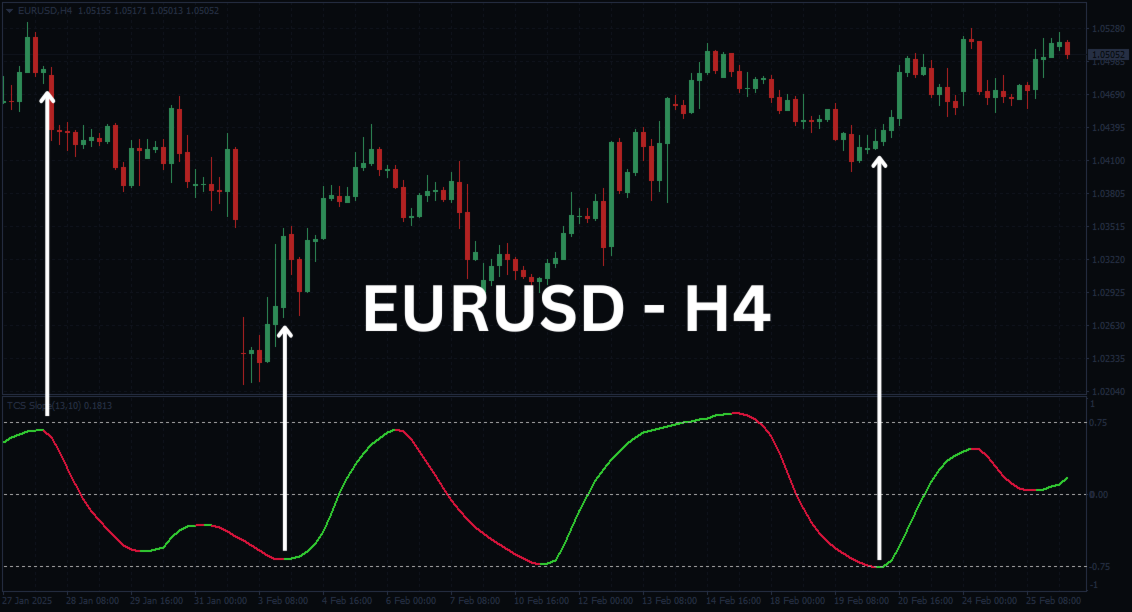
The Trend Correlation Strength (TCS) Indicator is a powerful new tool designed to measure trend strength in a unique and effective way, outperforming traditional indicators like the Average Directional Index (ADX). Instead of relying on directional movement (+DI and -DI), TCS calculates the correlation between closing prices and a linear time series, giving forex traders a distinctive method for identifying strong trends.
Key Benefits of TCS
-
Detect Trends Like a Pro: TCS doesn’t rely on lagging averages; it measures how linearly prices move over time. When the TCS value climbs above 45 on your weekly chart, it's a strong signal that a significant move is underway. Use it alongside your existing indicators to enter trades early and capture those precious pips.
-
Simplicity at Its Best: TCS features a clean, easy-to-read design with just one blue line and a dotted 45-level guide. This makes it accessible for all traders, allowing you to focus on trend strength without the clutter of complicated settings or multiple lines.
-
Forex-Focused Design: Unlike the ADX, which was developed for commodities in the 1970s, TCS is tailored for the forex markets. Its calculations are designed around macroeconomic events like GDP releases and rate hikes, making it a modern advantage for today’s traders.
What Makes TCS Stand Out
-
Unique Calculation: TCS measures price movement over time in a way that traditional indicators like the ADX do not, providing a fresh perspective on trend strength.
-
Trend Strength Measurement: Just like the ADX, TCS quantifies trend strength on a scale of 0 to 100, but through a correlation analysis with price time.
-
Quick to Respond: TCS can quickly detect trends in linear markets, potentially giving traders a competitive edge.
-
User-Friendly: With its single line and straightforward interpretation, TCS is ideal for traders at all experience levels.