MACD Swing Low Multi Time Frame Indicator
- 指标
- Satyam Shivam
- 版本: 8.0
- 激活: 20
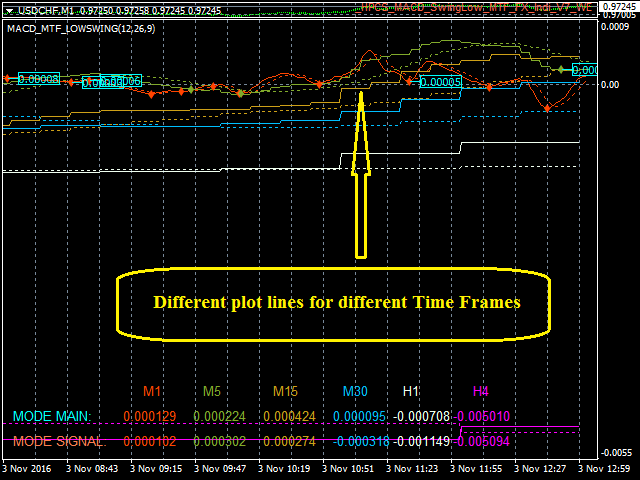
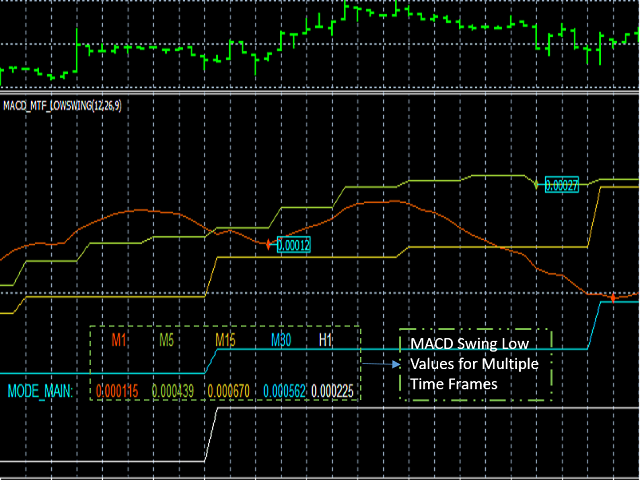
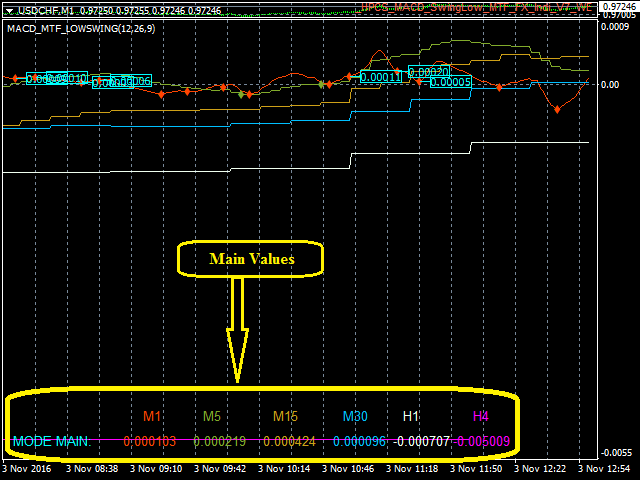
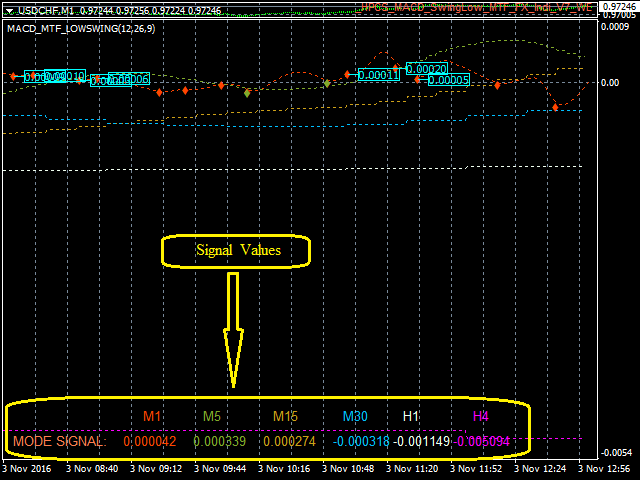
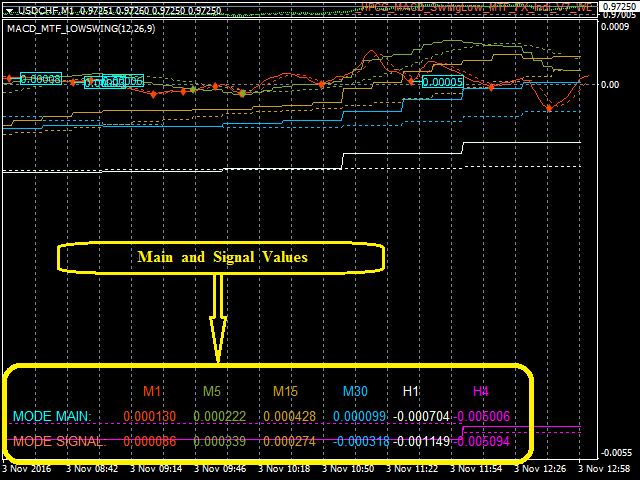
MACD Swing Low Multi Time Frame Indicator is one of the most advanced indicators based on both Swing Low and MACD trading strategies. It supports multiple timeframes, i.e. by attaching the indicator on a single chart, one can see the MACD Swing Low values for all the other timeframes on a single chart. One would just have to select the timeframes, for which he wants to see the calculated values.
Features
- On the chart, one can set the option to view the MACD Swing Low calculated values and the MACD Swing Low graph along with the Swing Low values marked on the graph for all the timeframes.
- Set the condition to check the perfect bar condition for Swing Low calculation.
- Set the number of bars before the current bar to check for the perfect bar criterion.
- Set the number of bars after the current bar to check for the perfect bar criterion.
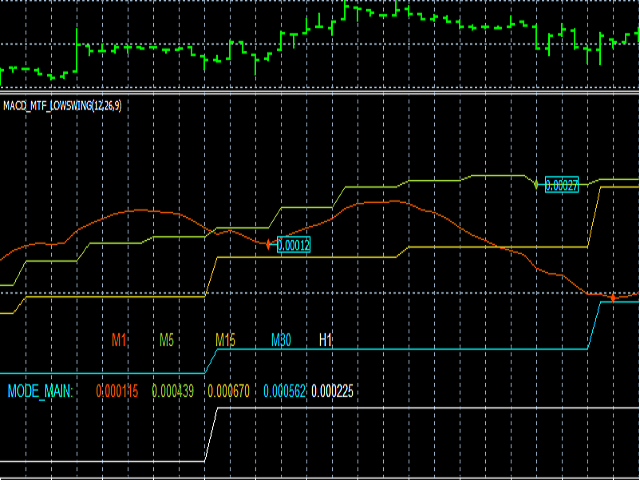
- View the MACD Swing values of different timeframes on a single chart.
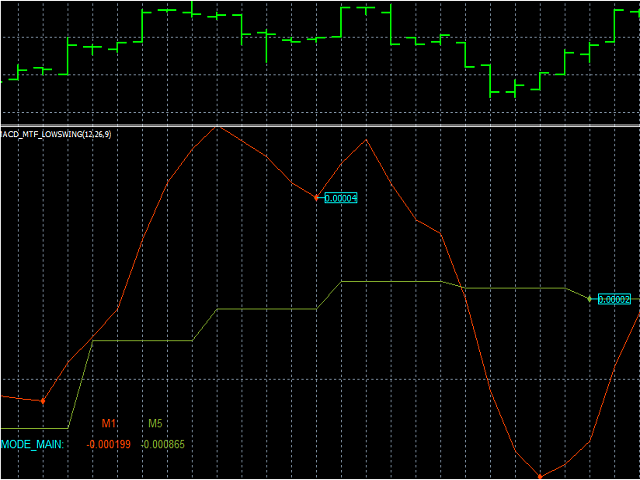
- View the MACD graph of different timeframes on a single chart along with Swing Low MACD calculated values marked on the graph for different timeframes.
- Option to view the swing low points on the chart or along with the point values.
- Change the default colors of the text blocks, chart lines and set your own colors.
Inputs
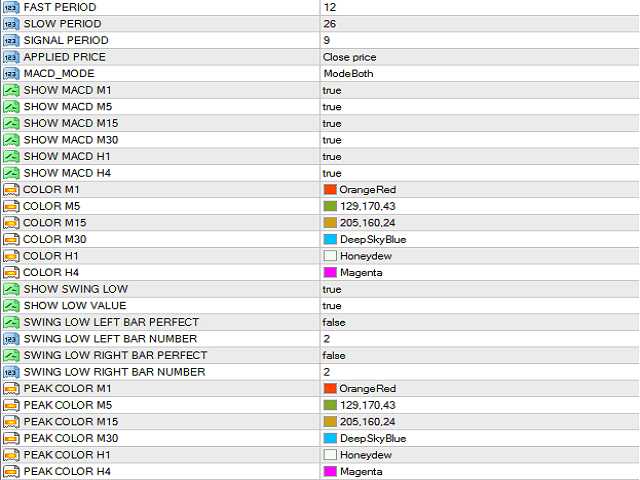
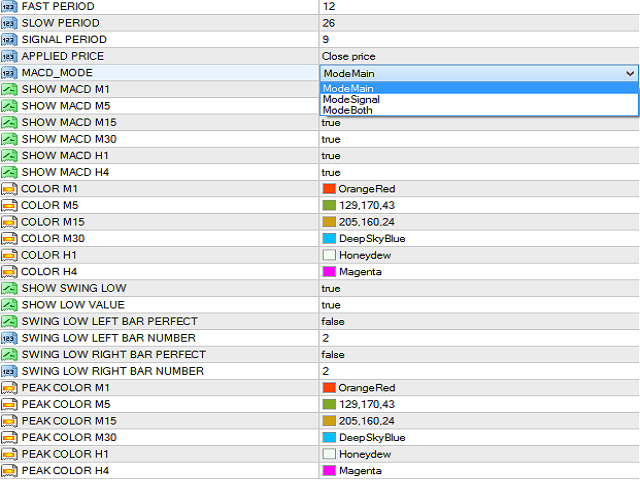
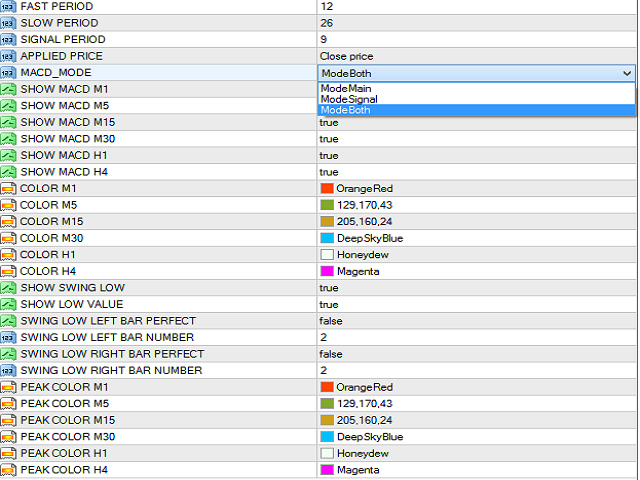
- FAST_PERIOD: Set fast moving average value
- SLOW_PERIOD: Set slow moving average value
- SIGNAL_PERIOD: Set value of signal period of moving average
- APPLIED_PRICE: Select from Close Price, Open Price, High Price, Low Price, Median Price, Typical Price, Weighted Price
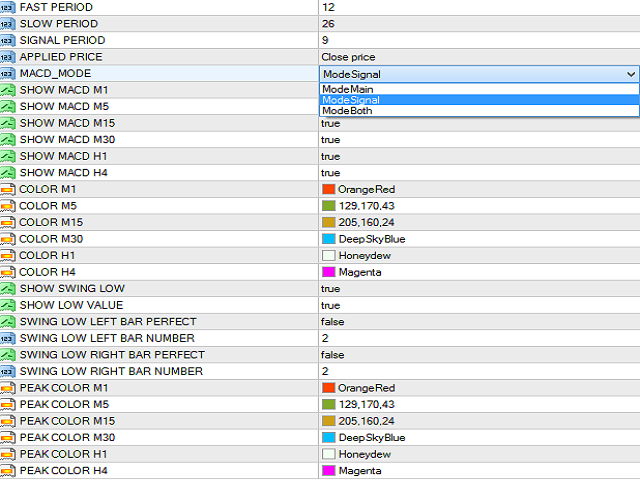
- MACD_MODE: Select from Mode Main, Mode Signal or Mode Both
- SHOW_MACD_M1: Enable/Disable MACD calculations on M1 chart
- SHOW_MACD_M5: Enable/Disable MACD calculations on M5 chart
- SHOW_MACD_M15: Enable/Disable MACD calculations on M15 chart
- SHOW_MACD_M30: Enable/Disable MACD calculations on M30 chart
- SHOW_MACD_H1: Enable/Disable MACD calculations on H1 chart
- SHOW_MACD_H4: Enable/Disable MACD calculations on H4 chart
- COLOR_M1: Set the text color for M1 calculated value. Create it as you like it best
- COLOR_M5: Set the text color for M5 calculated value. Create it as you like it best
- COLOR_M15: Set the text color for M15 calculated value. Create it as you like it best
- COLOR_M30: Set the text color for M30 calculated value. Create it as you like it best
- COLOR_H1: Set the text color for H1 calculated value. Create it as you like it best
- COLOR_H4: Set the text color for H4 calculated value. Create it as you like it best
- SHOW_SWING_LOW: Enable/Disable MACD Swing Low point that will be marked on the chart
- SHOW_LOW_VALUE: MACD Swing Low value on the chart. Choose whether to enable or disable this value as per trader's convenience.
- SWING_LOW_LEFT_BAR_PERFECT: Enable this value to check for perfect bar condition on the left of the current bar
- SWING_LOW_LEFT_BAR_NUMBER: How many bars before the current bar the perfect bar condition should check. Set this parameter if you have enabled the previous parameter.
- SWING_LOW_RIGHT_BAR_PERFECT: Enable this value to check for perfect bar condition on the right of the current bar
- SWING_LOW_RIGHT_BAR_NUMBER: How many bars after the current bar the perfect bar condition should check. Set this parameter if you have enabled the previous parameter
- PEAK COLOR_M1: Set the color of Swing Low point for M1. Create it as you like it best
- PEAK_COLOR_M5: Set the color of Swing Low point for M5. Create it as you like it best
- PEAK COLOR_M15: Set the color of Swing Low point for M15. Create it as you like it best
- PEAK_COLOR_M30: Set the color of Swing Low point for M30. Create it as you like it best
- PEAK COLOR_H1: Set the color of Swing Low point for H1. Create it as you like it best
- PEAK_COLOR_H4: Set the color of Swing Low point for H4. Create it as you like it best
How to Use
Enable the timeframes, for which you want the MACD Swing Low plot.
Example: Suppose you want the plot for H1 timeframe, then set the SHOW_MACD_H1 input parameter as true.
MACD Swing Low Multi Time Frame Indicator is one of the most useful and time saving indicators. Traders can view the MACD Swing Low values for the different timeframes on a single chart.
