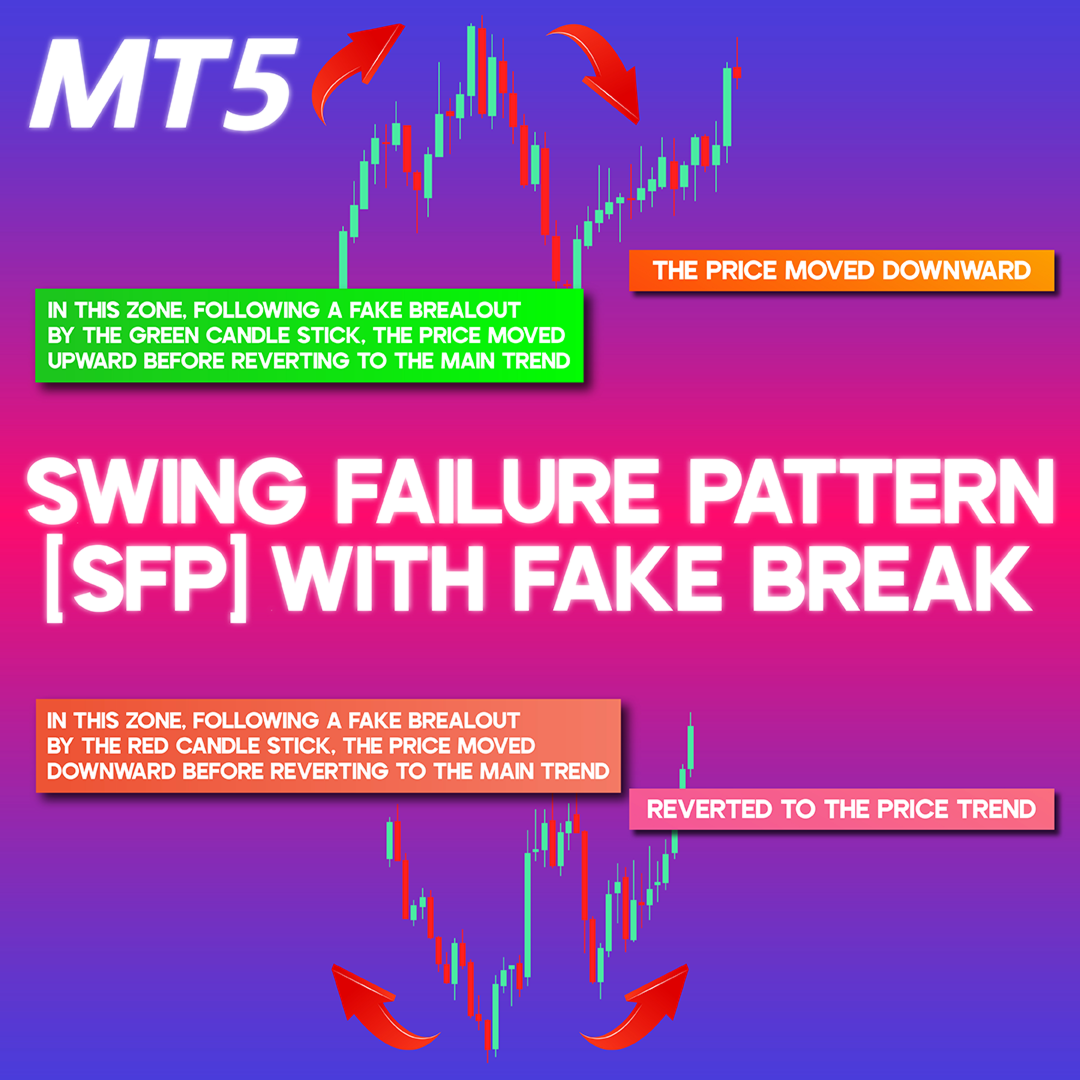
Swing Failure Pattern SFP with Fake Break MT5
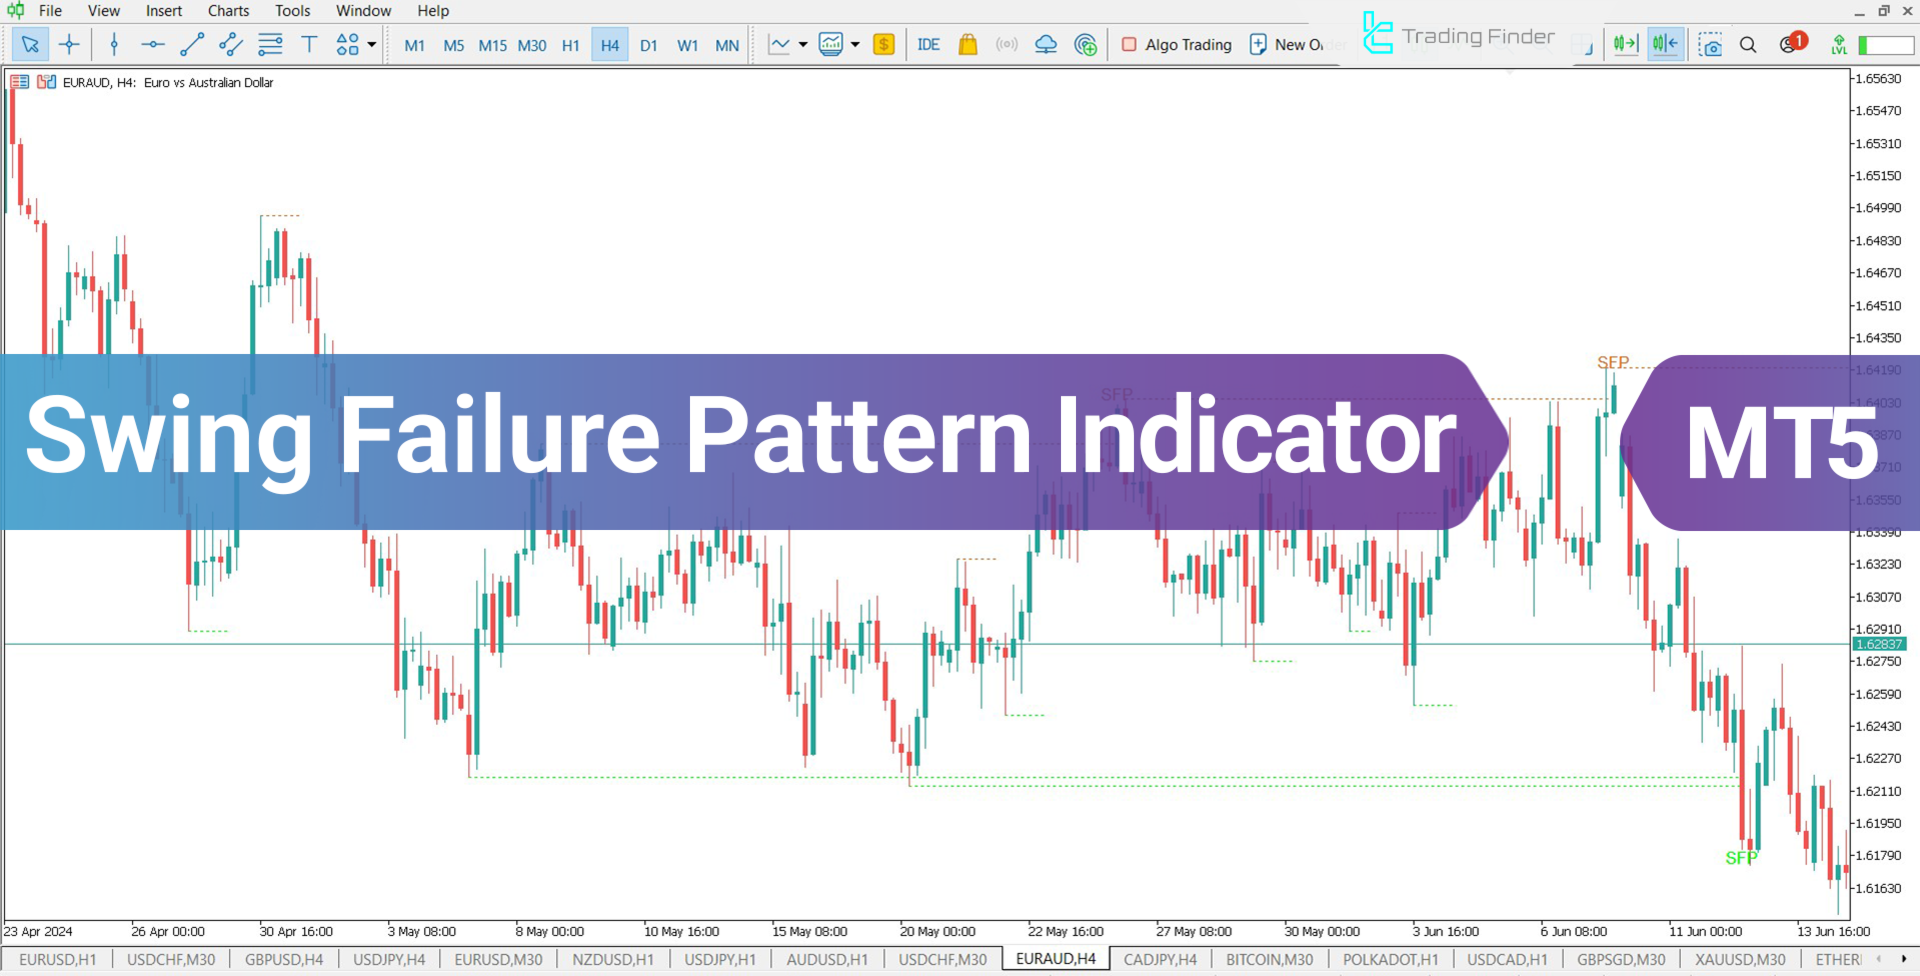
Swing Failure Pattern (SFP) with Fake Break Indicator for MT5
The Swing Failure Pattern (SFP) Indicator in MetaTrader 5 is designed to identify deceptive breakouts in financial markets. This pattern appears when the price momentarily surpasses key levels, such as previous highs or lows, triggering stop-loss orders and liquidity traps. However, instead of continuing in that direction, the price swiftly reverses, signaling a false breakout.
The main function of the SFP pattern is to exploit liquidity accumulation around crucial levels. When the price briefly crosses these points but quickly retreats, it suggests a short-term liquidity grab, misleading traders who anticipated a breakout.
Indicator Specifications
| Category | ICT - Liquidity - Smart Money |
| Platform | MetaTrader 5 |
| Skill Level | Intermediate |
| Indicator Type | Continuation - Reversal |
| Time Frame | Multi Time Frame |
| Trading Style | Intraday Trading |
| Market | Forex - Crypto - Stocks - Commodities |
Indicator Overview
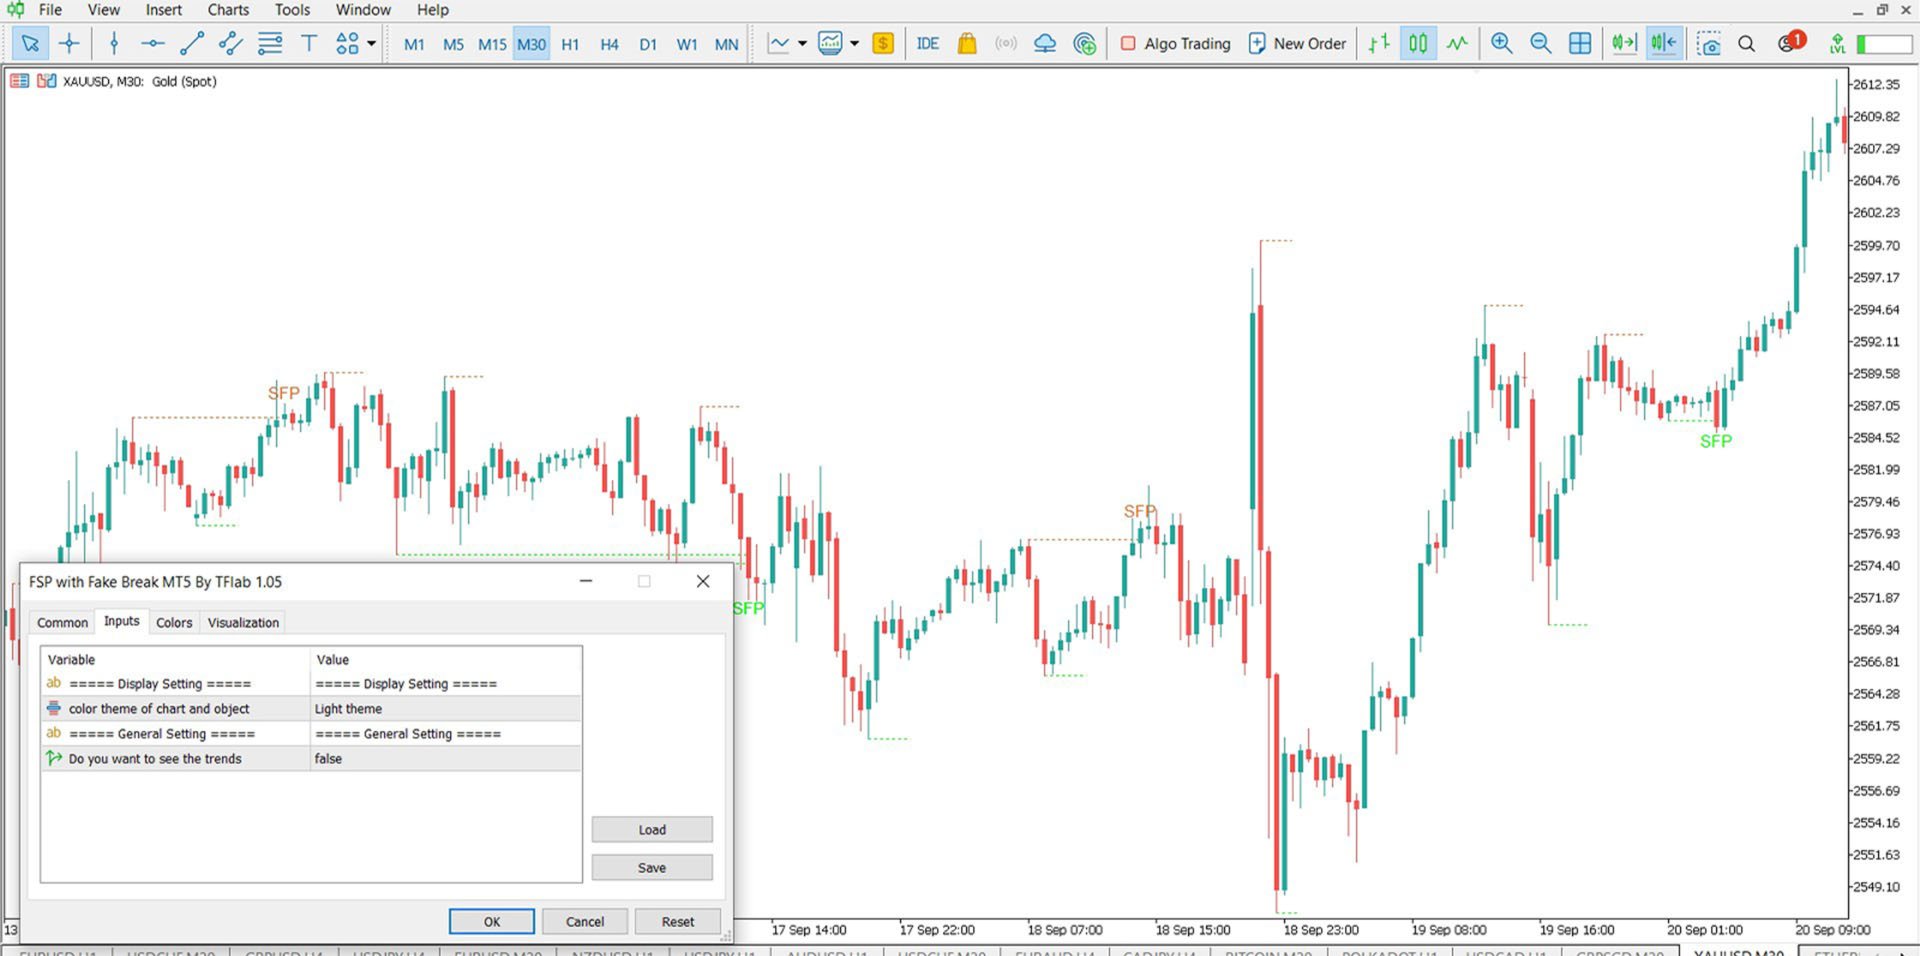
The SFP pattern frequently appears in zones where sharp price reversals are likely, offering traders insight into potential trend shifts. This indicator is particularly valuable for ICT and Smart Money trading approaches, as it accurately highlights SFP setups, helping traders avoid false breakouts and take advantage of trend reversals. The highs are marked in green, while the lows are displayed in red for better clarity.
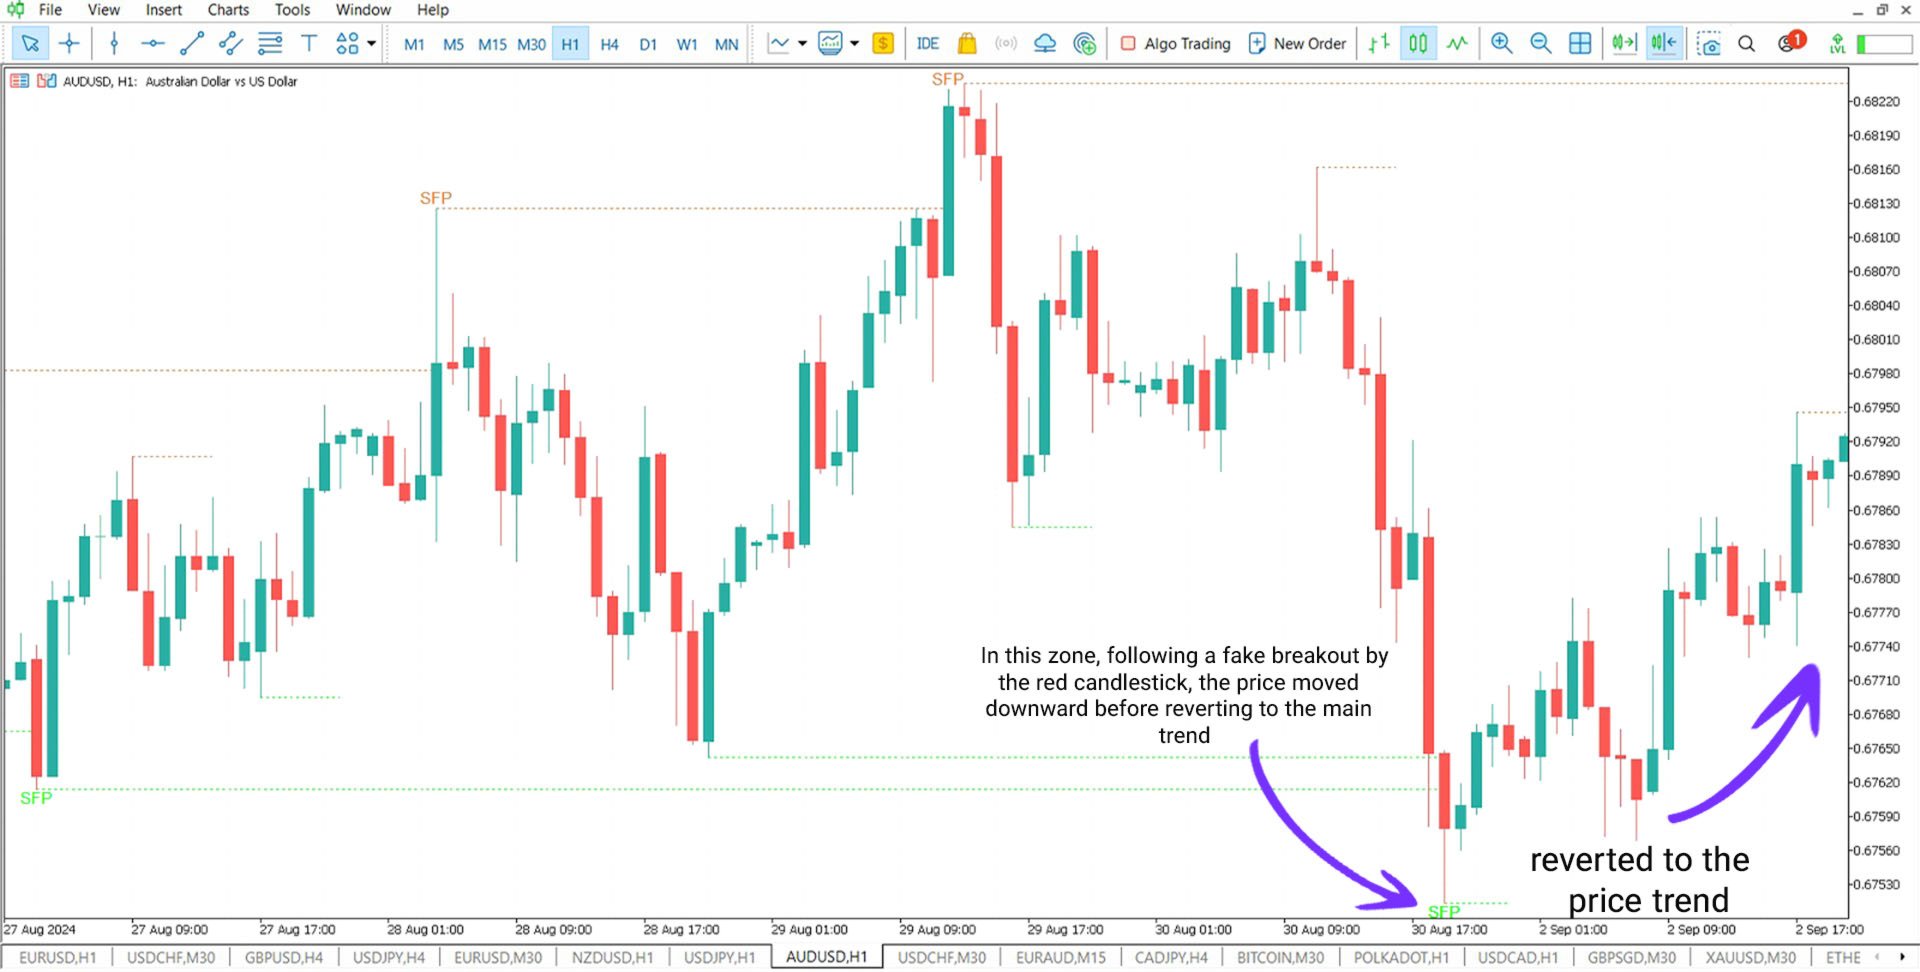
Identifying SFP in an Uptrend
The indicator highlights past reversal zones where the price direction has shifted. For example, on a 1-hour AUD/USD chart, the price initially moves towards liquidity accumulation and stop-loss activation. After a breakout attempt, it fails to sustain the move and returns to its primary trend.
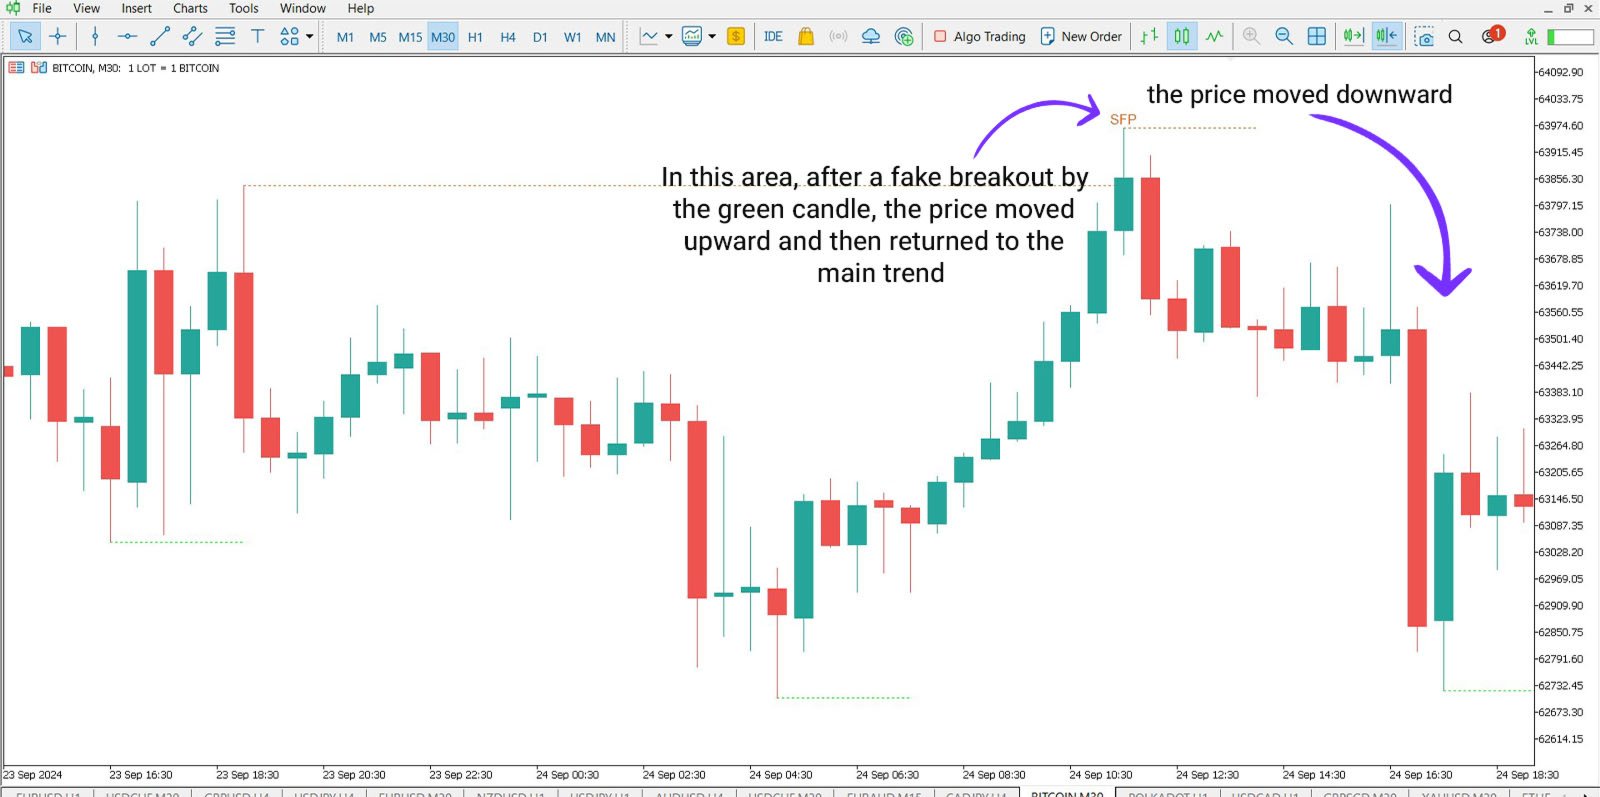
Identifying SFP in a Downtrend
In the 30-minute Bitcoin (BTC) chart shown below, the SFP pattern is clearly visible. The price first attempts a breakout, reaching a key level before forming an SFP high. This liquidity grab then leads to a price correction as the market resumes its original trend.
Indicator Settings
- Chart and object color settings: Adjusts background appearance.
- Trend visibility: Option to display or hide trend direction on the chart.
Conclusion
The Swing Failure Pattern (SFP) Indicator serves as a powerful tool for identifying fake breakouts and potential reversals. By marking these critical points on the chart, traders can avoid misleading signals and optimize trade entries. Whether in bullish or bearish market conditions, this indicator provides essential insights for ICT, Smart Money, and liquidity-based trading methodologies.