Consolidation and Breakout Detector
- 指标
- Parham Vakilizand
- 版本: 1.0
- 激活: 5
Consolidation and Breakout Detector 是一款高级的单时间框架 MT5 指标,专为希望识别盘整区域(区间市场)并捕捉突破机会的交易者设计。
它会自动扫描历史价格走势,识别市场横盘区域,并在有效突破发生时提醒交易者。
此工具适用于突破交易者、趋势跟随者和区间交易者,帮助他们基于价格结构做出明智的交易决策。
🏆 主要功能
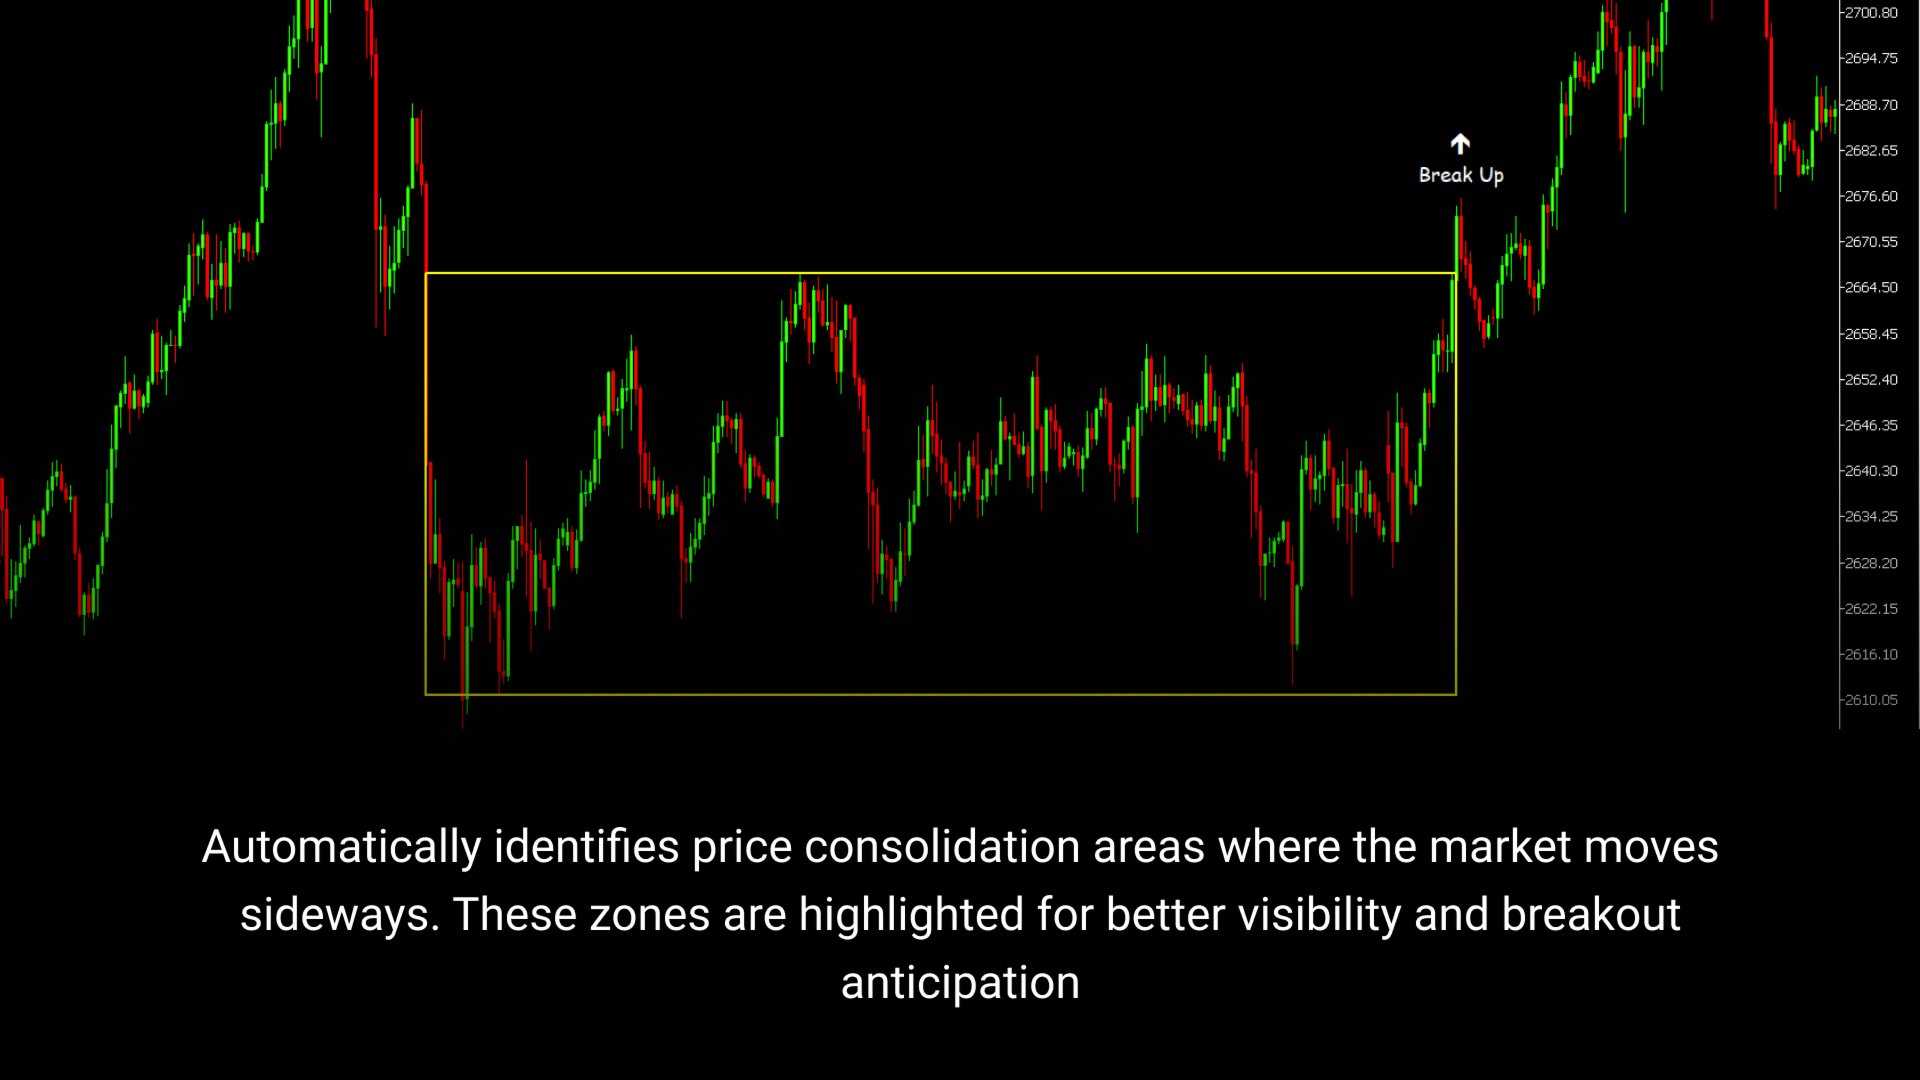
✅ 基于价格走势检测盘整区域
✅ 使用可自定义的标签和箭头高亮显示突破点
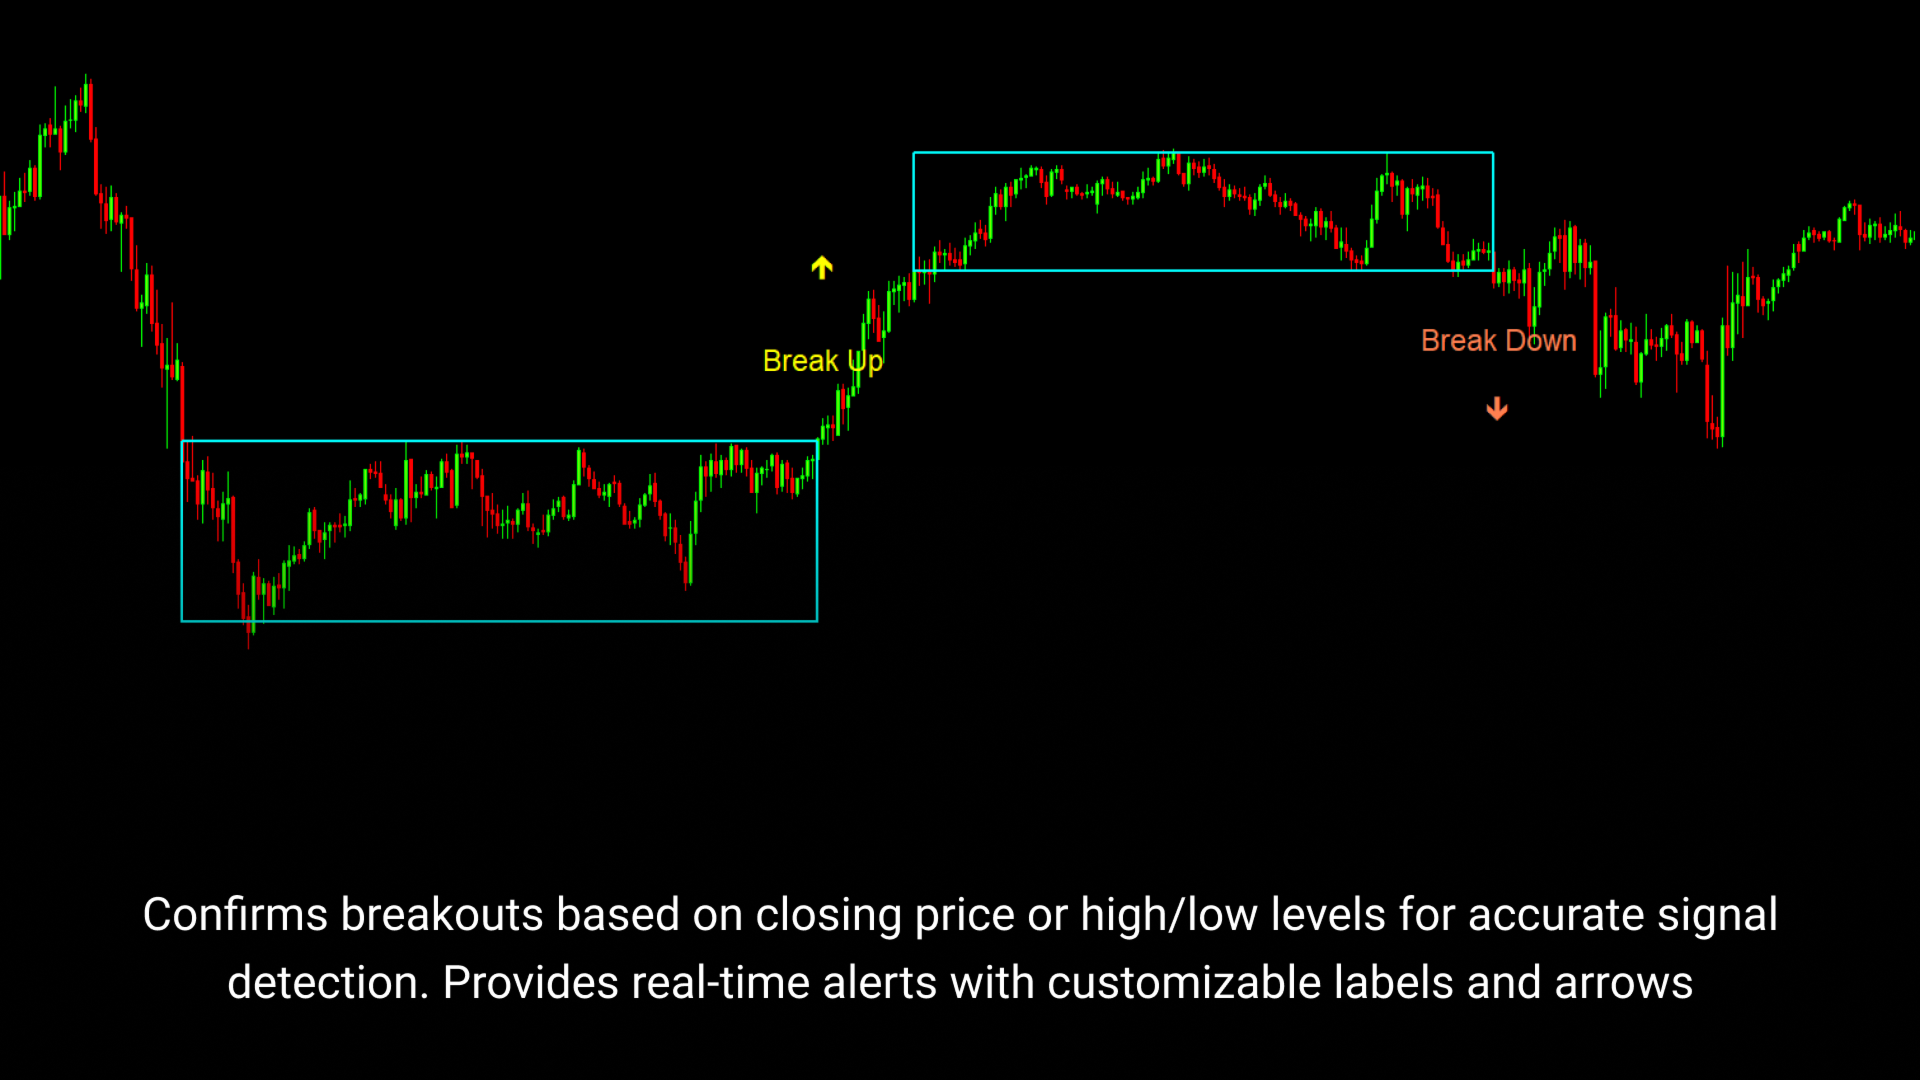
✅ 支持不同的突破确认模式(基于收盘价 & 最高/最低价)
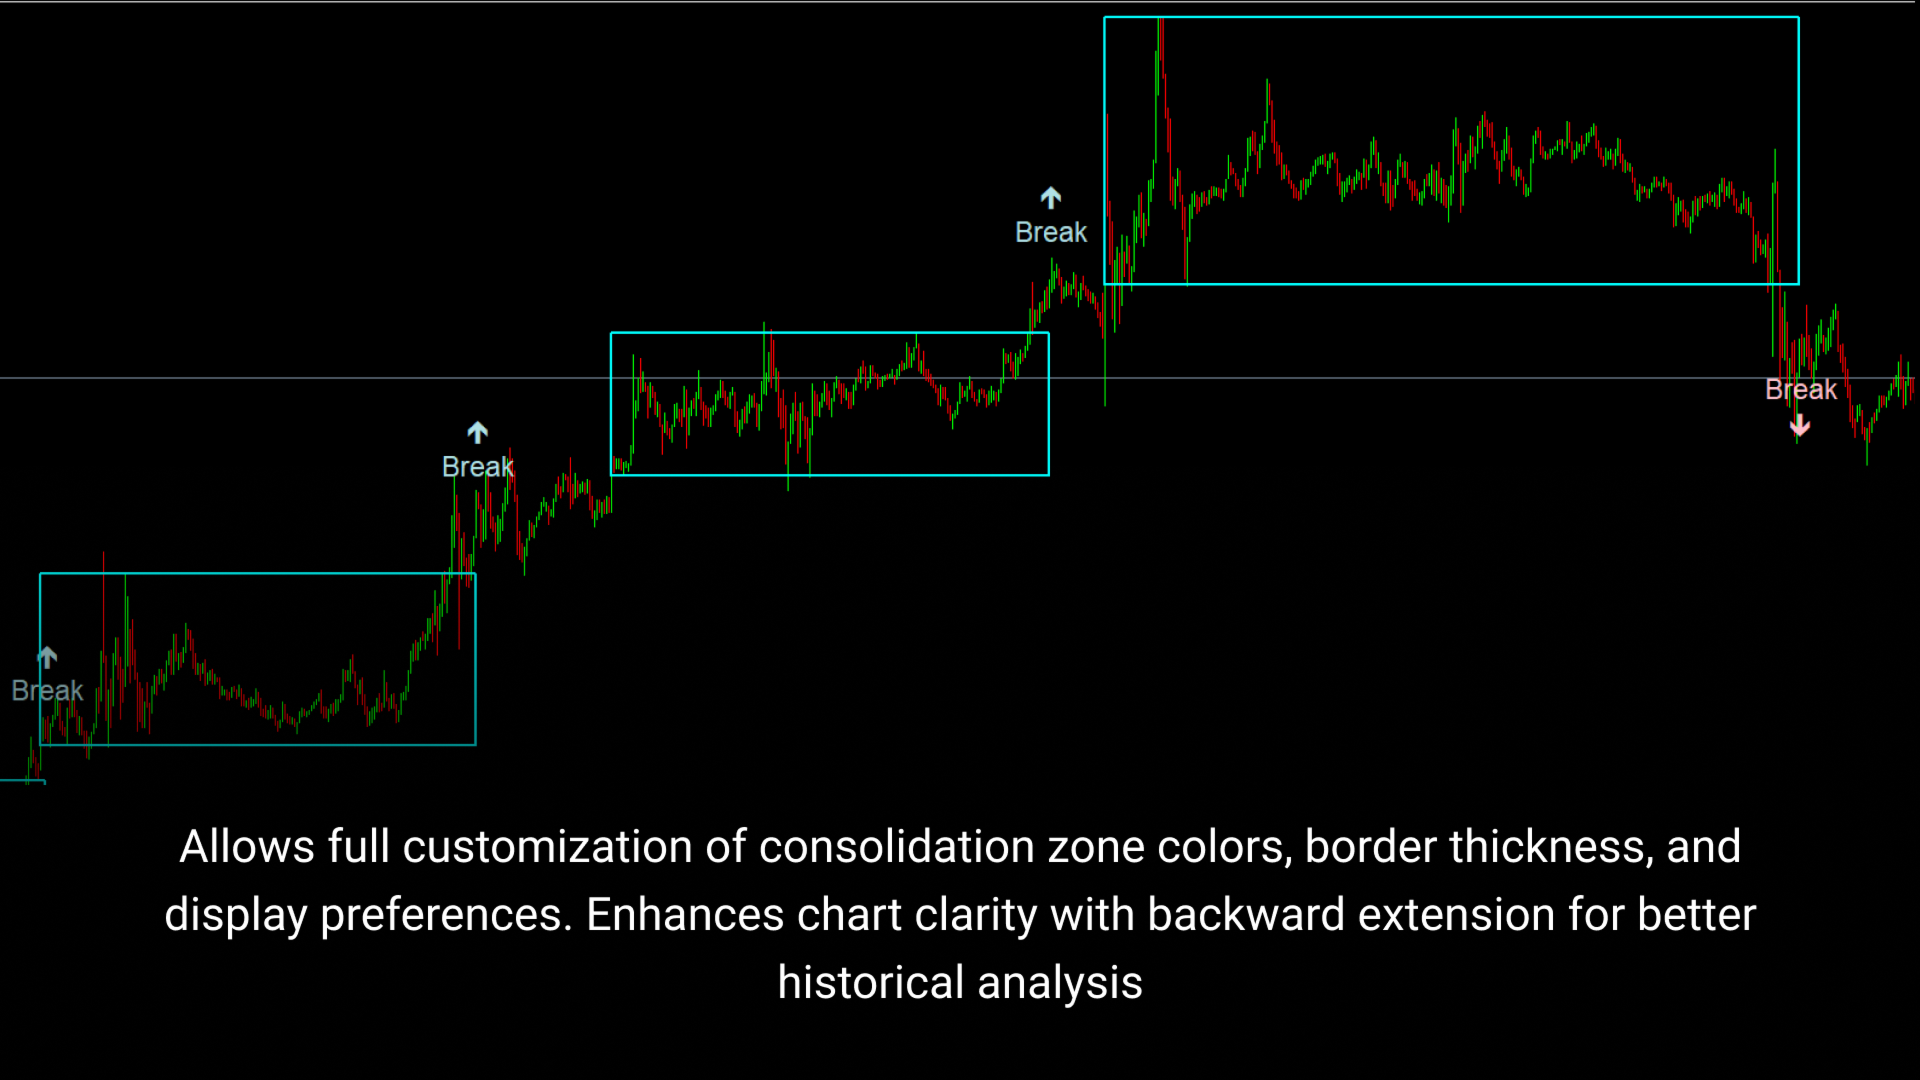
✅ 用可自定义的颜色直观显示盘整区域
✅ 向后扩展:延展历史盘整区域,提供更清晰的分析
✅ 可完全自定义参数,以适应任何交易策略
✅ 适用于所有时间框架和资产(外汇、股票、加密货币、指数等)
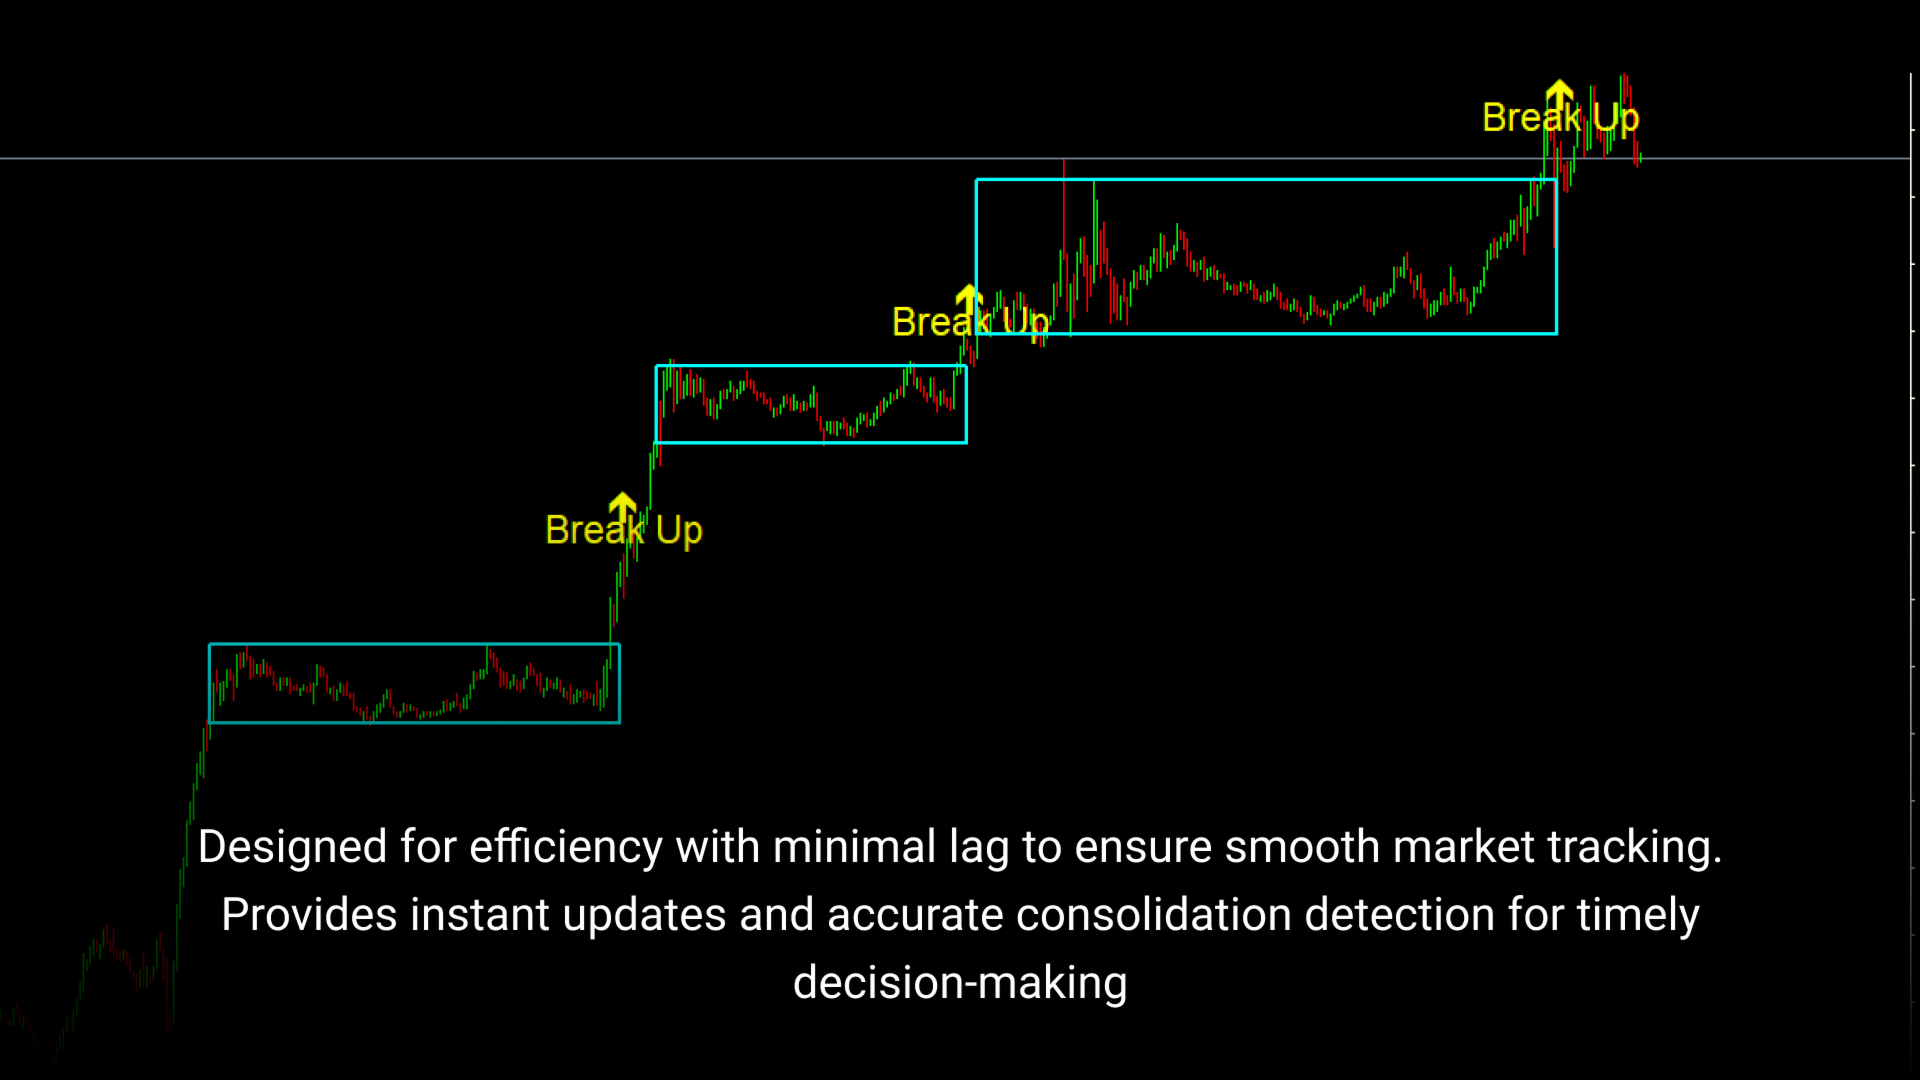
✅ 低延迟,实时市场分析
📊 工作原理
该指标采用结构化流程来检测盘整和突破:
🔍 识别盘整区域
- 扫描 X 根过去的 K 线(根据用户输入的设置)以识别最高点和最低点。
- 如果市场在 Y 根 K 线内保持在一个窄幅区间内,则会形成盘整区域。
- 该区域会用红色矩形标记在图表上(颜色可自定义)。
⚡ 突破确认
- 识别到盘整区域后,指标会等待突破。
- 当价格在一定数量的 K 线外突破区域时,突破被确认。
- 突破可基于以下方式检测:
- 收盘价(更保守的方式)。
- 最高/最低价(更激进的方式)。
👀 视觉提醒
- 如果发生向上突破,会显示绿色标签和箭头。
- 如果发生向下突破,会显示红色标签和箭头。
- 标签和箭头的大小、颜色、字体和位置均可自定义。
⚙ 输入参数 & 自定义选项
该指标提供广泛的自定义选项,允许用户调整盘整和突破检测方法。
🔎 盘整设置
- prd (回溯周期) – 计算最高/最低价时,向前查看的 K 线数量。
- conslen (最小盘整长度) – 形成有效盘整区域所需的最小 K 线数量。
示例:
- 如果 prd = 100 , conslen = 50 ,指标会向前回溯 100 根 K 线,并要求至少 50 根 K 线处于横盘状态,才能形成盘整区域。
💥 突破设置
- breakoutCandles (突破确认 K 线数量) – 突破区域外必须连续出现的 K 线数量。
- breakoutMode (突破确认方式)
- BREAKOUT_CLOSE :当收盘价突破区域时确认突破。
- BREAKOUT_HIGH_LOW :当最高价或最低价突破区域时确认突破。
示例:
- 如果 breakoutCandles = 2 ,则价格必须在区域外至少保持 2 根 K 线,才能确认突破。
🎨 可视化设置
- paintcons – 启用/禁用盘整区域的可视化显示。
- zonecol – 盘整区域的颜色(默认:红色)。
- boxBorderWidth – 盘整区域边框的厚度。
- enableBackwardExtension – 向历史数据延展盘整区域,以便更好地分析。
示例:
- 如果 enableBackwardExtension = true ,指标会分析历史价格走势,并相应调整盘整区域的左边界。
🔡 标签 & 字体设置
- SelectedFont – 选择突破标签的字体(如 Arial, Comic Sans MS 等)。
- LabelFontSize – 调整标签字体大小。
- LabelOffset – 突破标签/箭头相对于 K 线的垂直偏移量。
示例:
- 如果 LabelOffset = 3 ,突破标签会显示在 K 线 3 个点上方。
📌 突破标签 & 箭头
- UpBreakLabel – 向上突破时的标签文本(默认:"Break Up")。
- DownBreakLabel – 向下突破时的标签文本(默认:"Break Down")。
- UpLabelColor / DownLabelColor – 自定义突破标签的颜色。
- UpArrowColor / DownArrowColor – 自定义突破箭头的颜色。
示例:
- 如果 UpBreakLabel = "Bullish Breakout" ,指标会在向上突破时,在 K 线上方显示 "Bullish Breakout" 标签。
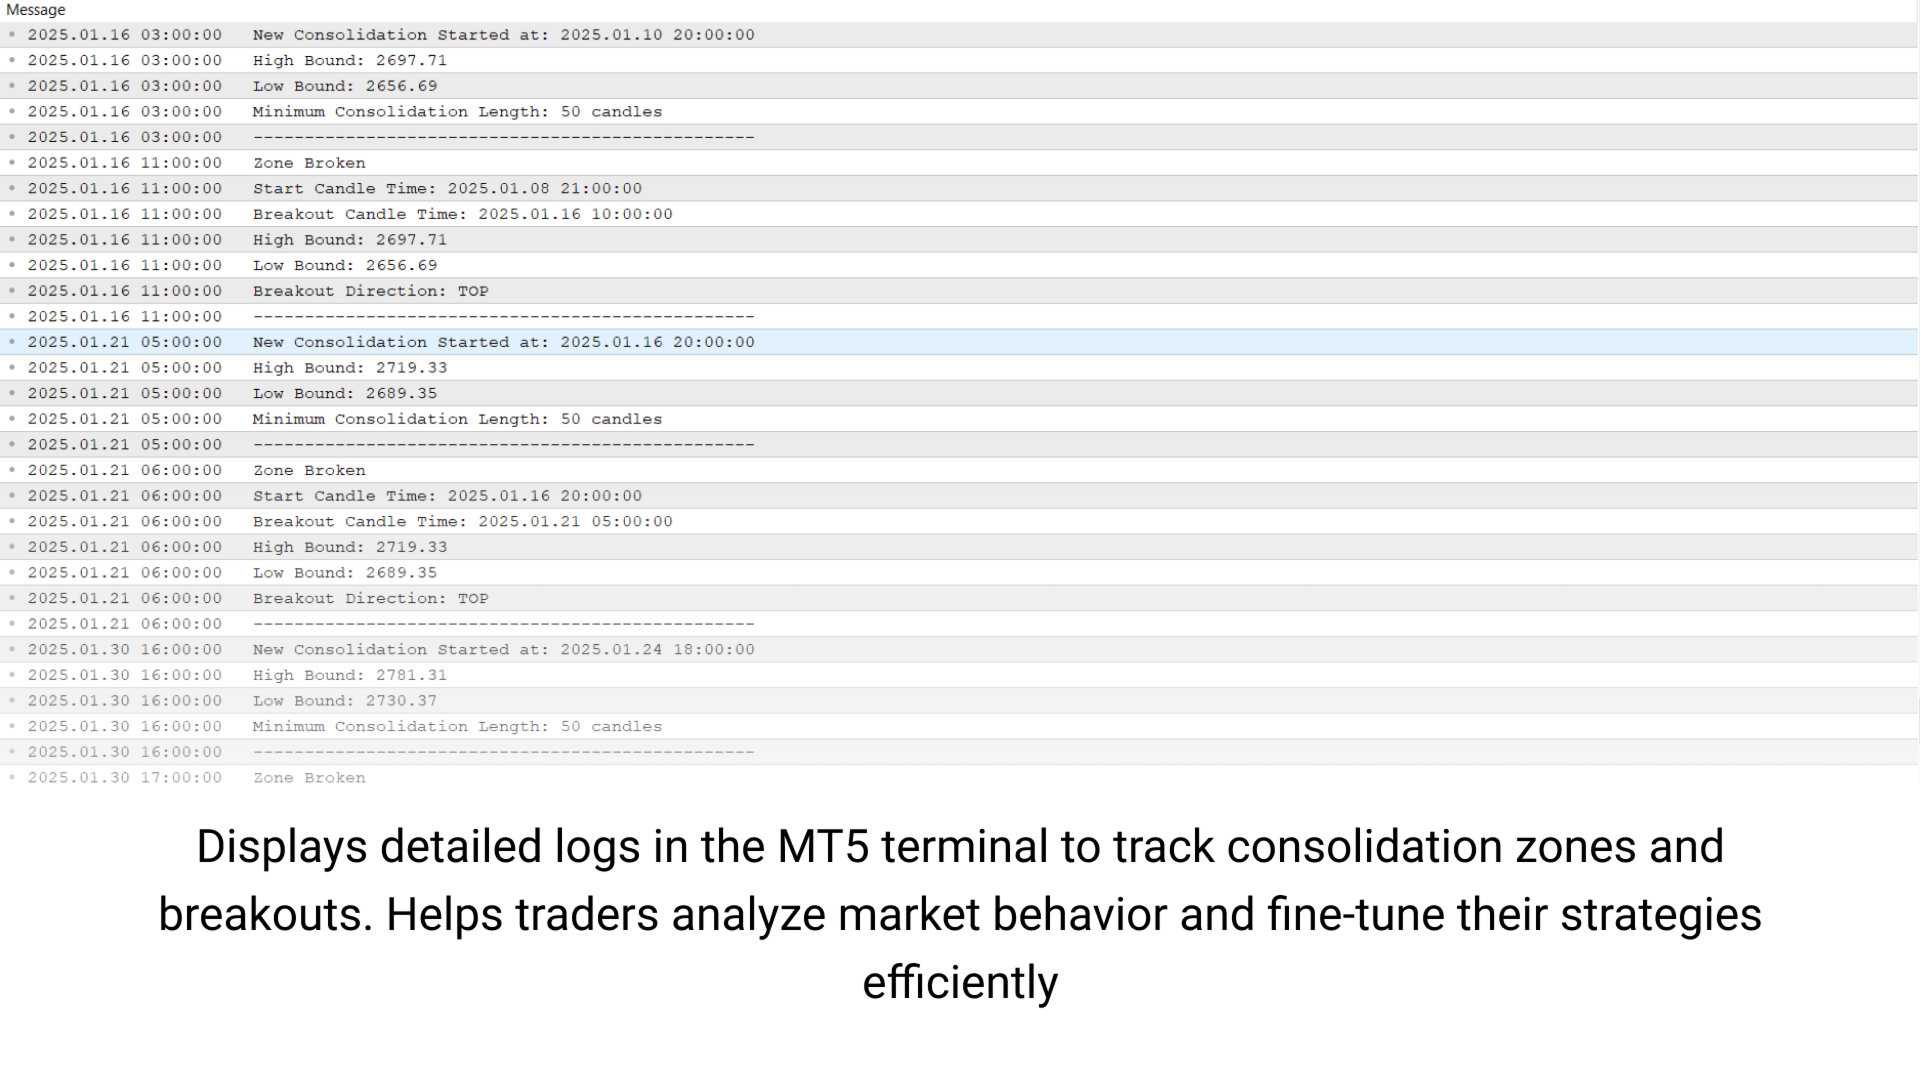
📝 日志记录 & 调试
- enablePrintLogs – 在 MT5 终端打印日志信息,用于调试和跟踪指标运行情况。
示例:
- 如果 enablePrintLogs = true ,MT5 终端将显示如下信息:
- "新的盘整区域在 12:00 识别"
- "区域突破 - 向上突破发生在 14:30"