Fibonacci Trend MT5 Scanner
- 指标
- Duc Hoan Nguyen
- 版本: 2.0
- 更新: 27 二月 2025
- 激活: 10
New tools will be $30 for the first week or the first 3 purchases!
Trading Tools Channel on MQL5: Join my MQL5 channel to update the latest news from me
在波动剧烈的交易环境中,一款功能强大且直观的分析工具可以帮助您迅速抓住机会。Fibonacci Trend Scanner不仅结合了传统Fibonacci指标与SuperTrend功能,而且通过货币对扫描、多周期监控以及当趋势在多头与空头之间转换时的智能提醒,进一步扩大了其应用范围。
See more MT4 version at: Fibonacci Trend MT4 Scanner
See more products at: All Products
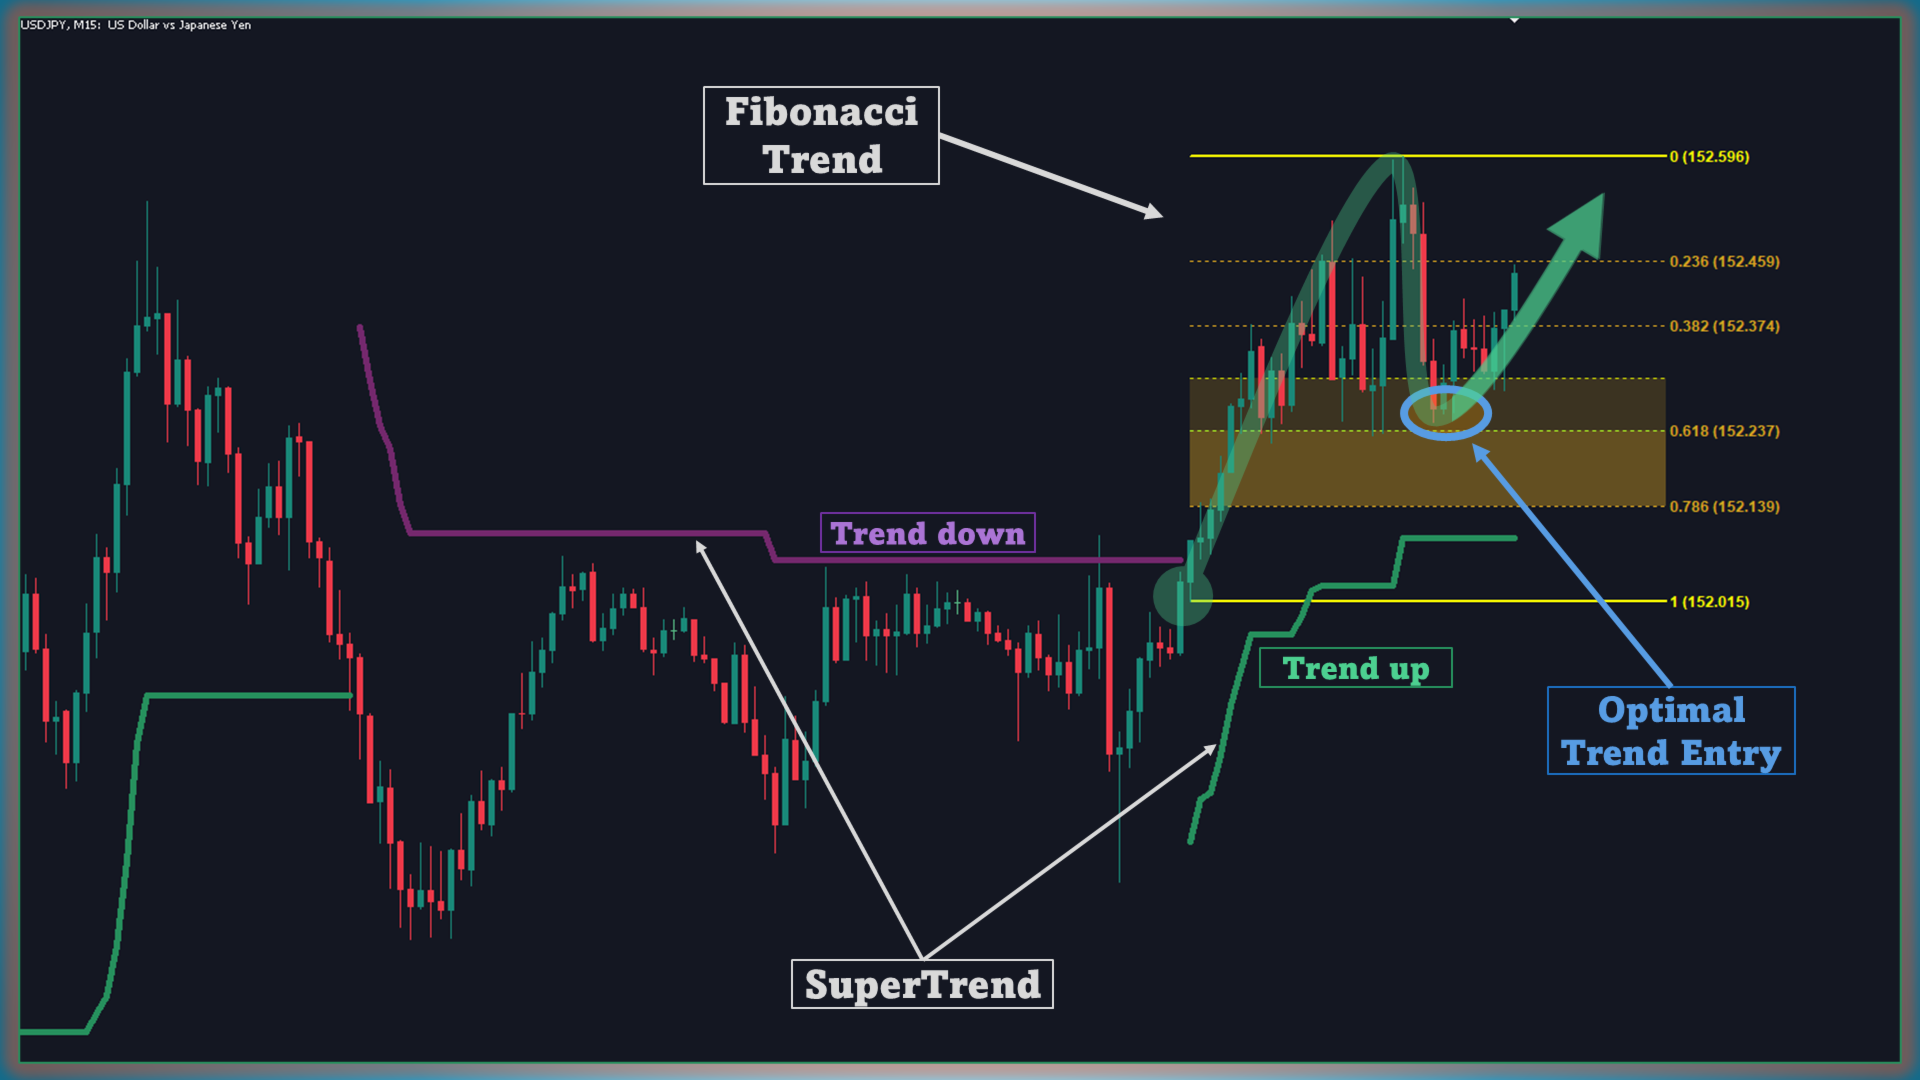
1. 结合SuperTrend技术的趋势分析
Fibonacci Trend Scanner采用SuperTrend算法,可快速准确地识别市场趋势:
- 多头趋势:以绿色显示,帮助您轻松识别买入机会。
- 空头趋势:以紫色标示,提示您可能的卖出信号。
清晰的视觉呈现让您更轻松地跟踪和分析市场趋势,从而及时做出交易决策。
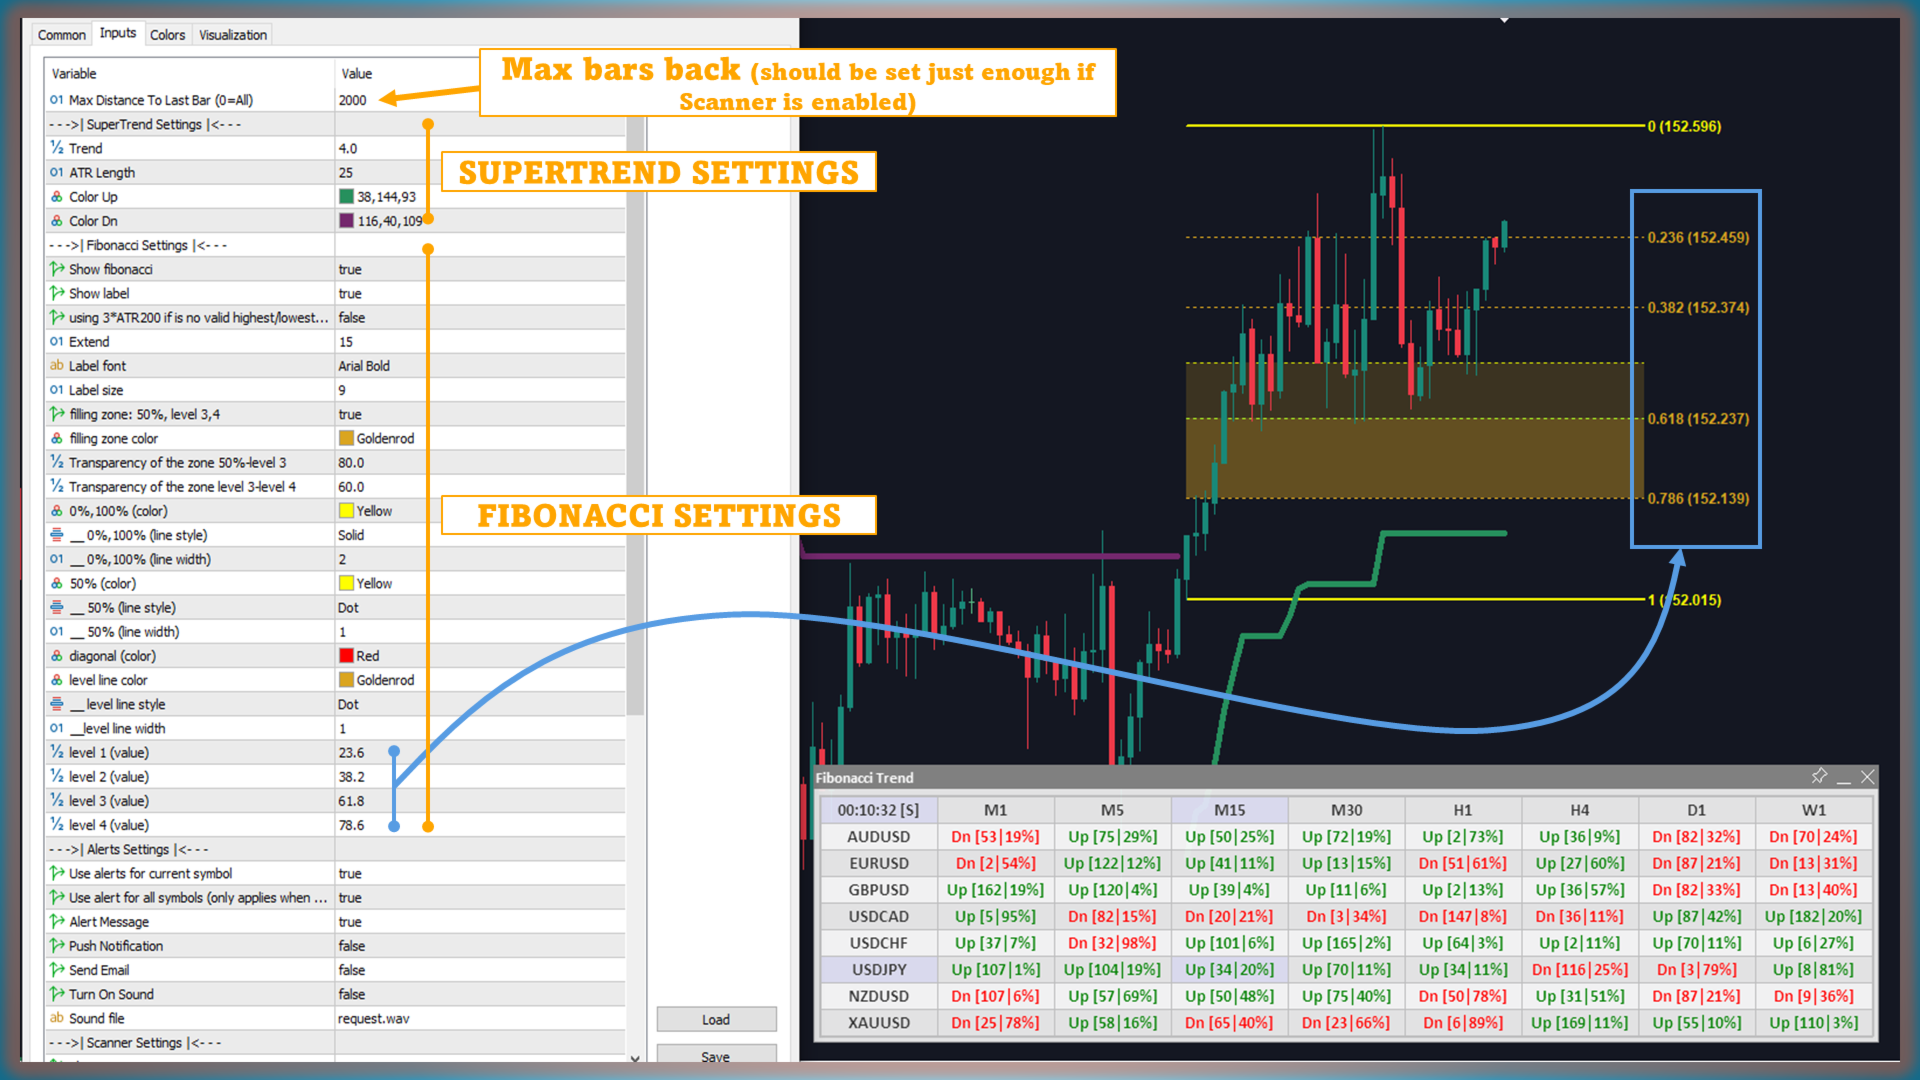
2. 集成Fibonacci——从回调到延伸
Fibonacci Retracement —— 识别关键支撑和阻力位
- 自动计算:根据当前的价格波段,自动计算0.236、0.382、0.618和0.786等Fibonacci水平,帮助您确定重要的支撑和阻力区域。
- 波段价格标注:在高点和低点处标注准确的价格水平,使您的交易分析更加透明。
Fibonacci Extension —— 预测未来价格目标
- 价格目标预测:通过定义延伸水平来预测未来的价格目标,帮助您找到如127.2%和161.8%等潜在的盈利区域。
最佳入场区域
- Golden Zone:当市场回调时,0.618与0.786区间的高亮区域为您提供了理想的入场点。
- 斜向趋势线:连接波段高低点的虚线,为您全面呈现当前趋势的力度。
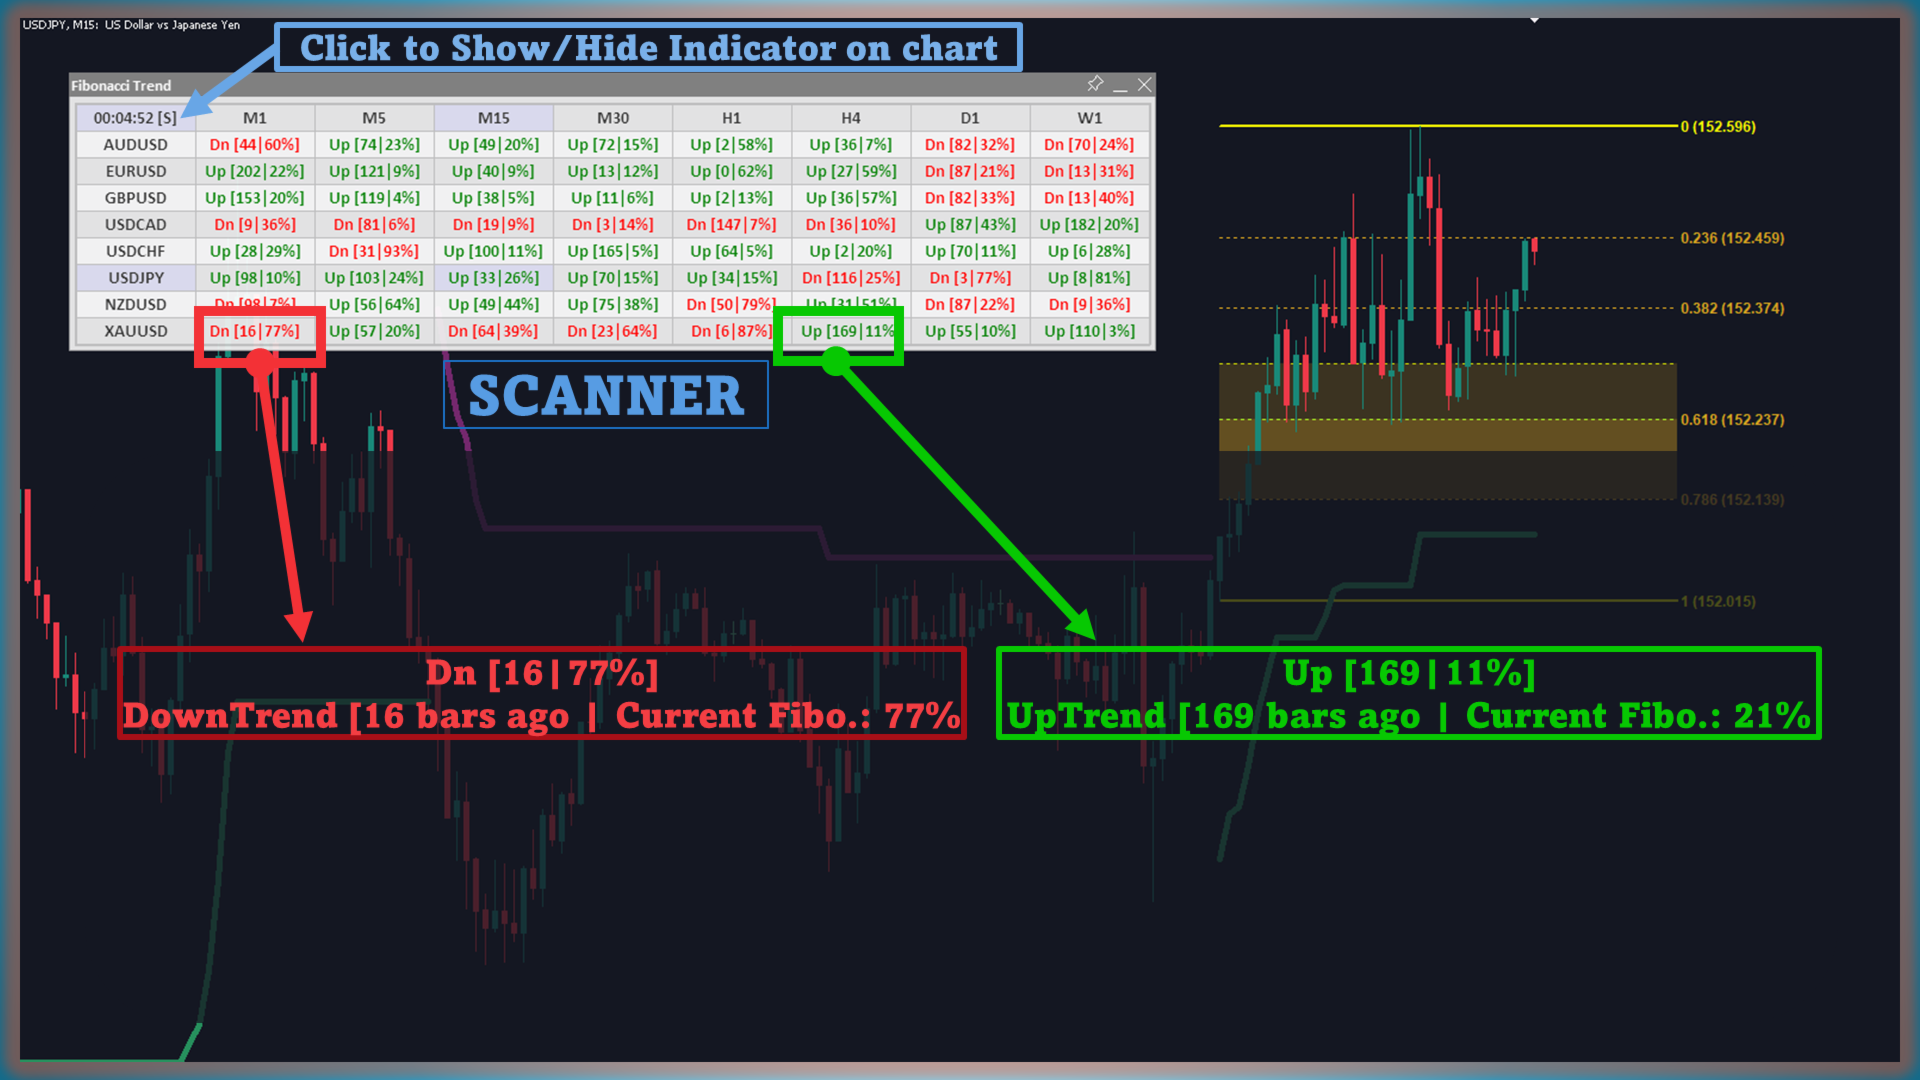
3. 货币对扫描 & 多周期监控——全面把握市场
Fibonacci Trend Scanner的一大优势在于自动扫描功能:
- 货币对扫描:可同时追踪多种货币对,确保您不会错过任何市场机会。
- 多周期分析:从短期到长期监控多种周期,既能纵览整体行情,又可细看局部走势,从而提高决策的精准度。
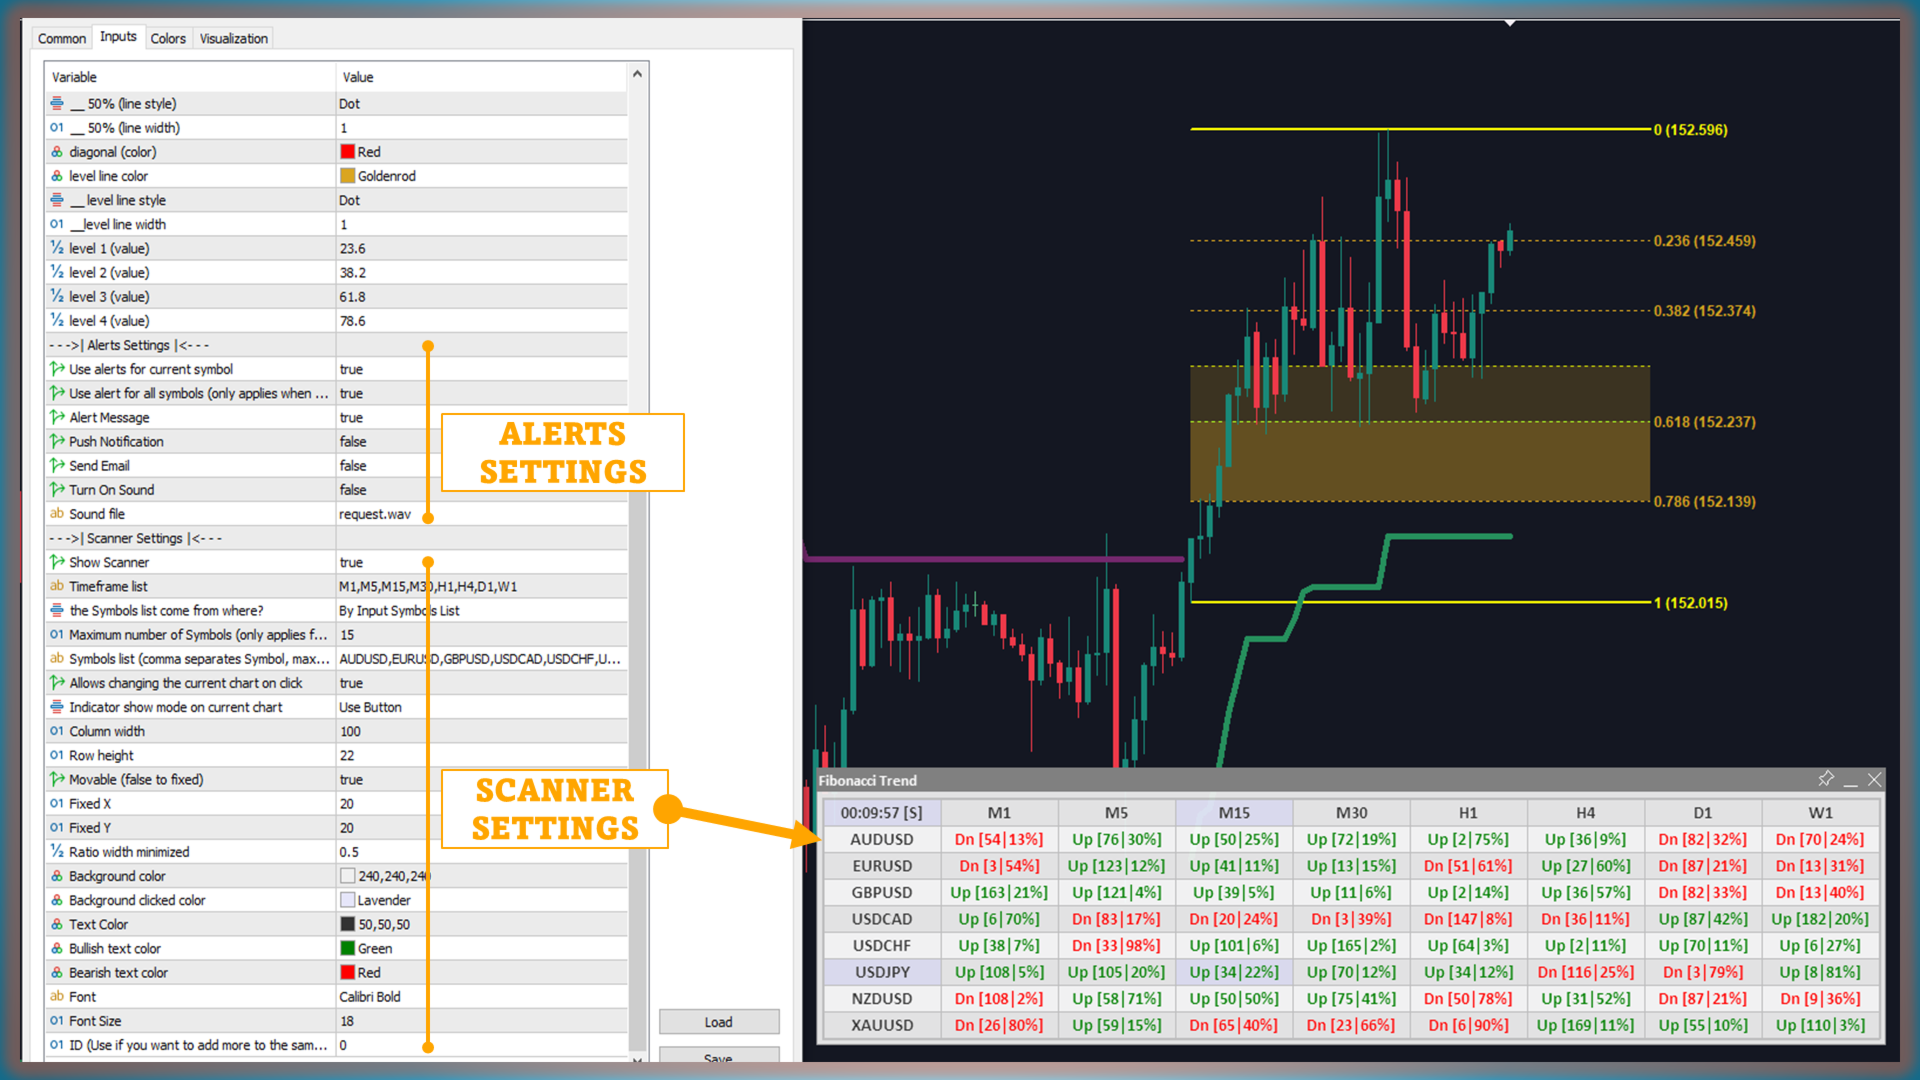
4. 智能提醒系统——及时掌握趋势变化
该工具配备智能提醒系统,让您时刻保持信息更新:
- 趋势转换提醒:当市场由多头转为空头或由空头转为多头时,会立即向您发送通知,让您可以提前调整交易策略,优化进出场时机。
5. 在交易策略中的应用
确定入场点
- 趋势交易:当市场显示明显趋势时,等待价格回调至0.618–0.786区间再入场,以便最大化盈利潜力。
- 支撑/阻力定位:利用Fibonacci回调水平来确定合适的入场点或设置止损。
预测价格目标
- Fibonacci Extensions:基于当前波段预测未来的价格目标,支持您的盈利策略。
风险管理
- 设置止损:使用Fibonacci水平或波段高低点作为止损参考,以应对意外的市场逆转。
- 及时提醒:通过智能提醒系统,及时调整交易策略,以减少风险并提高收益。
总结
Fibonacci Trend Scanner是一款集Fibonacci指标与SuperTrend技术、自动货币对扫描、多周期监控以及趋势转换智能提醒于一身的综合性工具。凭借这些高级功能,无论是新手还是资深交易者,都能更有效、更安全地把握市场机遇。