Previous High Low Levels
- 指标
- Artur Alves De Carvalho
- 版本: 1.0
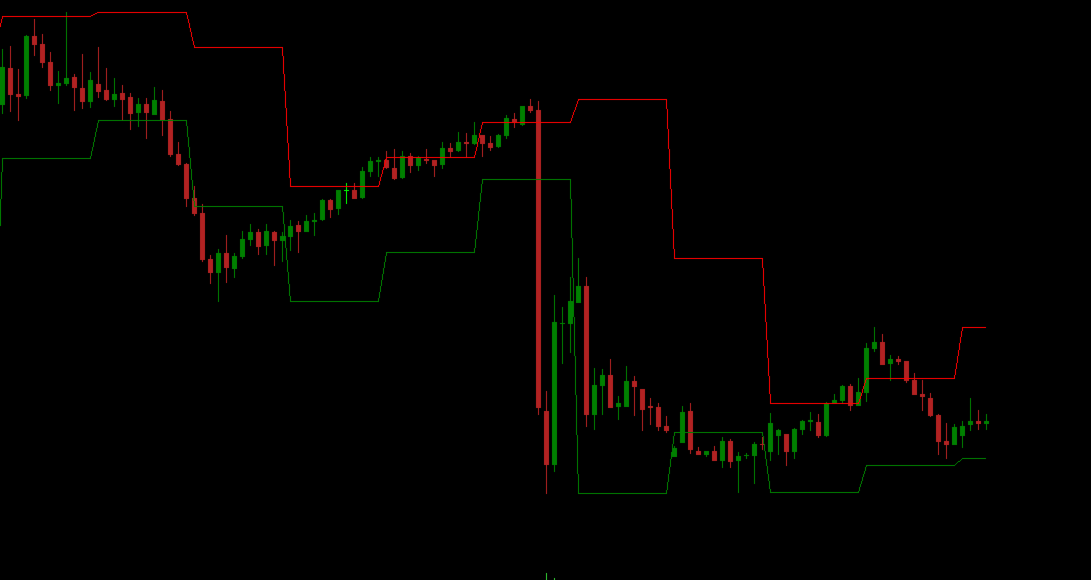
The Previous High Low Levels indicator displays the high and low of the previous candle from a selected higher timeframe. This helps traders identify key support and resistance zones while trading on lower timeframes.
🔹 Features:
✅ Plots the previous high and low from a higher timeframe
✅ Works on all timeframes and instruments
✅ Helps identify strong support and resistance levels
✅ Lightweight and does not repaint
🎯 How to Use:
- Select a higher timeframe (e.g., H1, H4, D1) in the settings.
- The indicator will automatically draw the previous high and low from that timeframe onto your chart.
- Use these levels to spot breakouts, reversals, and market structure shifts.
用户没有留下任何评级信息