• 概述
  • 评论
  • 评论

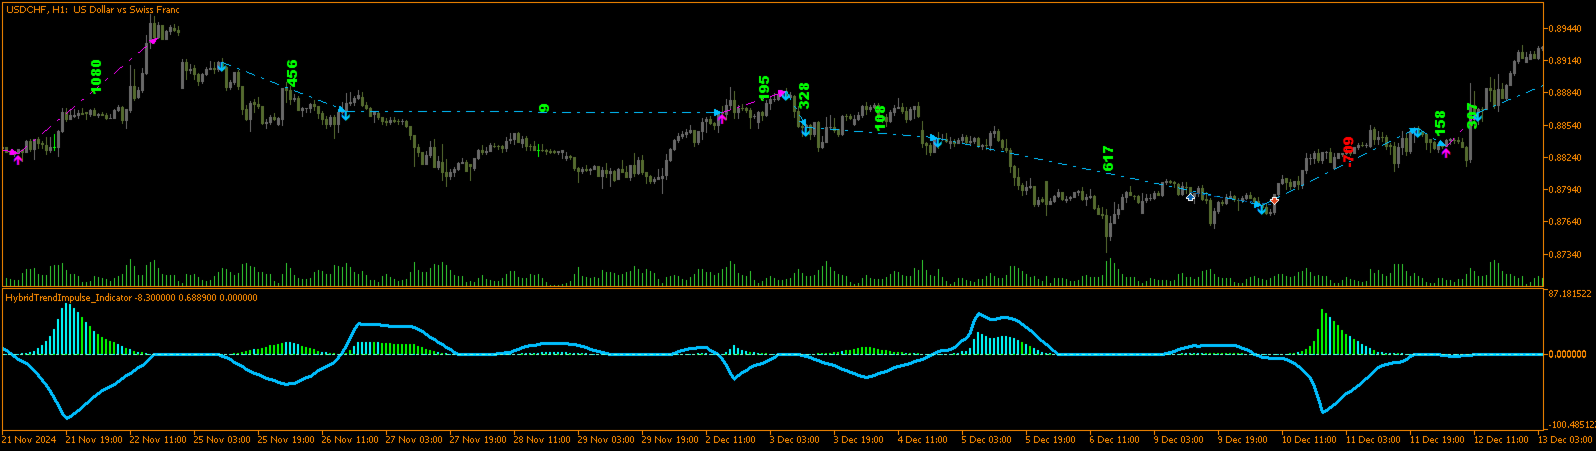
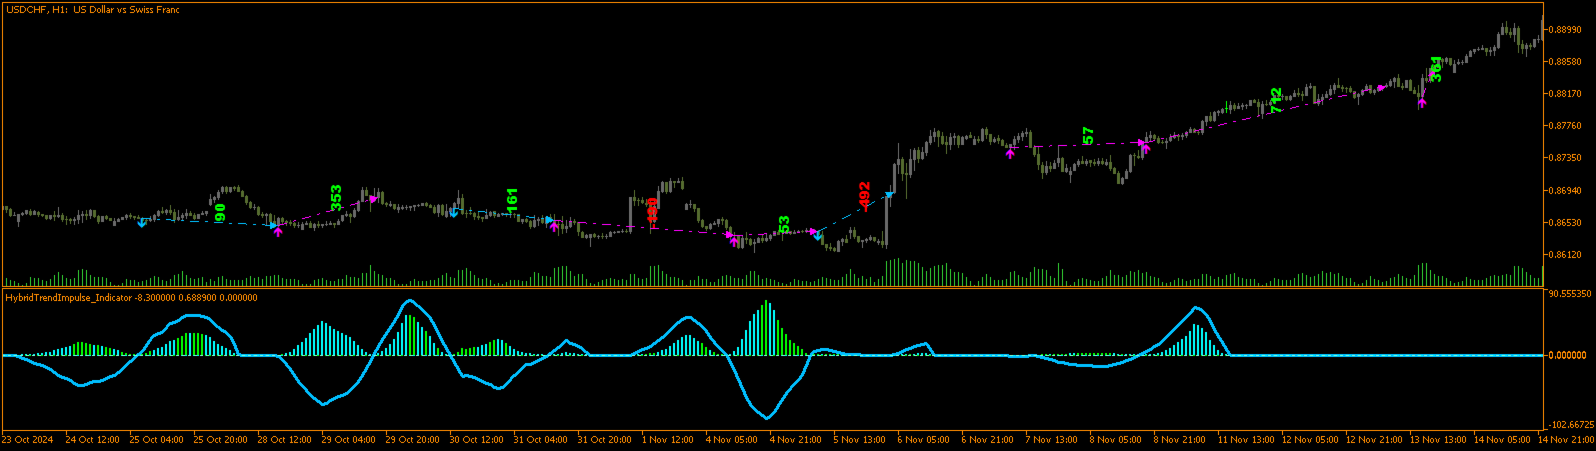
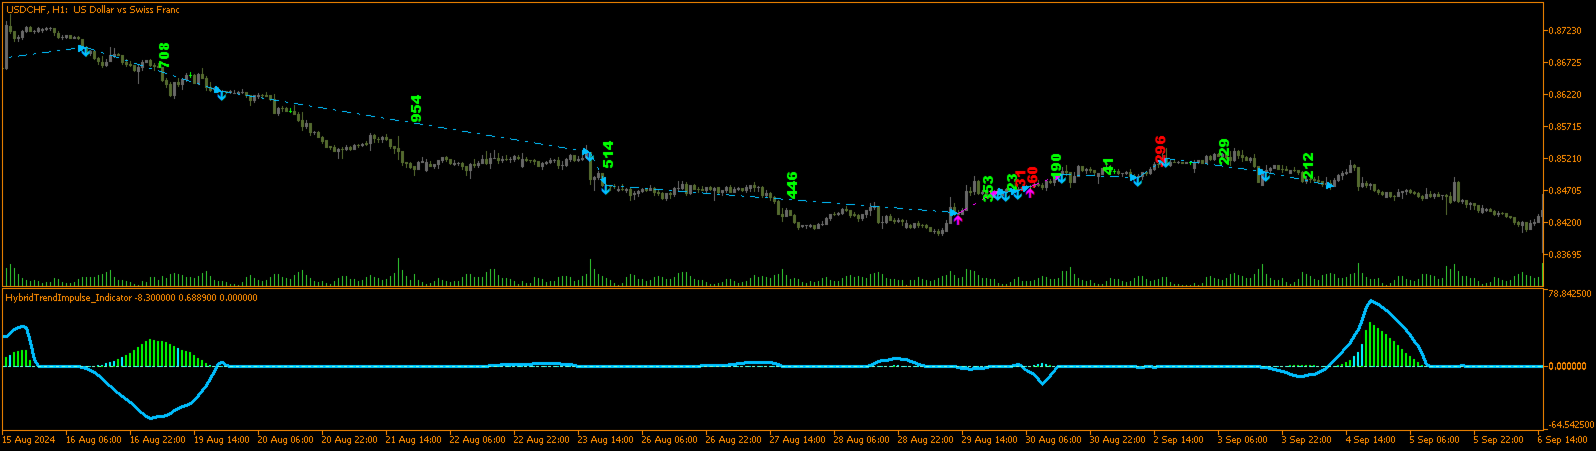
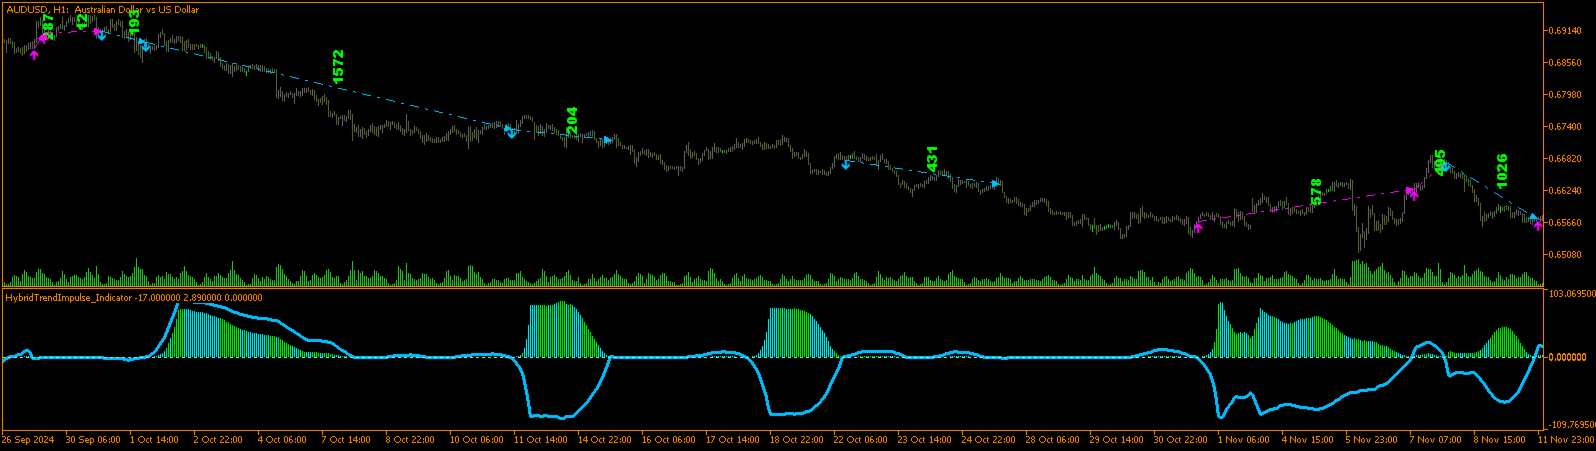
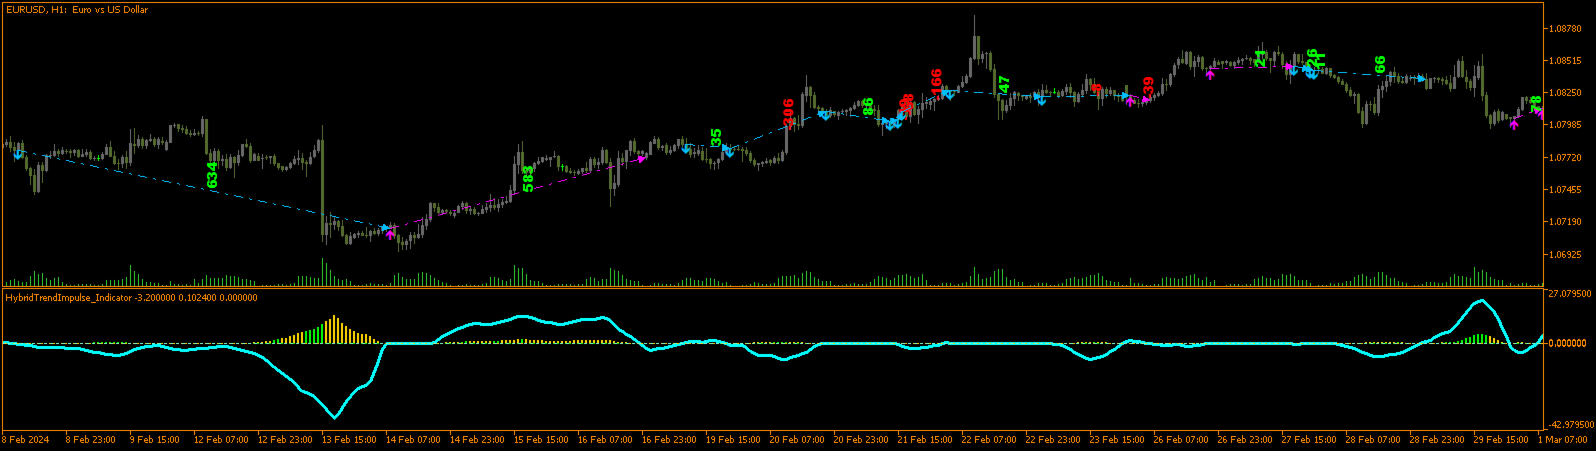
Hybrid trend impulse indicator

The Hybrid Trend Impulse indicator is an advanced tool that combines modern approaches to trend and impulse analysis, offering unique capabilities for effective deposit management.

Key advantages of the HybridTrendImpulse_indicator:
  • Nonlinear dynamics: The method of interaction between opening prices forms a unique nonlinear model that is particularly sensitive to significant price fluctuations, increasing their significance and making the indicator ideal for working in high volatility conditions.
  • Enhanced visualization of volatility: By amplifying the amplitude of oscillations through the product of opening prices, the indicator allows you to clearly see periods of increased volatility and find optimal entry and exit points.
  • Resistance to random movements: Normalization of time series eliminates random fluctuations, providing a reliable representation of the current market situation. This technique is similar to moving averages but takes into account the nonlinearity of the original data.
  • Quick response to changes in dynamics: Comparing current and past price values enables the indicator to instantly track changes in market trends, helping to spot trend reversals in a timely manner.
  • Flexible settings: The ability to choose a currency pair with a low spread and a medium-term market interval makes the indicator a versatile solution for different trading styles and time horizons.
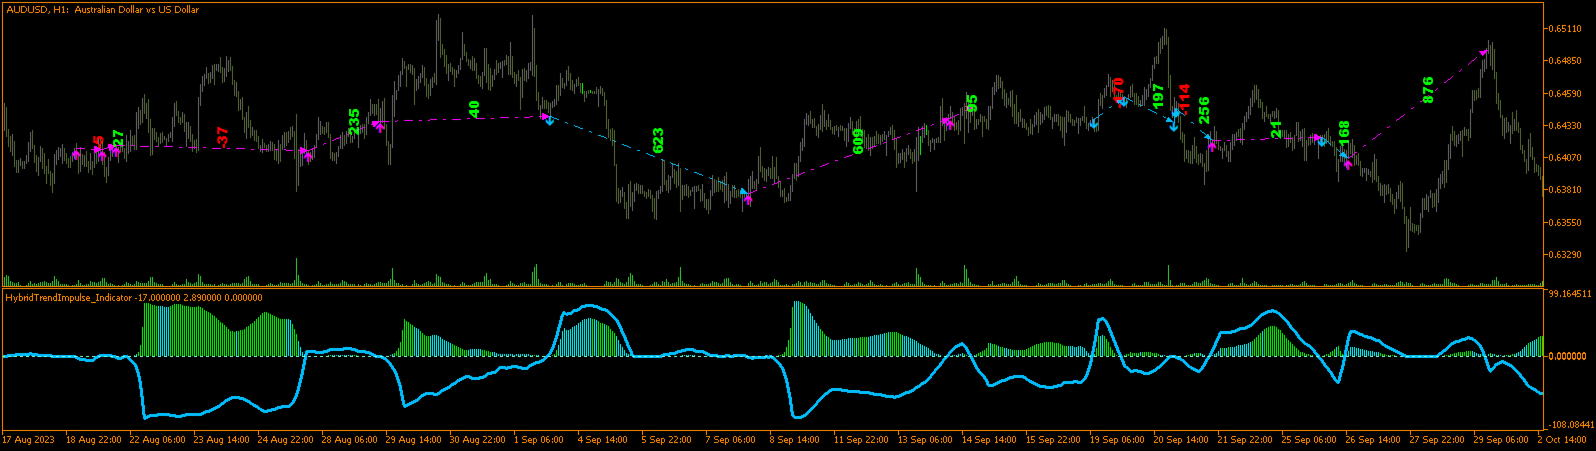
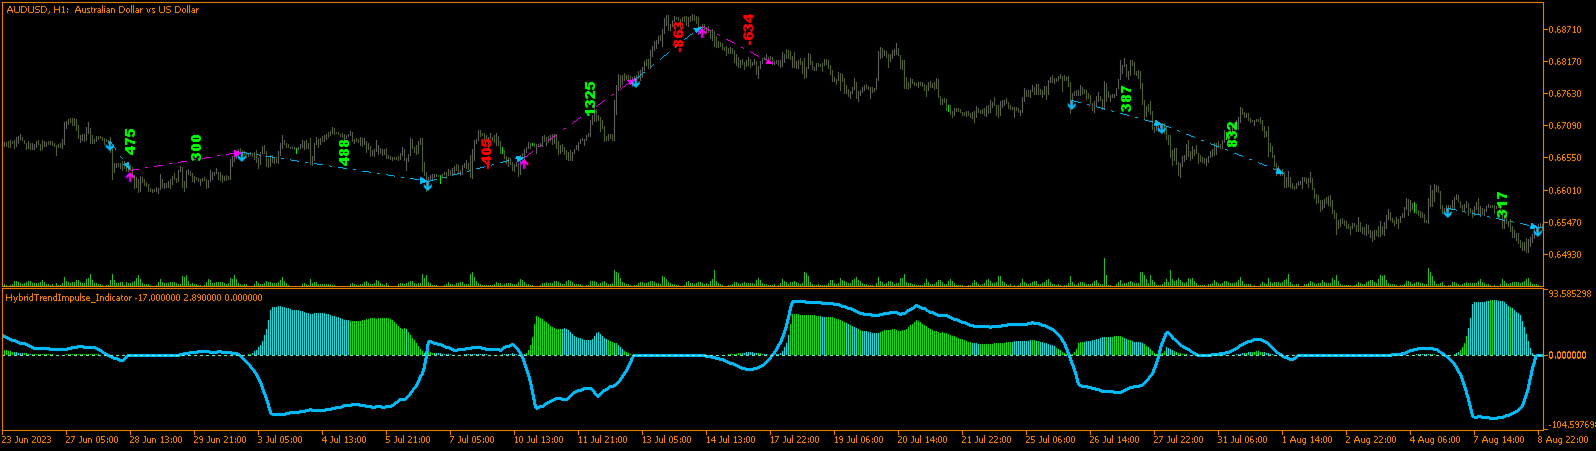
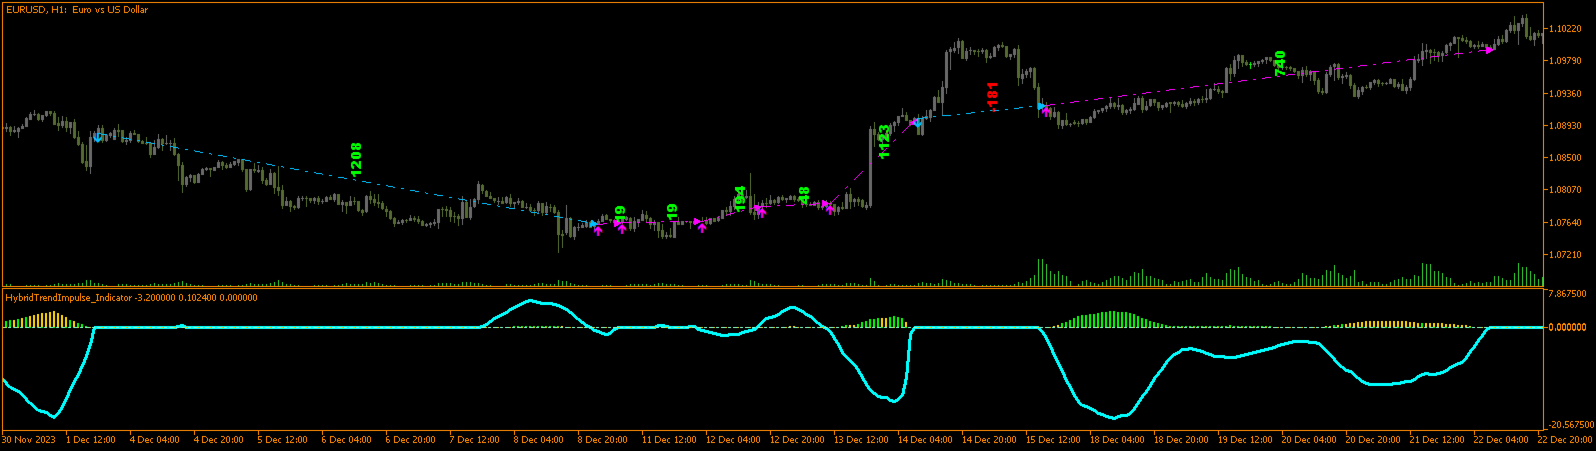
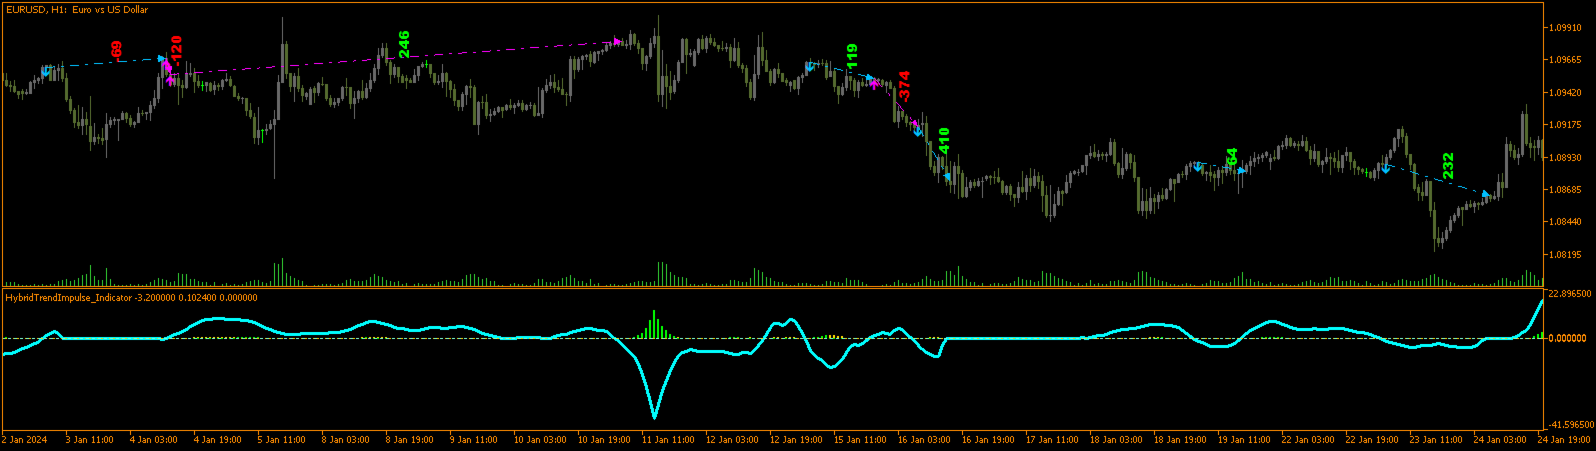
  • This universal tool will allow you to effectively analyze markets and make informed decisions based on signals. Flexible settings for  pairs (EURUSD, USDCHF, AUDUSD) and timeframes (M30, H1, H2, H3) make the Hybrid Trend Impulse indicator suitable for a wide range of trading situations.
Try out the HybridTrendImpulse_indicator and evaluate its potential in practice!


推荐产品
Advanced 4xZeovo MT5 Indicator (MetaTrader 5)   Product Description  4xZeovo is a powerful trading indicator system monitoring 24/7 financial markets. Metatrader5 tool designed to find the best buying/selling opportunities and notifies the user.    Making life easy for traders in helping with the two most difficult decisions with the use of advanced innovate trading indicators aiming to encourage users to hold the winning positions and take profit at the best times.    Equipped with a unique tra
Introduction to Smart Renko The main characteristics of Renko Charting concern price movement. To give you some idea on its working principle, Renko chart is constructed by placing a brick over or below when the price make the movement beyond a predefined range, called brick height. Therefore, naturally one can see clear price movement with less noise than other charting type. Renko charting can provide much clearer trend direction and it helps to identify important support and resistance level
The "RMA Signal Indicator MT5" refers to an indicator called "RMA" (Running Moving Average) Signal Indicator designed specifically for the MetaTrader 5 (MT5) trading platform. The RMA is a variation of the Moving Average indicator that emphasizes recent price data. The specific details and functionality of the "RMA Signal Indicator MT5" may depend on the developer or the version you are using. However, in general, here is a general approach to using a signal indicator like RMA on the MT5 platfor
All about time and price by ICT. This indicator provides a comprehensive view of ICT killzones, Silver Bullet times, and ICT Macros, enhancing your trading experience.  In those time windows price either seeks liquidity or imbalances and you often find the most energetic price moves and turning points. Features: Automatic Adaptation: The ICT killzones intelligently adapt to the specific chart you are using. For Forex charts, it follows the ICT Forex times: In EST timezone: Session: Asia: 20h00-0
Trend Direction ADX indicator for MT5
Renaud Herve Francois Candel
Trend Direction ADX indicator Trend Direction ADX is part of a serie of indicators used to characterize market conditions. Almost any strategy only work under certain market conditions. Therefore it is important to be able to characterize market conditions at any time: trend direction, trend strength, volatility, etc.. Trend Direction ADX is an indicator to be used to characterize trend direction: trending up trending down ranging Trend Direction ADX is based on ADX standard indicator. Tre
Smooth price for Monarch
Konstantin Gruzdev
5 (1)
The Smooth Price technical indicator is used for plotting a smoothed line as close to the price of the financial instrument as possible, and serves to eliminate its noise components. The indicator is part of the Monarch trading system, but here it is presented as an independent technical analysis tool. The indicator is based on the cluster digital filter , which, unlike the ClusterSMA , is applied directly to the price time series. Smooth Price does not redraw (except the very last, zero bar) an
R trend sync indicator
Ekaterina Saltykova
r-Trend Sync indicator is manual trading system for extra volatility markets. Main System features : The indicators's algorithm is based on the analysis of an extensive array of historical data (from 1995 for EURUSD & EURJPY and from 2004 for XAUUSD), which ensured the identification of general patterns in the behavior of these pairs across a wide range of timeframes. The analysis of historical data helped the system learn to recognize market triggers for medium-term trends and cycles, as well a
Basic information. To perform its work, the indicator takes data on volumes from a lower timeframe, builds Market Profiles for a higher timeframe and a histogram for the current timeframe. The indicator starts in several stages. In this case, messages like: "Build Source & Target TF. Step: …" are output to the log. The process can be accelerated by changing the input parameter Milliseconds between steps - the initialization speed. The final value of this parameter is always individual and is set
Naked Forex Big Shadow indicator for MT5
Renaud Herve Francois Candel
5 (1)
Naked Forex Big Shadow Indicator Big Shadow Indicator is a pattern recognition indicator for Forex, Stocks, Indices, Futures, Commodities and Cryptos. When you have a Big Shadow on your chart then this is a strong signal meaning that you might be ahead of a reversal. You can take other elements (momentum, trend, volatility, price action, fundamentals) to build a complete strategy and confirm your entries. Beware that you might not make money just following the arrows generated by the pattern re
This indicator uses a mathematical calculation algorithm . This algorithm calculates the remainder between the updated model and the actual values and produces the possible progress of the graph on the graph. It is not a super prophet in trading, but it is very good for the trader when entering the market and to analyze it before entering. Applicable for all currencies. Данный индикатор использует алгоритм математических вычислений . Данный алгоритм вычисляет остаток между обновленной моделью и
Renko Plus
Eadvisors Software Inc.
With Renko Plus you can use the features in the Indicator functionality, just add it to the Metatrader5 chart.             The Renko chart is a type of chart, developed by the Japanese, that is constructed using price movement rather than standardized prices and time intervals like most charts. It is believed to be named after the Japanese word for bricks, "renga", as the graphic looks like a series of bricks.             A new brick is created when the price moves a specified pri
Gino Renko
Stephane, Andr Valette
1 (1)
Another renko-based indicator. It returns different usable values ​​for an EA, and is directly displayed on the main chart. Its setting is very simple: The size of the renko The number of bars taken into account The falling color The color on the rise Returned values: Buffer 0 : Value of the middle Buffer 1 : Value of the Top Buffer 2 : Value of the Bottom Buffer 3 : Direction of renko (0.0 for top ; 1.0 for bottom) Buffer 4 : Ratio of the renko, for example, if it is twice, 3 times, ro more of
O Alpha B3 Renko Trader  é um robô especialista para negociação no Bovespa B3  (miniíndice e minidólar) que une a análise de candlesticks do gráfico Renko (calculado internamente, sem imagens gráficas) com a estratégia Alpha B3 . O robô permite configurar, para os sinais de entrada, o tamanho do brick do gráfico Renko, bem como um número de candlesticks para análise. Além disso, você deve configurar os stops fixos, em pontos. O robô permite também a configuração de funções, tais como número de c
Owl Smart Levels MT5
Sergey Ermolov
4.1 (29)
MT4版本  |   FAQ Owl Smart Levels Indicator 是一個完整的交易系統,包含 Bill Williams 的高級分形、構建正確的市場波浪結構的 Valable ZigZag 以及標記準確入場水平的斐波那契水平等流行的市場分析工具 進入市場和地方獲利。 策略的详细说明 指示灯使用说明 顾问-贸易猫头鹰助手助理 私人用户聊天 ->购买后写信给我,我会将您添加到私人聊天中,您可以在那里下载所有奖金 力量在於簡單! Owl Smart Levels 交易系統非常易於使用,因此適合專業人士和剛開始研究市場並為自己選擇交易策略的人。 策略和指標中沒有隱藏的秘密公式和計算方法,所有策略指標都是公開的。 Owl Smart Levels 允許您快速查看進入交易的信號,突出顯示下訂單的水平並向您發送有關已出現信號的通知。 優點很明顯: 清楚地顯示主要和更高時間框架的趨勢方向。 指示儀器信號的出現。 標記開單、止損設置和固定利潤的水平。 沒有多餘的,只有必要的結構! ZigZag 表示全球趨勢的方向,因此也表示貿易方向。 市場反轉點的短線清楚地表明在什麼水平上構建斐波那
>>> MEGA SALE: 40% OFF!  - Promo price: $77 / Regular price $129 <<< - The promotion will end soon! The Forex Trend Tracker is an advanced tool designed to enhance the trading capabilities of forex traders. This sophisticated indicator uses complex mathematical formulas alongside the Average True Range (ATR) to detect the beginnings of new upward and downward trends in the forex market. It offers visual cues and real-time alerts to give traders a competitive advantage in the fast-paced world o
PAX3 Price Action Indicator
Marco Aurelio Santos Costa
5 (5)
You probably won't see the power of the indicator in the backtest, because it uses 3 windows, something you can't do, in the DEMO version that the site offers.  I trust 100% on my work and on my indicator, if you want a test version, send me a message, different from other sellers, who just want to "sell", I want whether you have a full version before renting and deciding. Christmas Discount 30% off until the 25th As you can imagine, it was a failure, I'm not saying that any indicator doesn't w
The Pure Price Action ICT Tools indicator is designed for pure price action analysis, automatically identifying real-time market structures, liquidity levels, order & breaker blocks, and liquidity voids. Its unique feature lies in its exclusive reliance on price patterns, without being constrained by any user-defined inputs, ensuring a robust and objective analysis of market dynamics. Key Features Market Structures A Market Structure Shift, also known as a Change of Character (CHoCH), is a pivot
This indicator is based on a classic Moving Average indicator. Moving averages help us to first define the trend and second, to recognize changes in the trend. Multi TimeFrame indicator MTF-MA shows MA data from the 4 timeframes by your choice. By default this indicator has external parameters: TF1 = 1; TimeFrame2b = true; TF2 = 5; TimeFrame3b = true; TF3 = 15; TimeFrame4b = true; TF4 = 60; InpPSARStep = 0.02; InpPSARMaximum = 0.2; You can change TF1-TF4 in the next limits: TF1 from M1 (1) to H4
Golden Spike Premium
Kwaku Bondzie Ghartey
Golden Spikes Detector Acknowledgement and Dedications:  The name of this indicator was Inspired by an Original; Mr Grant Koopman; a Knowledgeable and experienced Synthetics trader. I dedicate this indicator to Mr Grant.  Overview:   The Golden Spikes Premium is a groundbreaking trading indicator meticulously crafted for the Boom and Crash indices on the Deriv market. Tailored to meet the needs of discerning traders, this powerful tool operates exclusively on the one-minute timeframe, providing
Renko Charts Pro
Makarii Gubaydullin
Filter out small price movements and focus on the larger trend . Renko chart indicator will help you to filter out a minor price movements so that you can focus on the overall trend. The price must move a specified amount to create a Renko brick. This makes it easy to spot the current trend direction in which the price is moving. My  #1 Utility : includes 65+ features  |   Contact me  if you have any questions  |    MT4 version In the settings of the indicator, you can configure: Calculation Se
Gecko EA MT5
Profalgo Limited
5 (1)
NEW PROMO: Only a few copies copies available at 349$ Next price: 449$ Make sure to check out our " Ultimate EA combo package " in our   promo blog ! Gecko runs a simple, yet very effective, proven strategy.  It looks for important recent support and resistance levels and will trade the breakouts.  This is a "real" trading system, which means it will use a SL to protect the account.  It also means it will not use any dangerous techniques like martingale, grid or averaging down. The EA shows its
Maximum Trend Arrows OT MT5
Mulweli Valdaz Makulana
STRICTLY FOR BOOM INDEX ONLY!!!!! Here I bring the Maximum Trend Arrows OT1.0 MT5 indicator. This indicator is made up of a combination of different trend indicators for entries and exits, for entries an orange arrow will paint on the chart below the current market and a red flag for closing of trades and it produces buy arrows only. When the orange arrow appears, it will appear along with it's sound to notify you. The 1H timeframe is recommended, don't use it anywhere else than on the 1H timefr
Breakout Impulse indicator for MT5
Renaud Herve Francois Candel
Breakout Impulse Indicator Breakout Impulse Indicator is a pattern recognition indicator for Forex, Stocks, Indices, Futures, Commodities and Cryptos. The Breakout Impulse is a multi-bar pattern. The purpose of the pattern is to identify a fast change in momentum. This type of change can announce the start of a big directional move. Inputs of the indicator are: Distance : distance in pixel relative to top or bottom of candle to display the arrow symbol MaxBars : number of bars back used to
Inguz
Maxim Kuznetsov
Ing (inguz,ingwar) - the 23rd rune of the elder Futhark ᛝ, Unicode+16DD. Add some runic magic to your trading strategies. The correct marking of the daily chart will indicate to you the successful moments for counter-trend trading. Simple to use, has high efficiency in volatile areas. Be careful in lateral movements. Signals ᛝ are generated when the main lines of construction intersect. Red arrow down - recommended sales Blue up arrow - recommended purchases rare purple arrows indicate exce
HiLo Activator Plus
Rodrigo Galeote
5 (1)
HiLo Activator is one of the most used indicators to determine trend. Find it here with the ability to customize period and colors. This indicator also plots up and down arrows when there is a change on the trend, indicating very strong entry and exit points. HiLo fits well to different types of periods for day trading. You can easily understand when it is time to buy or sell. It works pretty good also for other periods like daily and monthly signalizing long-term trends. The use of the indicato
賺錢和研究的工具。 交易信號和策略的核心是基於作者的價格預測模式形成算法。適用於任何樂器!輔以基於 MA "九尾狐" 的控制系統,盡可能準確地更新和調整市場、儀器和工作期間的信號。 合格:所有市場中的所有工具(有例外)。 適用對象:對沖基金、基金和資產經理、投資經理、投機者、投資者和利益相關者。 ..................................................................................................................................................................................
MT5 Drawdown Tracker – Track Your EA’s Performance with Precision! Take your trading analysis to the next level with our MT5 indicator designed to monitor, record, and report the drawdown of any Expert Advisor. Whether you’re fine-tuning your strategies or optimizing risk management, this tool gives you the insights you need. Key Features: Effortless Tracking: Automatically monitors the drawdown levels of your EAs with precision. Comprehensive Data Storage: Accurately logs each drawdown event,
Robust median Renko style indicator for creating custom charts resembling Median Renko, Mean Renko, Turbo Renko and Better Renko candles as well as vanilla Renko with wicks plus Point-O charts. This all in one package provides all of the signals needed by day traders, scalpers, and even long-term traders. Main characteristics The indicator is an overlay on the main chart so it is possible to utilize one-click trading and order manipulation directly on the custom charts. Visual order placement i
FDP Strong Point new
Yauheni Dashevich
This indicator shows a candle combination based on dodge, dodge and pin bar. The logic of the pattern is to stand on the side of strength, after uncertainty. The indicator is universal and is useful for trading binary options, forex, ETFs, cryptocurrency, stocks. The indicator supports timeframes from M5 to MN, including non-standard TF presented in MT5. (М5,М6,М10,M12, M15, M20, M30, H1, H2, H3, H4, H6, H8, H12, D1, W1, MN). The ability to enable and disable TF is implemented. Sound alerts and
A professional expert analyzes the market using the relative strength index. The basic principle is that the bot takes the indicated prices for a certain period of time and calculates the strength and amplitude of the price. This can show when the trend will lose strength and reverse. The signal from the exit from the overbought/oversold zones is analyzed, the levels of these zones will be the levels with LEVEL_MAX and LEVEL_MIN values. We buy when the signal first falls below a certain level (
该产品的买家也购买
TrendMaestro5
Stefano Frisetti
note: this indicator is for METATRADER4, if you want the version for METATRADER5 this is the link:  https://www.mql5.com/it/market/product/108106 TRENDMAESTRO ver 2.4 TRENDMAESTRO recognizes a new TREND in the bud, he never makes mistakes. The certainty of identifying a new TREND is priceless. DESCRIPTION TRENDMAESTRO identifies a new TREND in the bud, this indicator examines the volatility, volumes and momentum to identify the moment in which there is an explosion of one or more of these data a
AriBot
Arman Belassarov
AriMax   – AI-Powered Trading Robot AriMax is a cutting-edge AI-powered trading robot designed to help traders maximize profits while minimizing risk. Utilizing advanced machine learning algorithms and real-time market analysis, AriMax identifies high-probability trade opportunities with precision and speed. Key Features:     AI-Driven Market Analysis   – Analyzes market trends and patterns to make data-driven trading decisions.     Automated Execution   – Places trades seamlessly with optimiz
CBT Quantum Maverick 高效的二元期权交易系统 CBT Quantum Maverick 是一款精心设计的高性能二元期权交易系统,专为追求精准、简单和纪律的交易者打造。无需自定义,该系统经过优化,可直接使用并产生高效结果。只需遵循信号操作,稍加练习即可掌握。 主要特点: 信号精准度: 基于当前K线生成下根K线交易信号,无频繁重绘。 市场多样性: 专为二元期权交易设计,兼容多种经纪商和资产类别,适应不同交易偏好。 兼容性: Deriv Synthetic Charts :适用于任何时间框架。 OTC Charts :来自如 Quotex、PocketOption、Binomo、Stockity、IQOption、Exnova、OlympTrade、Deriv、Binolla 和 Homebroker 的经纪商,可导入 MT5(一周内提供免费导入支持,之后需支付服务费用)。 外汇、加密货币和商品市场 :扩展资产利用。 高收益二元资产 :建议使用90%以上的高回报率资产。 额外优势: 全面的交易计划: 提供系统化和纪律性交易的分步支持计划。 高效时间利用: 每天仅需一
IVISTscalp5
Vadym Zhukovskyi
5 (6)
我们向您介绍iVISTscalp5指标,它不仅独特,而且在交易操作中也非常有效。该指标基于时间数据,是多年金融市场经验和深入分析的结果。iVISTscalp5指标是手动交易的优秀工具。便利性、简单性和可视化 - 所有的复杂性都隐藏在内部。我们将iVISTscalp5指标的设置和使用简化到了最大程度。该指标适用于MT5终端中您所拥有的所有金融工具。 操作时间为UTC+3的早上4点到晚上8点。 iVISTscalp5指标菜单(见截图1): History - 计算行情的周数 dT_min - 选择时间间隔的时间(分钟) TFline - 绘制水平成交量(时间帧) BARSline - 绘制水平成交量(条数) TFtrend1 - 绘制日线通道(时间帧) BARStrend1 - 绘制日线通道(条数) TFtrend2 - 绘制周线通道(时间帧) BARStrend2 - 绘制周线通道(条数) ALERT_TIMER - 设置闹钟 ALERT - 开启/关闭闹钟 Save - 开启/关闭将时间记录到文本文件。 图表上的红色和蓝色旗帜表示时间(VIST智能剃须系统的信号)。卖出信号为红旗,买入
WanaScalper
Isaac Wanasolo
1 (1)
A scalping indicator based on mathematical patterns, which on average gives signals with relatively small SL, and also occasionally helps to catch big moves in the markets (more information in the video) This indicator has three main types of notifications: The first type warns of a possible/upcoming signal on the next bar The second type indicates the presence of a ready signal to enter the market/open a position The third type is for SL and TP levels - you will be notified every time price re
EXCLUSIVE! JUST  10 COPIES  AVAILABLE!   BONUS AUX VIP Club 2024 : Include EA CAP, CEP, LDH, PSC307 & AO4C to enhance the performance of this tool to its maximum potential  Click Here to Download Files   ( for users only ) FREE Trading Education Available Daily via Zoom --- For More Info or Instant Message Click link ---  https://t.me/abcdwave Transform your trading with the "Five Magic Bullets" Indicator, tailored for traders who embrace the power of Elliott Wave Chaos Theory.
The   Gann Scalping Gold Indicator   is a robust technical analysis tool designed for precision trading in gold markets. It leverages Gann-based methodologies to identify key price levels, enabling traders to anticipate potential market reversals, breakouts, and areas of consolidation. Daily Reset Logic: Automatically resets touch statuses at the start of a new trading day, ensuring that the indicator aligns with fresh daily trends. How It Works: The indicator draws horizontal lines at predefine
当然可以!以下是您提供的文本的中文翻译: 引入   MT4 / MT5 天文指标:您的终极天体交易伙伴 您准备好将交易体验提升到天文高度了吗?不用再寻找,就在我们的革命性 MT4 天文指标中。这个创新工具超越了传统的交易指标,利用复杂的算法提供无与伦比的天文洞察力和精确计算。 指尖上的宇宙信息:   瞻仰一个详尽的面板,展示了一宝藏般的天文数据。了解行星的地理/太阳心坐标,太阳/地球距离,亮度,伸长度,星座,黄道和赤道坐标,甚至是水平坐标——每个细节都经过精心计算并呈现得美轮美奂。指标生成的垂直线对应于时间值,为您的交易旅程提供了宇宙的视角。 行星线条与关系:   在您的图表上欣赏行星线条的魔力,具有可自定义的比例和角度。通过直观的控制面板轻松切换每个行星线条的可见性。通过连结、六分、四分、三分、对冲和逆行等指标,发现行星关系的艺术。在您选择的时间范围内探索这些宇宙构造,使您能够识别重要的交易机会。 揭示甘恩的智慧:   通过受甘恩启发的平方垂直线揭示潜在的反转时机。这种创新修改将甘恩历经考验的原则带入现实,帮助您提前了解市场的转向和趋势。 月亮引导:   在您的图表上优雅地导航月相,
Big Player Range
Thalles Nascimento De Carvalho
5 (3)
释放 "BigPlayerRange" 的力量:市场技术分析的利器 我们隆重推出 BigPlayerRange ,一款先进的技术分析工具,专为揭示 市场中机构投资者的兴趣区域 而设计。借助该工具,您可以精准识别大玩家的活跃区域,从而提升您的交易策略的效果。 主要特性: 机构兴趣区域映射 : BigPlayerRange 突出显示金融机构的高活动区域,提供关于市场可能走势的重要见解。 目标退出点的预测 :此指标使用两步预测建议潜在退出点,助您基于价格未来方向规划策略。 回调概率分析 :评估当价格回到识别范围时的 回调概率 ,此功能有助于风险管理和策略调整。 如何使用 BigPlayerRange: 识别兴趣区域 :利用此指标锁定机构活跃的关键区域,从而预测重要市场变动。 目标退出点的预测 :根据指标提供的预测制定退出决策,以实现策略性平仓。 回调概率评估 :监测价格回到兴趣范围时的回调可能性,并据此调整策略。 核心触发点:监控价格相对于绿色和红色线的位置 BigPlayerRange 的中心区域 展示了 机构集中的市场能量 。监控价格相对于 绿色和
The indicator is designed to close positions on the market in time. For example: to take profits ahead of schedule if the price has not reached TakeProfit, and the market is turning around. The indicator analyzes the momentum, not the trend. He does not give any information about the trend. The indicator is well suited for finding divergence. The Ershov 38 Parrots indicator dynamically adjusts to the market and detects price movement impulses of medium and high amplitude. It almost does not rea
VTrende Pro
Andrii Diachenko
5 (1)
VTrende Pro - MTF indicator for trend trading with a display panel for MT5 *** Videos can be translated into any language using subtitles (video language - Russian) Although the signals of the VTrende Pro indicator can be used as signals of a full-fledged trading system, it is recommended to use them in conjunction with the Bill Williams TS. VTrende Pro is an extended version of the VTrende indicator. Difference between Pro version and VTrende: - Time zones - Signal V - signal 1-2 waves -    S
Price Action Scanner Pro 是一款识别价格行为并给予提醒的指标 , 它比 Price Action Scanner 能提供更多的功能与配置 . 这款指标可以同时检测最多15个品种 , 不同时间周期的信号 . 你可以分别设置亚盘时间 , 欧盘时间 , 美盘时间 , 检测的时间周期 , 这样就能在交易频繁的时段使用小级别的信号来判断入场时机 , 在交易不频繁的时段使用较大级别的信号来判断入场时机 . 通过设置分隔符 , 来添加不同的品种名称 , 不同的时间周期 .  指标可以设定检测多种常见信号种类 , 有 Pinbar , 吞没形态 , 孕线形态 , 启明星 , 黄昏之星 , Fakey , 在单独的副图里面显示出对应的信息 , 并提示出信号的方向 . 你可以点击对应的 Open Chart 按钮 , 显示出这个品种的 chart , 便于更好的观察 . 你也可以设置每种信号的颜色 , 显示的大小 .  在显示方面 , 也做了升级 . 你可以根据屏幕分辨率的大小 , 选择显示两列 , 三列 , 还是四列内容 , 同时可以调整显示的字体大小 . 信号已经对趋势进行了
GannTools
issam rahhal sabour
GannTools Indicator The GannTools Indicator is a powerful trading tool inspired by W.D. Gann's strategies. This indicator provides traders with dynamic support and resistance levels, trend analysis, and key price patterns using Gann angles and cycles. Key Features: Customizable Gann Fans, Angles, and Cycles for precise market analysis. Automatic identification of key price levels and trend directions. Works on all timeframes and instruments for flexible trading strategies. Integrated visualiza
Классификатор силы тренда. Показания на истории не меняет. Изменяется классификация только незакрытого бара. По идее подобен полной системе ASCTrend, сигнальный модуль которой, точнее его аппроксимация в несколько "урезанном" виде, есть в свободном доступе, а также в терминале как сигнальный индикатор SilverTrend . Точной копией системы ASCTrend не является. Работает на всех инструментах и всех временных диапазонах. Индикатор использует несколько некоррелируемых между собой алгоритмов для класси
Currency Index Watcher is a simple and user-friendly tool for whoever wish to trade Forex using currencies indexes. Currency Index Watcher is configurable and usable directly from the panel. Indexes of 8 custom currencies EUR, USD, GBP, JPY, CHF, AUD, CAD, NZD (default) Any 3-chars symbol from your market watch could be used (BTC = bitcoin, RUB = ruble, CNH = yuan etc ...) : double click the symbol label  Ability to select which currencies and made-of pairs will be analyzed : check/uncheck wante
Pendiente de Precio
Cesar Juan Flores Navarro
Indicador en base a la pendiente de la linea de precio, dibuja una línea de color cuando sube a base de los precios que previamente has sido procesados o linealizados, y cuando baja la pendiente la linea linealizada toma otro color. En este caso se a considerado 6 lineas de diferentes procesos desde pendientes largas hacia las cortas, observándose que cuando coincidan las pendientes se produce un máximo o mínimo, lo que a simple vista nos permitirá hacer una COMPRA O VENTA.
Индикатор Coefficient Of Determination (COD) представляет собой значение коэффициента детерминации или квадрат коэффициента корреляции между зависимой переменной — ценой и объясняющей переменной — тиковым объемом. Что это дает нам на практике? COD отлично распознает кульминацию трендовых движений, что позволяет подбирать оптимальные точки и ловить развороты рынка. Как использовать индикатор: Наиболее популярная торговая стратегия строится совместно с трендовым индикатором Moving Average (MA), пе
Fibonacci Multiple 12
Cesar Juan Flores Navarro
Fibonacci Múltiple 12, utiliza la serie fibonacci plasmado en el indicador fibonacci, aumentadolo 12 veces según su secuencia. El indicador fibonacci normalmente muestra una vez, el presente indicador se mostrara 12 veces empezando el numero que le indique siguiendo la secuencia. Se puede utilizar para ver la tendencia en periodos cortos y largos, de minutos a meses, solo aumentado el numero MULTIPLICA.
Recommended TimeFrame >= H1. 100% Non Repainted at any moment.  Use it carefully, only with Trend Direction. Trading Usage: 2 Variants: as Range System or as BreakOut System (Both Only With Trend Direction)::: (Always use StopLoss for minimise Risk); [1] as Range System: (Recommended) in UP TREND:  - BUY in Blue Line , then if price goes down by 50 points (on H1) open Second BUY.   Close in any Profit you wish: TrailingStop(45 points) or Close when Price touches upper Gold Line. in DOWN TREND
Linea Horizontal Inteligente
Cesar Juan Flores Navarro
En base a cálculos matemáticos de determino una linea Horizontal que cruza a todas las señales de trading, mostrando los máximos y mínimos. La linea horizontal parte en dos las subidas y bajadas de las señales de trading, de tan manera que es fácil identificar los máximos y mínimos, y es inteligente por que es sensible a las subidas y bajadas, afín de no quedarse en un solo lado por siempre, trabaja excelentemente con otros indicadores suavizadores ya que les garantiza que en un intervalo de tie
Spike Detector
Tete Adate Adjete
this indicator is a Spike detector indicator, it is specially designed to trade Boom 1000, Boom 500, Crash 1000 and Crash 500 We recommend using it on Deriv Boom and Crash indices only Its setting is intuitive, familiar, easy to use it has notification functions; audible notifications and push notifications. this tool is simple to use, easy to handle This update is based on different strategies for spikes
AutoSignals Trend Panel
Danilo Maia Siqueira
指標基於每個圖表時間的6個信號,跟踪同一資產的5個不同圖表時間的趨勢。 該指標的主要目的是向我們展示放置該金融資產的多數趨勢。 系統在數個圖形時間中傳輸趨勢信息,這樣用戶可以廣泛查看資產的移動,這種工具通過幫助操作員執行訂單使用戶具有較高的命中率 支持趨勢。 指标基于每个图表时间的6个信号,跟踪同一资产的5个不同图表时间的趋势。 该指标的主要目的是向我们展示放置该金融资产的多数趋势。 系统在数个图形时间中传输趋势信息,这样用户可以广泛查看资产的移动,这种工具通过帮助操作员执行订单使用户具有较高的命中率 支持趋势。 Zhǐbiāo jīyú měi gè túbiǎo shíjiān de 6 gè xìnhào, gēnzōng tóngyī zīchǎn de 5 gè bùtóng túbiǎo shíjiān de qūshì.
Limitless MT5
Dmitriy Kashevich
Limitless MT5 is a universal indicator suitable for every beginner and experienced trader. works on all currency pairs, cryptocurrencies, raw stocks Limitless MT5 - already configured and does not require additional configuration And now the main thing Why Limitless MT5? 1 complete lack of redrawing 2 two years of testing by the best specialists in trading 3 the accuracy of correct signals exceeds 80% 4 performed well in trading during news releases Trading rules 1 buy signal - the ap
Panel Visao axetrend
Danilo Maia Siqueira
trend view panel; AutoSignals Trend The indicator tracks the trend in 5 different chart times for the same asset, based on 6 signals for each chart time. The main objective of the indicator is to show us the majority trend of the financial asset in which it was placed. The system transmits the information of the trends in different graphic times, in this way the user is able to have a wide view of the movement of the asset, this type of tool makes the user have a higher hit rate by helping
Escalera Inteligente
Cesar Juan Flores Navarro
Indicador en MQL5, recibe la información del precio SUAVIZADO, lo procesa anulando los picos inteligentemente, y el resultado lo envía al desarrollo de la escalera que iniciara y subirá o bajara según el peldaño o INTERVALO ingresado Ingreso PERIODO = 50 (variar segun uso) Ingreso MULTIPLICA AL PERIODO = 1 (variar segun uso) Segun la configuración la escalera puede pegarse o separarse de los precios,, Se aplica toda la linea de tiempo, y a todas las divisas, etc.  
Fibonacci Suavizado
Cesar Juan Flores Navarro
Indicador en MQL5, que obtiene el promedio de 10 EMAS, que son alineadas según Fibonacci, obteniendo un promedio, que sera suavizado.  Se puede ingresar un numero desde 2 a N, que multiplica a los EMA-Fibonacci. Funciona en cualquier criptomoneda, etc. etc... pudiendo calcular el futuro segun la tendencia de las EMAS. Funciona excelentemente en tramos largos, determinando exactamente el mejor inicio/salida. El precio inicial por apertura sera por un periodo de tiempo, luego aumentará.
QXS Market Scanner
Netlux Digital Kft.
QuantXMarketScanner is a multi assets indicator for MT5 - Mathematical model based on 7 custom moving averages indicators  - Adaptable on Currencies, Stocks and Crypto - Automatic setup, self optimized About QuantXsystem Products: –         Simple installation & integration into MT5   –         Unlimited License after purchase (for one user) –         Automatic pattern recognition to identify the best timing and price levels. –         Trading indicators are displayed directly and automaticall
QuantXSTocks Trading Range Indicator for MT5: INSTRUCTIONS TO USE OUR INDICATOR:- User needs to take trade on Arrow or after an Arrow CandleStick, You can achieve up-to 35-125 pips target by this Indicator. Best Timeframes for Stocks and Indices are M30 and H1: AMAZON M30 (50 pips) TESLA M30 (50 pips) APPLE M30 (50 pips) ADOBE M30 (50 pips) NASDAQ100 H1 (125 pips) The above are the approximate amount of pips you can achieve by this Indicator, Green arrow appears to be buy arrow while the Red ar
Super Suavizador
Cesar Juan Flores Navarro
Indicador en MQL5 que obtiene el promedio de 10 EMAS que son alineadas y procesadas según Fibonacci luego el promedio es suavizado"  Se ingresa un número de 2 a N que multiplica los EMA-Fibonacci y por consiguiente aumenta los fibonacci, resultando un promedio.   Se ingresa un número que suaviza los EMA-Fibonacci. Considerando los números 1/1 seria la suavización minima. Considerando los números 3/5 seria la suavización media. Considerando los números 10/30 seria la suavización alta.....etc
作者的更多信息
Reverse side scalper is the manual trading system, that works on choppy(anti-trend) market. As a rule markets are on 80% choppy and only 20% is trend phase. System is based on custom step Moving and RSI and reverse pattern. System defines up movement, down movement, trend / choppy phases. Indicator plots Buy signal arrow when current direction is down and phase is trend, Sell signal arrow is plotted when currently is up movement and phase is trend. As a rule it allows to "catch" local maximum/mi
Pips Hunter Robot
Ekaterina Saltykova
This EA is based on Grid Martingail method, and it has made a huge evolution with this method of trading.   It does not use directly the "classic" Grid Martingail method. EA waits exact points to add new orders in case of initial order goes loss direction. It has smart method to define follow up position points, that allows EA to stand up HUGE one side market's price direction. During high - impact News, highg-volatility time most of Grid systems, if it was not turned off, successfully blows tr
Golden section price action indicator - is a trend-scalping complete system with enter and exit points. Indicator is based on most powerfull price action japan patterns that are filtered by volume, volatility, market phase. Pattern is not a simple combinations of candles. Patterns must have "weight" to move market in right direction. "Weight" - is the summary of pattern's volume, the size of pattern candles according to last average volatility and ofcourse pattern must appear in correct market p
Balance Weighted Moving Hedge System- is the trend following manual system for forex/crypto market. Indicator represents custom balance-weighted moving average indicator. The main advantagies : very stable moving with really early signals, defines current trend power, ignores market noise. The more width of indicator line - the more expressive trend is. On the other hand thin moving line shows unstable / choppy market. Indicator can be used as single b alance weighted moving or with hedge strate
SupportResistancePeaks Indicator indicator - is the combination of dynamic support/resitance and price action pattern. As a rule support/resistance indicators uses already calculated, history levels. The most disadvantage of this method - new(incomming) levels always are not the same as were on history, in other words accuracy is not so high as expected. My indicator is looking for dynamic/live levels that are forming right now after trend lost it's power and choppy market starts. As a rule exac
Trend deviation scalper - is the manual system to scalp choppy market places. Indicator defines bull/bear trend and it's force. Inside exact trend system also defines "weak" places, when trend is ready to reverse. So as a rule, system plots a sell arrow when bull trend becomes weak and possibly reverses to bear trend. For buy arrow is opposite : arrow is plotted on bear weak trend. Such arrangement allows you to get a favorable price and stand up market noise. Loss arrows are closing by common p
Trend driver bars is the manual trading system, which defines current trend continue or it's pull-back/reverse. "Driver" bars - are price action patterns that has powerfull affect on market, defining it's near future direction. Generally, driver bars represents trend "skeleton" and often anticipates new market impulse. System plots arrows when market shows 3 pattenrs in a row(most powerfull combo-pattern), and makes fast scalping of incomming movement. Loss positions closes by common profit. Lot
Wave Impulse OmegaScalper - is the manual system for scalping. In many cases Indicator "eats" almost all possible trend wave. System defines up price wave and down price wave. Inside the exact wave - system defines true trend movement and choppy market. Indicator plots signals while market is trending, powerfull and has quiet good volatility. This is complete system with enter and exit points. Main Indicator's Features Signals are not repaint,non-late or disappear(exept cases when system recalcu
Binary step clouds - is the complete trading system with enter and exit points. System is based on double smoothed exponential step moving and volume weighted simple step moving.Generally each movings define trend direction and places when trend is in active phase. Signals plots when both movings approache to active trend phase and market speed is high.  Main Indicator's Features Signals are not repaint,non-late or disappear(exept cases when system recalculates all history datas,refreshing main
Acceleration Force Meter Indicator - is a trend system that join market in trend phase and after trend pull-back. AFM indicator - is the system that watchs market phases from flat to extreme volatility and prefers to enter in market when it's active, more volatility, ignoring most flat places. This is 100% complete trading system including enter and exit points. It works well with profitable trades - maximizing take profit targets(analysis of recent market volatility, its pips range to adapt cur
Market Chopper Indicator - is the manual system for market scalping. Indicator uses most accurate points to enter, when current trend has lost it's power and new one starts. Indicator shows : Enter points(buy/sell arrows), Exit points(Stoploss/Takeprofit arrows). Indicator makes market analysis and adapts to any market, any timeframe showing most relevant strategy for exact conditions. Main Indicator's Features Signals are NOT repaint, late or disappear; Every signal comes at the open of new bar
ImbaTrend Runner - is the trend following manual system for forex/crypto market. It defines medium-term trends and works with it in intraday mode. System shows enter points, profit and loss targets. As a rule profit targets are 2-3 X bigger than loss targets. Indicator is AutoAdaptive and it automatically updates it's settings during trading. Indicator is sensitive to market changes, regular updates helps to stay in relevant trend. Main Indicator's Features Signals are not repaint, late or disap
Early WPR divergence - is the manual system to define trend reverse. Green histogram shows main trend, Orange one - shows "short"/local trend. System is looking for clear divergence between both trends and pick up position(plot buy/sell arrows). When main trend is up, but local trend reverses to bearish trend and get's big power - sell arrow is plotted;    When main trend is down, but local trend reverses to bullish trend and get's big power - buy arrow is plotted;  Main inputs are : mediumTrend
Trend Gain Oscillator - is the manual system for defining trend phase(bullish/bearish). When histogramm is pink - market is up/bullish and when histogramm is blue - market is down/bearish. Arrows is plotted on zero cross, in case if additionally market has power for future movement. Main inputs are : trendPeriod- main indicator's period for trend calculation; trendPowerPeriod - period for market's power(volatility+volume) calculation ; trendPowerTrigger - arrows is not plotted if market's power
Bull bear pressure indicator - is the manual system which defines bull/bear market. When lines is above zero level - market is strong bullish, and when lines below zero level - market is bearish. First line represents global trend and second one are smoothed and shows local market's mood. Main inputs are : MainPeriod- main indicator's period for global trend calculation; SignalPeriod - period for   smoothed and shows local market's trend; Main Indicator's Features Signals are not repaint,non-la
ROC acceleration-deceleration is the manual system for medium-term scalping. Indicator based on custom ROC system which defines bullish/bearish market and especially  acceleration-deceleration of tendention in the market's main direction. Buy arrow is plotted during bearish market when current trend decelerates and sell  arrow is plotted during bullish market when current trend decelerates. Main Indicator's Features Signals are not repaint,non-late or disappear(exept cases when system recalculat
ASI fractals with DPO filter - is the manual trend-following system. ASI fractals are the base of every trend. System plots an arrow when fractal pattern appears on ASI indcator and DPO direction is same as incomming signal. System has several ways of usage : simply indicator, indicator with suggested arrows, arrows with single targets and arrows with common profit targets. User can simply switch indicator's modes directly from chart. Main Indicator's Features Signals are not repaint,non-late or
Trend reversal index - is the manual trading system that works with overbought , oversold levels and reversal patterns. Sell arrow is plotted when indicator is higher than overbought level and here forms reversal pattern, all pattern points  located higher than overbought level. Opposite with buy arrow : ndicator is lower than oversold level and here forms reversal pattern, all pattern points located lower than overbought level.  Main Indicator's Features Signals are not repaint, late or disapp
Dema divergence points - is the manual trading system based on double exponental moving divergence. Histogram represents 4 colors : yellow - strong up trend, orange - up movement, blue - down movement and aqua - strong down trend.  Up arrow is poltted when dema crosses current price up - but phase is still strong down (aqua color), down arrow is poltted when dema crosses current price down - but phase is still strong up (yellow color). Main inputs :  mainPeriod - main dema calculation period; f
Demarker pullback system - is the manual trading system for choppy markets. It show 2 colored histogram.  When histogram is blue - market is quite bullish, when histogram ir orange - market is more bearish. Up arrow is plotted when histogram is in oversold zone but blue color. Down arrow is plotted when histogram is in overbought zone but orange color. These patterns shows false breakout and possible soon reverse(price is overbought but shows bearish signs and price is oversold but shows bullis
TPM cross indicator MT4
Ekaterina Saltykova
TPM Cross (trend power moving cross) - is a trend following strategy based on custom signal points. Indicator consists from main custom moving chart line and trend power line. Indicator defines up and down movements by it's trend power and custom moving direction. When current market's trend looses it's power and opposite trend starts - power trend line  crosses moving and indicator plots an arrow.  Main indicator's adjustable inputs : movingPeriod - period of moving line  trendPeriod  - period
Impulse fractals indicator - is counter-trend oriented complex market fractal pattern.  Market creates bull/bear impulse, trend starts, fractals on impulsed wave are an agressive pullback signals. Buy arrow is plotted when market is bearish and it's impulse showed up-side fractal, and sell arrow is plotted when market is bullish and it's impulse showed dn-side fractal. Main indicator's adjustable inputs : impulsePeriod - main period of impulse histogram  filterPeriod  - smoothes impulse accordi
Triple trend index MT4
Ekaterina Saltykova
Triple trend index is the manual trading system/indicator. It looks for trend reversal points according to main trend index datas. Indicator represents  4 lines. 3 lines shows trend power by main market's parametres. 4th line (OrangeRed) is the main index. When line is above zero level - market is bullish, value below zero show bearish pressure. Indicator "looks" for weak places(reversal points) on bullish market to plot a sell arrow and weak places(reversal points) on bearish market to plot a
Floating peaks oscillator - it the manual trading system. It's based on Stochastik/RSI type of oscillator with dynamic/floating  overbought and oversold levels. When main line is green - market is under bullish pressure, when main line is red - market is under bearish pressure. Buy arrow appears at the floating bottom and sell arrow appears at floating top. Indicator allows to reverse signal types. Main indicator's adjustable inputs : mainTrendPeriod; signalTrendPeriod; smoothedTrendPeriod; tre
Trend speed vector - is the oscillator for manual trading. System measures trend direction and it's speed. Histogram shows 4 colors: Lime --> Strong up movement with good gain speed; Green --> Up movement with low gain speed Red --> Strong down movement with good gain speed; Orange --> Down movement with low gain speed Green and Orange histograms show weak market's movements and thуese places excluded from signal points. Buy arrow is plotted during strong down movement when bearish gain speed i
Floating gain meter MT4
Ekaterina Saltykova
Floating gain meter is the manual trading system that works with local trends and it's scalping. Histogram represents  bull/bear floating trend gain. Green color histogram shows choppy market with bullish pressure, Orange - shows choppy market with bearish pressure. Lime and Red colors shows "boiled" places in market. As a rule buy arrow is placed after strong Down movement when it's power becomes weak and choppy market starts. And sell arrow is plotted after strong Up movement when it's power
Pullback points indicator - is the manual trading system, that shows most popular market prices. Indicator measures bull/bear waves pressure and looks for "consensus" prices. As a rule these points are crossed up and down very often and opened trade has several chances to be closed in positive zone. Mainly, such points is the good base for "common profit" types of strategies. Indicator also represents   "common profit"  scalping method of trading as default one.  Main Indicator's Features Signa
Noize Absorption Index MT4
Ekaterina Saltykova
5 (1)
Noize Absorption Index - is the manual trading system that measures the difference of pressure between bears forces and bulls forces. Green line - is a noize free index that showing curent situation. Zero value of index shows totally choppy/flat market.Values above zero level shows how powerfull bullish wave is and values below zero measures bearish forces.Up arrow appears on bearish market when it's ready to reverse, dn arrow appears on weak bullish market, as a result of reverse expectation. S
Looking for EA to automate your trading strategy on the Forex market? TrendRocWaves Robot — your faithful companion in the world of trading! This 100% automated EA offers unique features: - works exclusively on high timeframes (H1 and H4) for confirmed response to market changes. - uses the most popular and liquid currency pairs such as EURUSD,GBPUSD with minimal spreads and fast transaction execution. - applies a scalping method based on a medium-term trend to achieve local goals and reduce r
Introducing the trading system Dynamic Trend Cycles Robot  — a powerful tool for H1-H4 trading with volatility pairs! Technical capabilities - pairs to trade : EURUSD,GBPUSD,XAUUSD;  - timeframes : M30,H1,H4; Why Choose Dynamic Trend Cycles Robot (DTC)? - Accurate Trend Analysis: DTC adapts to current market volatility, providing precise tracking of price trends. This allows you to confidently open positions in line with the main trend and maximize your profits. - Filtering False Signals: In t
筛选:
无评论
回复评论