RSI with Bollinger Bands
- 指标
- Aristeidis Gitas
- 版本: 1.1
- 更新: 18 二月 2025
- 激活: 15
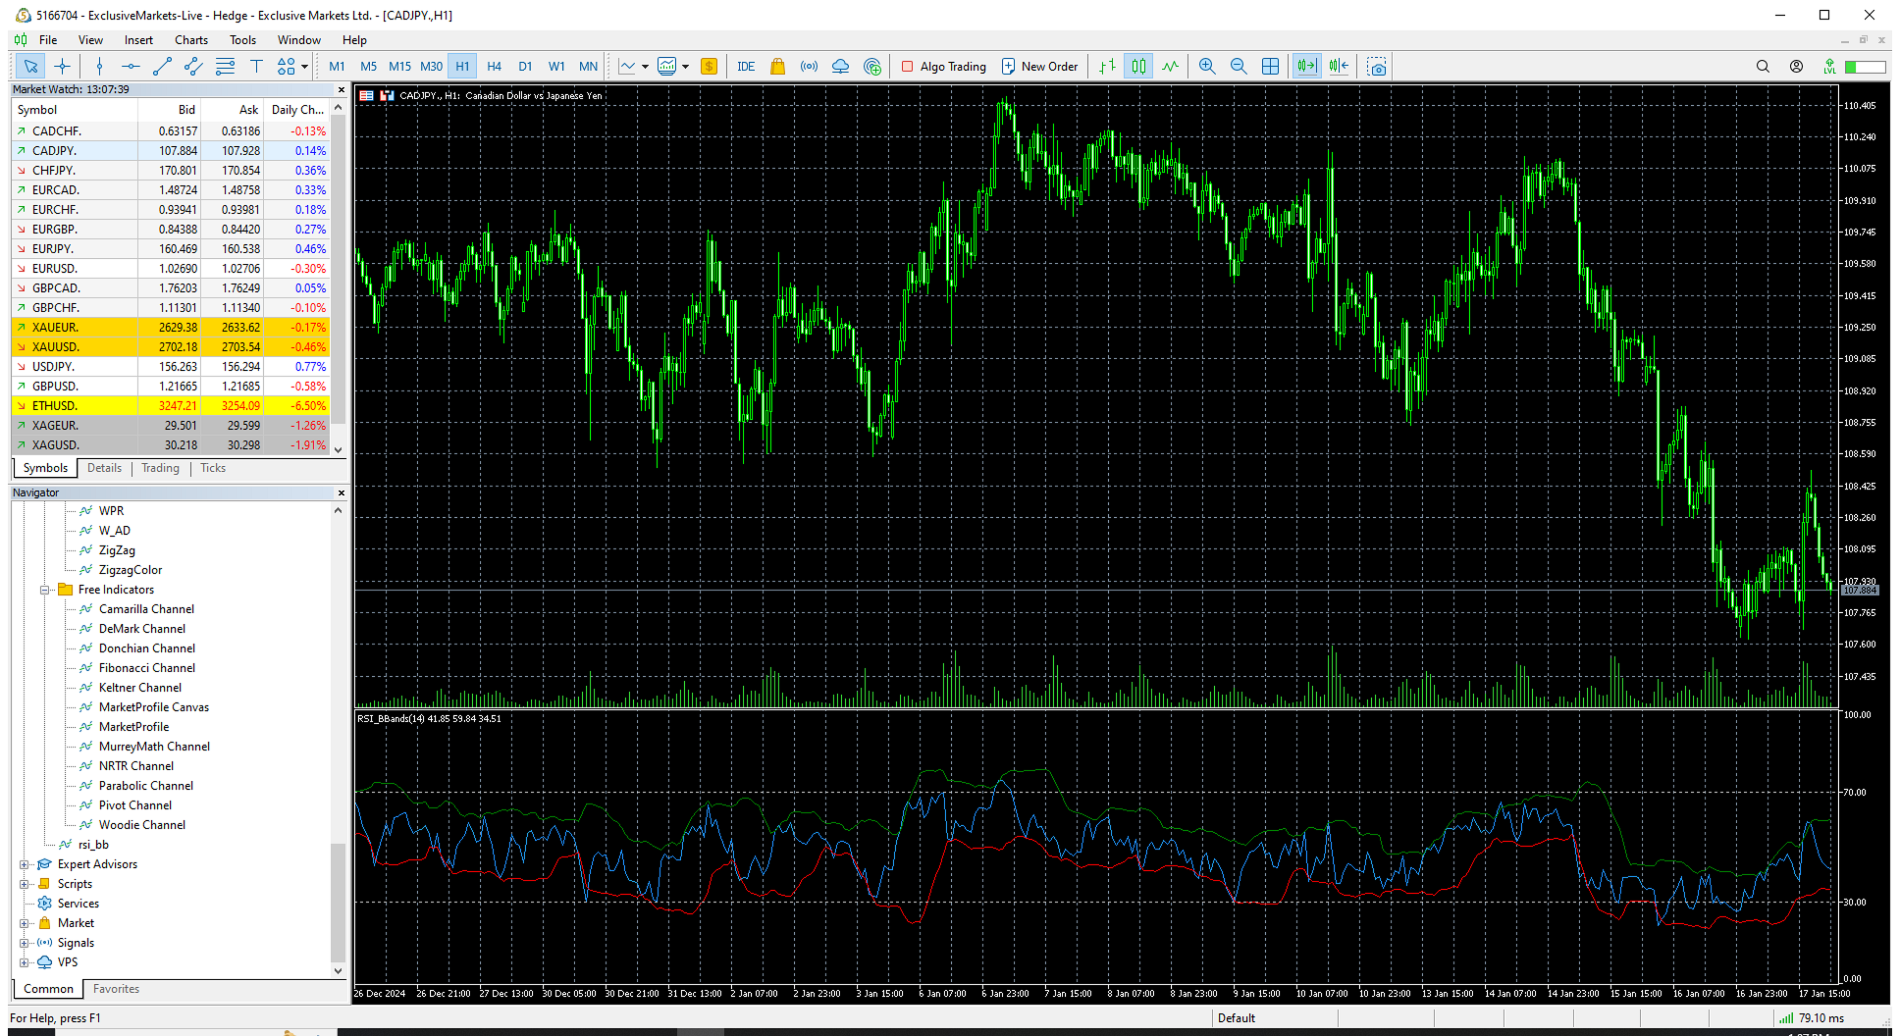
The RSI_BBands is a custom indicator designed to combine the Relative Strength Index (RSI) and Bollinger Bands (BB) for enhanced market analysis. It calculates the RSI using a specified period (default 14) and overlays Bollinger Bands around the RSI values, with adjustable parameters for the Bollinger Bands period and deviation.
Check more HERE
Key Features:
- RSI Calculation: The RSI is calculated based on price changes, with higher values indicating overbought conditions and lower values indicating oversold conditions.
- Bollinger Bands: The Bollinger Bands consist of three lines:
- Upper Band: Set to the mean RSI value plus the deviation multiplied by the standard deviation.
- Lower Band: Set to the mean RSI value minus the deviation multiplied by the standard deviation.
- Indicator Visualization: The indicator is drawn in a separate window, with the following visual elements:
- RSI Line (DodgerBlue): Represents the RSI values.
- Upper Band (Green): The upper boundary of the Bollinger Bands.
- Lower Band (Red): The lower boundary of the Bollinger Bands.
- Middle Band (Orange): The central line of the Bollinger Bands.
Parameters:
- RSI Period ( InpPeriodRSI ): Defines the period for calculating the RSI.
- Bollinger Bands Period ( BB_Period ): Specifies the period for the Bollinger Bands.
- Bollinger Bands Deviation ( BB_Deviation ): Determines the distance of the upper and lower Bollinger Bands from the mean RSI value.
Use Case:
This indicator is useful for traders who wish to analyze the RSI in relation to volatility and overbought/oversold conditions, with the added perspective of Bollinger Bands. It can provide signals based on price movements in relation to the RSI’s upper and lower boundaries, aiding in decision-making for market entries and exits.