Pivot Math Support and Resistance Lines
- 指标
- Irina Cherkashina
- 版本: 1.2
- 激活: 5
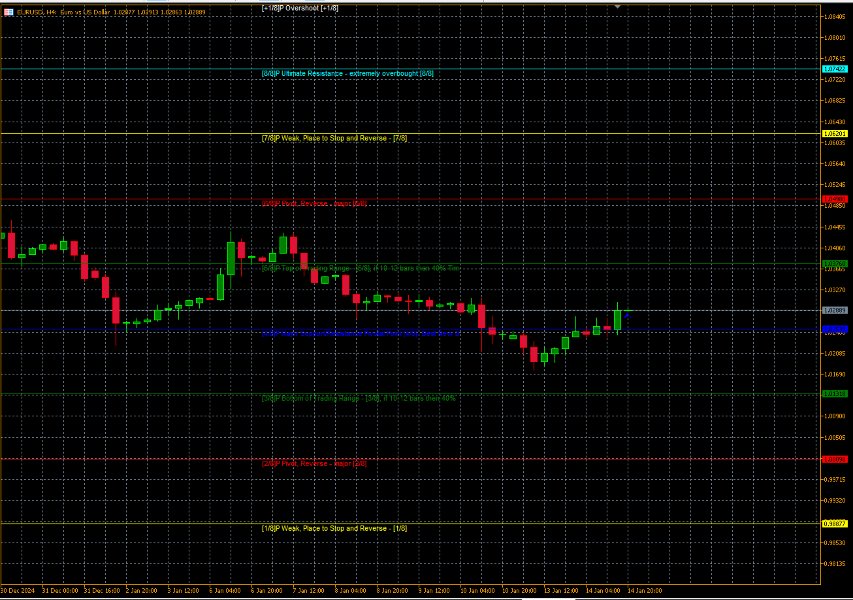
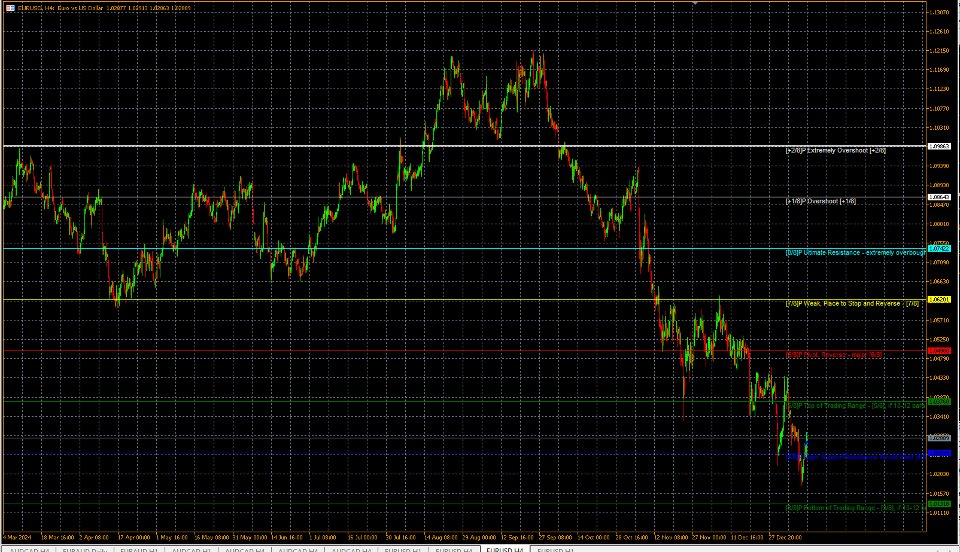
Pivot Math Support and Resistance Lines indicator — indicator showing pivot lines, which will definitely help every trader who knows how to trade with resistance, support and pivot lines. It shows 8 different lines (additional lines are also possible) on the main chart, helping you find the best points to buy, sell and exit positions.
Input parameters:
P (default = 64) — period in bars or other periods (set using MMPeriod), on which the lines will be calculated. The smaller this number, the "fresher" and less accurate the lines will be.
MMPeriod (default = 1440) — base period in minutes (60 — for hourly lines, 1440 — for daily lines, 10080 — for weekly and 43200 — for monthly); if greater than zero, the indicator will use P MMPeriod minutes to calculate the lines. If zero, the indicator will use P current bars for its calculations.
StepBack (default = 0) — step back for calculating lines (in current bars or in MMPeriod (if set) minutes).
Other parameters — affect only the visual display of lines.
Pivot Math Support and Resistance Lines is simple. The 0/8P and 8/8P lines are the strongest support and resistance lines — they are very difficult to break. The 1/8P and 7/8P lines are weak support and resistance lines, but if the price stops near them, it will change direction. The 2/8P and 6/8P lines are strong reversal lines. 3/8P and 5/8P are the bottom and top lines of the average trading range; there is a very high probability that the price will either break through this range very quickly or stay in it for a long time. 4/8P is the strongest support and resistance line. You can confidently sell and buy when the price breaks through this level. The blue arrow shows the last bar for which the lines were calculated.
You can purchase some of our professional Expert Advisors for free through our affiliate program.


