• 概述
  • 评论
  • 评论

Impulse correction and SCOB mapper WinWorld

描述

ICSM(脉冲-修正SCOB映射器)是一个分析价格走势并识别有效脉冲、修正和SCOB(单蜡烛订单块)的指标。它是一个强大的工具,可以与任何类型的技术分析一起使用,因为它灵活、信息丰富、易于使用,并且能显著提高交易者对最具流动性的兴趣区域的认识。

设置

常规 | 视觉

颜色主题 — 定义ICSM的颜色主题。

SCOB | 视觉

显示SCOB — 启用/禁用SCOB;

标记SCOB — 代表SCOB表示的样式选项列表;

SCOB颜色 — 定义SCOB的颜色;

ICM | 视觉

显示ICM线 — 启用/禁用ICM(脉冲-修正映射器)线;

显示IC趋势 — 通过图表底部的彩色分隔线启用/禁用脉冲-修正趋势的可视化;

线条颜色 — 定义ICM线的颜色;

线条样式 — 定义ICM线的样式;

警报

ICM — 启用/禁用突破ICM线的警报;

SCOB — 启用/禁用SCOB创建的警报;

ICM+SCOB — 启用/禁用在单个脉冲/修正结束时出现SCOB的警报,该SCOB抓取ICM线的流动性。

ICM+SCOB(同一蜡烛) — 启用/禁用在抓取ICM线流动性的蜡烛上出现SCOB的警报。

重要概念

为了充分理解ICSM能做什么,让我们快速概述一下这个指标所基于的最重要的概念。

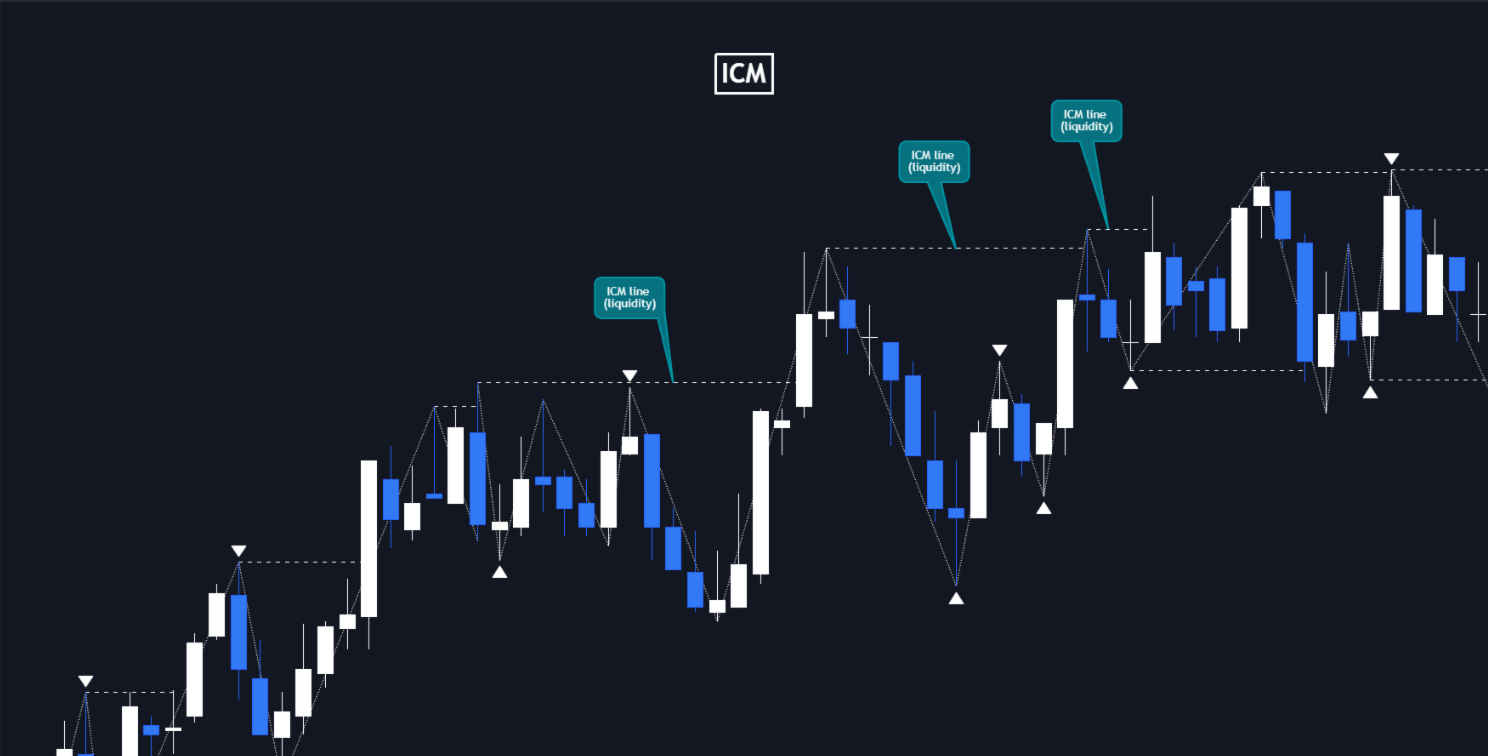
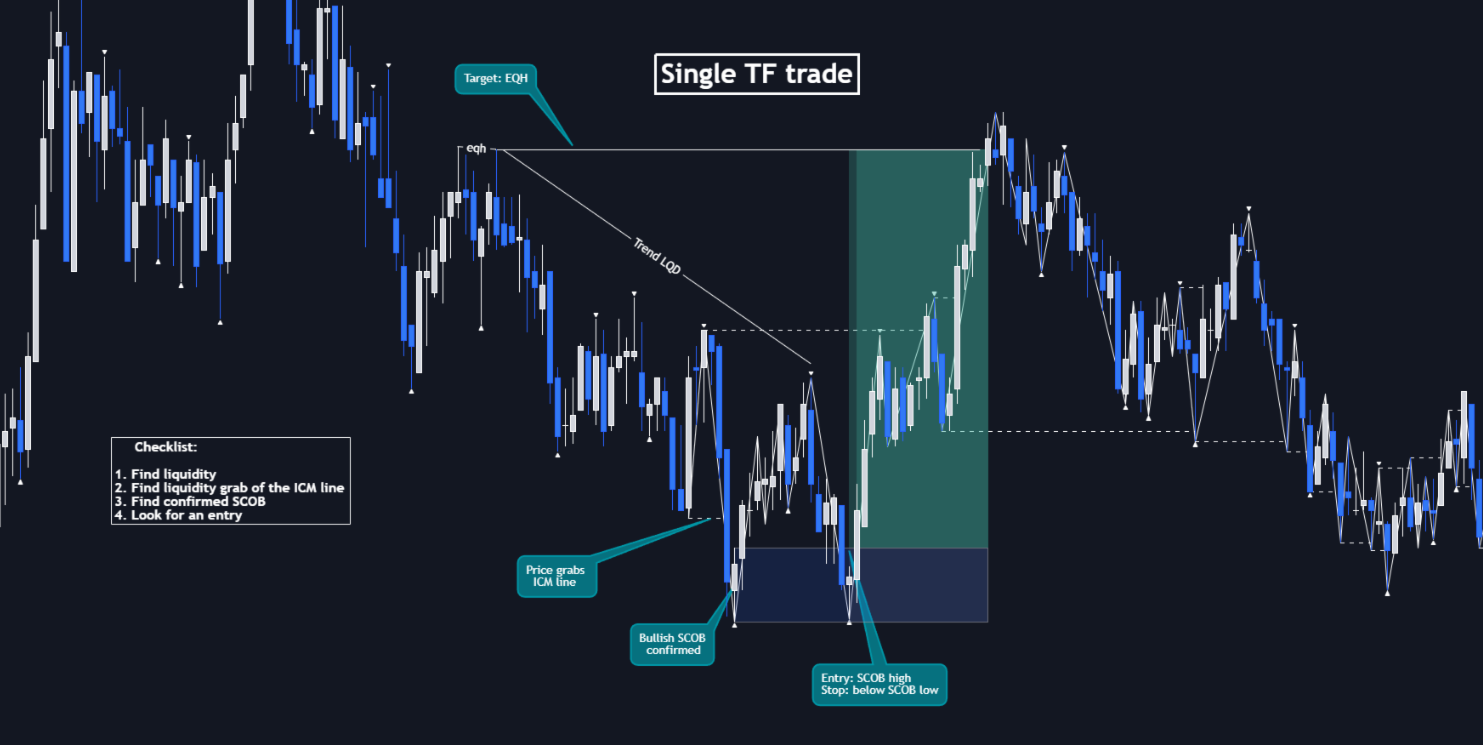
ICM指的是抓取脉冲-修正映射器线(ICM线;在图表上表示为虚线水平线)的流动性。简而言之,ICM线的流动性抓取为找到优秀入场点提供了巨大机会。

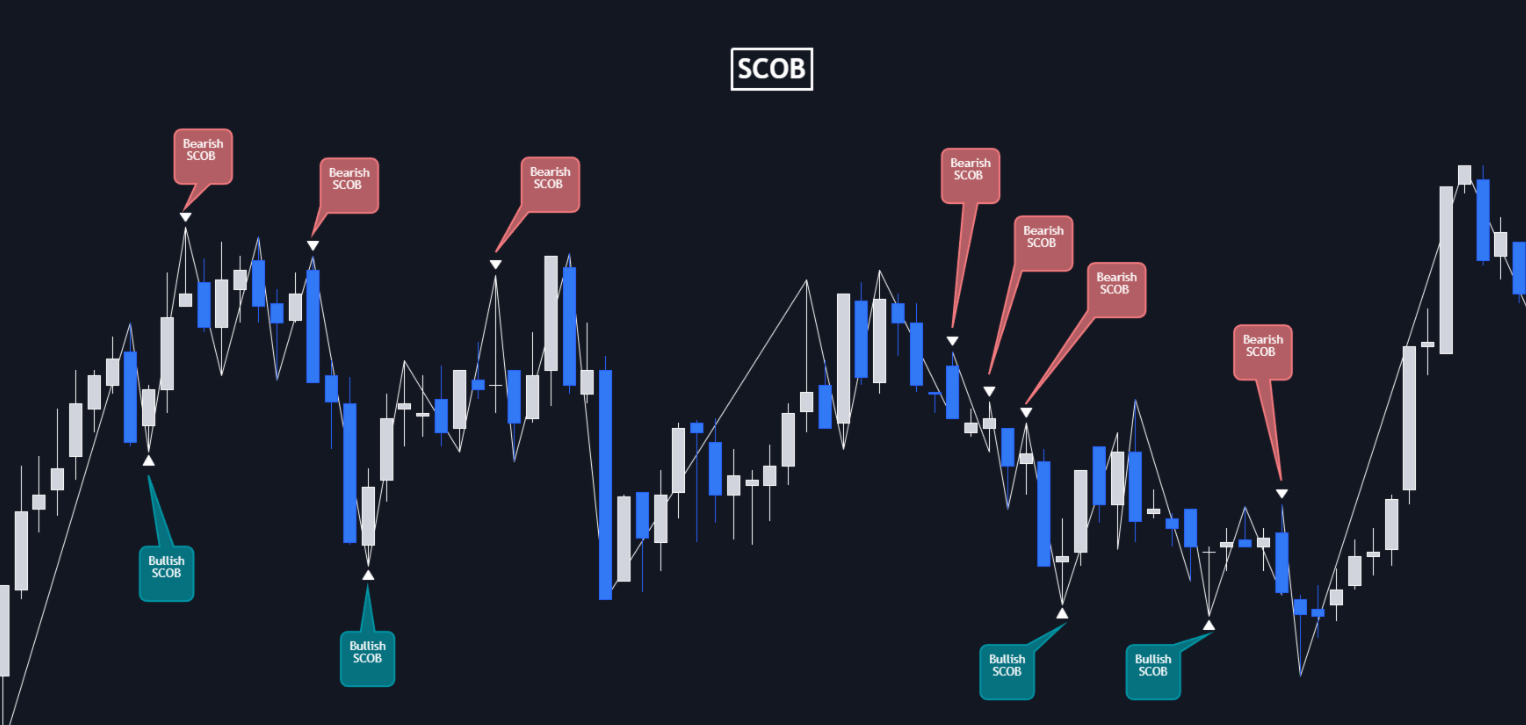
SCOB(单蜡烛订单块)由3个简单规则构建:

1. 抓取前一蜡烛的流动性;
2. 当前蜡烛收盘在前一蜡烛内;
3. 在下一根蜡烛上出现不平衡。

SCOB是一个相当有用的兴趣区域,价格通常从这里反转。您也可以在HTF**上将SCOB用作POI*,或在LTF***上用作入场区域。

* POI — 兴趣点
** HTF — 更高时间框架
*** LTF — 更低时间框架

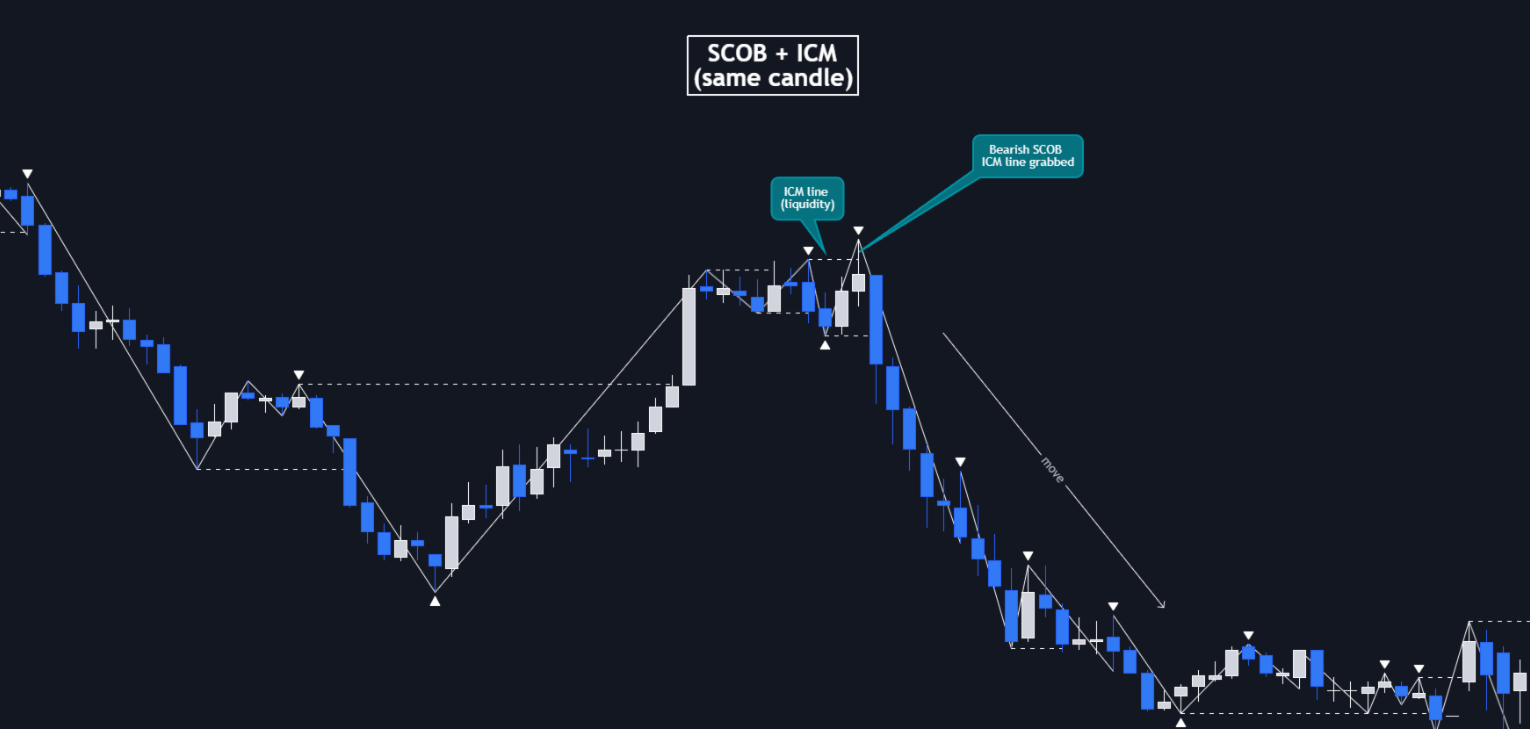
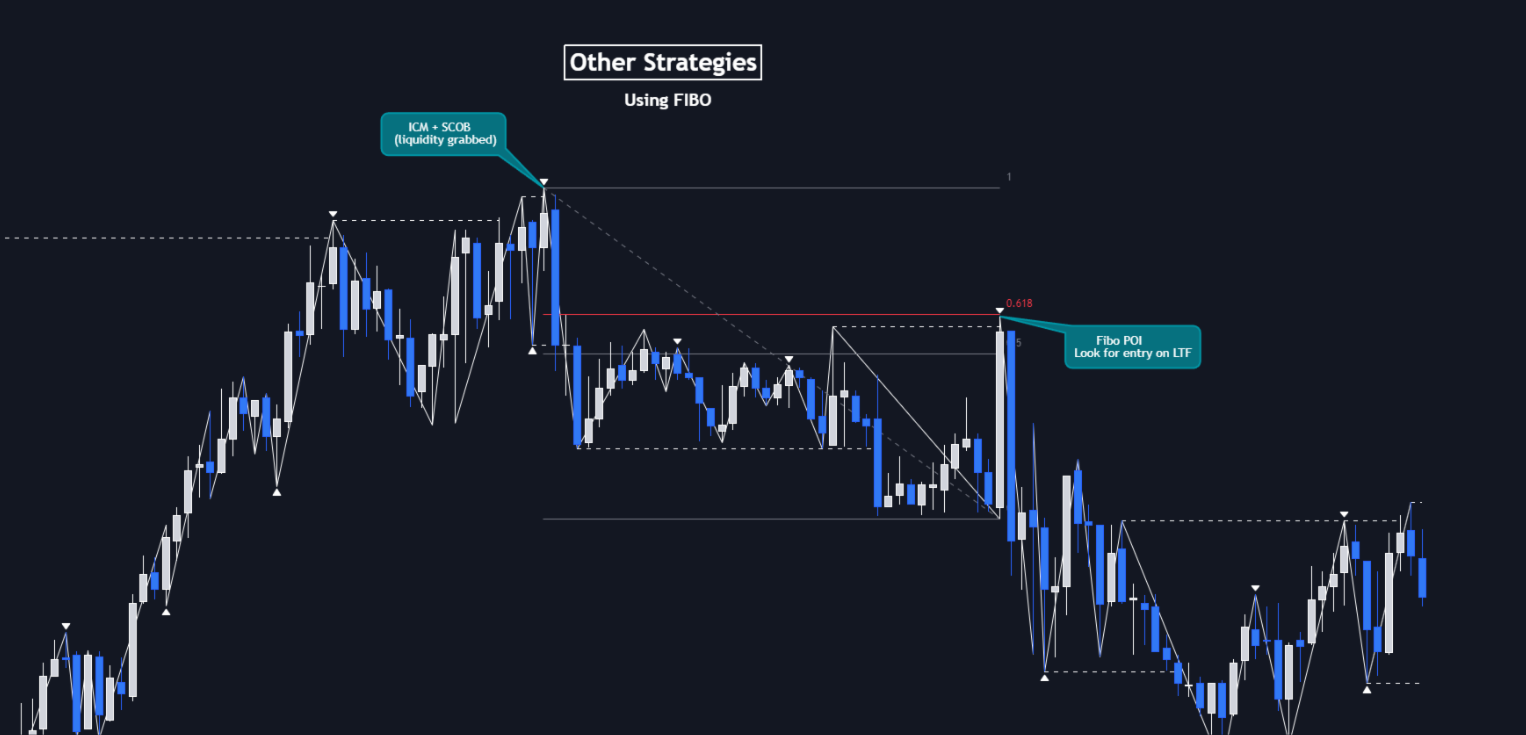
"ICM+SCOB"是我们用于描述价格首先从ICM线抓取流动性,然后在同一脉冲/修正运动中创建SCOB(在进行流动性抓取的同一ICM线上)的事件的简称。通常,在此事件之后出现的SCOB代表一个高度流动的兴趣区域,在选择入场水平时应考虑这一点。

"ICM+SCOB(同一蜡烛)"基本上与"ICM+SCOB"事件相同,但有一个主要区别 — 抓取ICM线流动性的蜡烛也是SCOB出现的蜡烛,使这样的SCOB比ICM+SCOB事件中的常规SCOB更好的兴趣区域。

最大优势

ICSM精确识别脉冲和修正。TradingView上的大量指标只显示最简单的兴趣区域,而ICSM使用我们团队的签名算法精确识别市场中的真实脉冲和修正,使交易者能更好地看到局部和全局价格方向,同时为交易者提供最具流动性的兴趣区域;

ICSM显示兴趣点和流动性。该指标识别最近的兴趣点和流动性集中的区域,使您能找到出色的入场和出场点;

ICSM具有SCOB(单蜡烛订单块)检测功能。ICM配备了在SMC交易中极其有用的SCOB检测功能,使您能找到更多可靠的兴趣点;

ICSM具有超级简约的设计,只包含您真正需要的内容。您的图表不会被不必要的信息过载。您只会看到清晰的兴趣点、流动性和价格走势。

为什么要使用它?

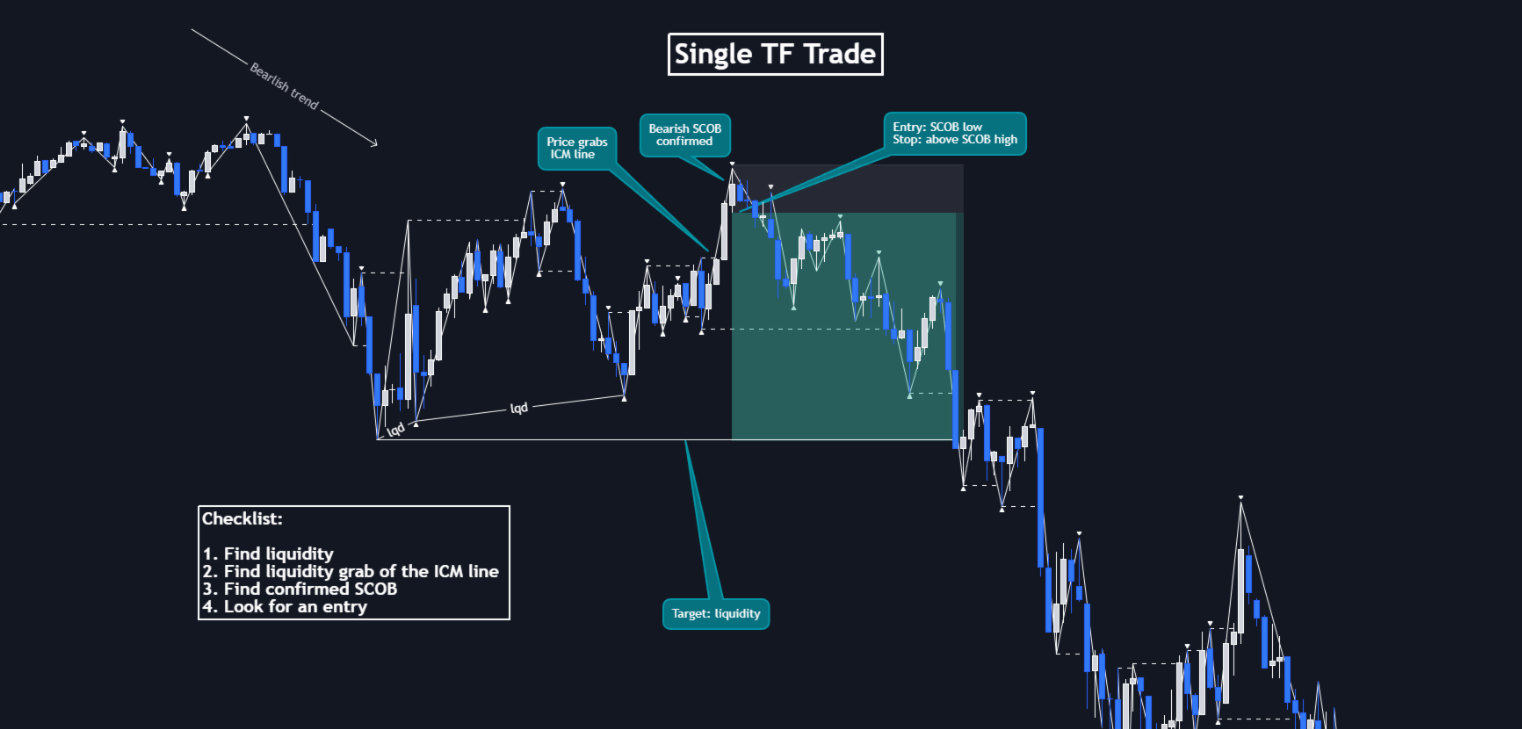
如上所述,ICSM允许您看到最有利可图的兴趣点和区域,专业SMC交易者认为这些是市场上最好的之一,因为历史上这些是价格反弹最多的区域,使最聪明的交易者能够获得快速而干净的利润,同时保持低回撤。

在ICSM指标中,这些区域是SCOB和ICM线流动性抓取。通过使用这些兴趣区域来寻找入场点,您增加了以最有利价格开仓的机会,并降低了交易风险。

考虑到上述内容,这个指标可以通过显示最具流动性的兴趣区域来帮助交易者降低回撤风险并增加潜在利润,这些区域非常适合开仓。

警报

ICSM提供简单易用的警报定制,允许您只选择想要接收的警报。您可以从以下警报选项中选择:

ICM — 脉冲或修正流动性抓取;

SCOB — 形成SCOB,无论是否从脉冲或修正中抓取流动性;

SCOB+ICM — 在抓取ICM线流动性后形成SCOB;

如何充分利用它?

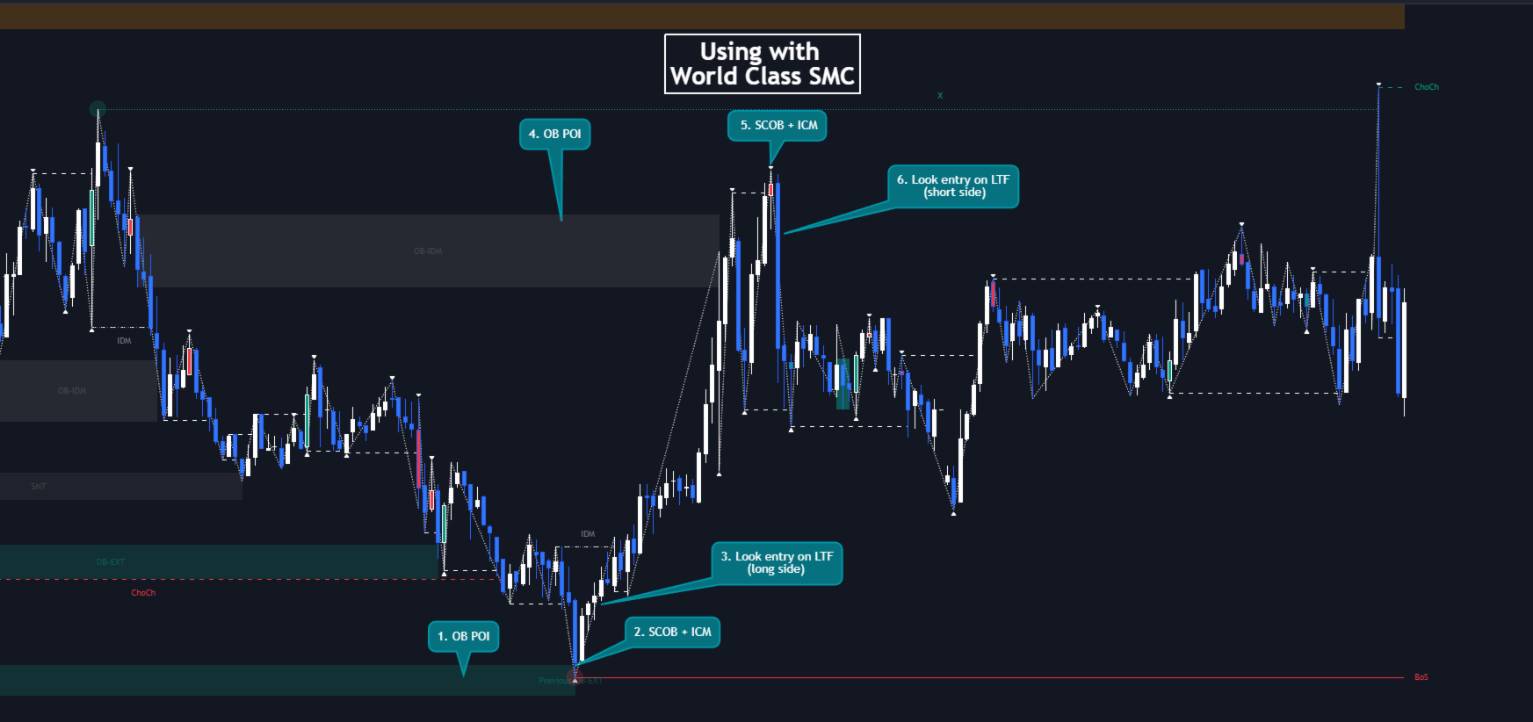
ICSM只显示脉冲或修正的第一个流动性,这与高级SMC策略中的IDM(诱导)相匹配。这个策略在World Class SMC指标中得到了完整的覆盖,并可以免费获得三部分的PDF。

您也可以将ICSM与任何其他策略一起使用,因为ICSM是一个非常灵活的指标,通过使人意识到图表上的高质量流动性,它将帮助任何人改善他们的交易。

总结

ICSM是一个独特的指标,它识别具有高质量流动性的兴趣区域和点,可以作为独立工具使用,也可以集成到任何其他策略中,以提高分析效率、交易入场准确性并降低交易风险。

如果您想了解我们团队在产品中使用的SMC策略,可以参考我们的教育材料。

我们希望您能充分利用ICSM,它将帮助您提高作为交易者的表现。祝交易者好运!

— 来自WinWorld团队的爱
推荐产品
Noize Absorption Index
Ekaterina Saltykova
Noize Absorption Index - is the manual trading system that measures the difference of pressure between bears forces and bulls forces. Green line - is a noize free index that showing curent situation. Zero value of index shows totally choppy/flat market.Values above zero level shows how powerfull bullish wave is and values below zero measures bearish forces.Up arrow appears on bearish market when it's ready to reverse, dn arrow appears on weak bullish market, as a result of reverse expectation.
Owl Smart Levels MT5
Sergey Ermolov
4.07 (28)
MT4版本  |   FAQ Owl Smart Levels Indicator 是一個完整的交易系統,包含 Bill Williams 的高級分形、構建正確的市場波浪結構的 Valable ZigZag 以及標記準確入場水平的斐波那契水平等流行的市場分析工具 進入市場和地方獲利。 策略的详细说明 指示灯使用说明 顾问-贸易猫头鹰助手助理 私人用户聊天 ->购买后写信给我,我会将您添加到私人聊天中,您可以在那里下载所有奖金 力量在於簡單! Owl Smart Levels 交易系統非常易於使用,因此適合專業人士和剛開始研究市場並為自己選擇交易策略的人。 策略和指標中沒有隱藏的秘密公式和計算方法,所有策略指標都是公開的。 Owl Smart Levels 允許您快速查看進入交易的信號,突出顯示下訂單的水平並向您發送有關已出現信號的通知。 優點很明顯: 清楚地顯示主要和更高時間框架的趨勢方向。 指示儀器信號的出現。 標記開單、止損設置和固定利潤的水平。 沒有多餘的,只有必要的結構! ZigZag 表示全球趨勢的方向,因此也表示貿易方向。 市場反轉點的短線清楚地表明在什麼水平上構建斐波那
ATrend
Zaha Feiz
4.77 (13)
ATREND: 工作原理及使用方法 工作原理 “ATREND”指标针对MT5平台设计,旨在通过结合多种技术分析方法为交易者提供强有力的买卖信号。该指标主要利用平均真实波幅(ATR)来测量波动性,并结合趋势检测算法来识别潜在的市场动向。 购买后请留言,您将获得特别的赠品。 主要特点: - 动态趋势检测:该指标评估市场趋势并相应调整信号,帮助交易者与当前市场条件对齐策略。 - 波动性测量:通过使用ATR,该指标衡量市场波动性,这对于确定最佳止损(SL)和止盈(TP)水平至关重要。 - 信号可视化:该指标在图表上直观地表示买卖信号,增强交易者的决策能力。 操作步骤 输入和设置: - 时间框架:此输入允许您设置指标计算的主要时间框架,默认值为15分钟。 - 时间框架2:此输入可用于定义额外分析的辅助时间框架,默认值为1分钟。 - 移动:此参数允许您将指标的计算向回移动,默认值为0。 - SLATR:此输入定义用于根据ATR计算止损水平的乘数,默认值为2.56。 - TPATR:此输入定义用于根据ATR计算止盈水平的乘数,默认值也为2.56。 - AlertsOn:启用或禁用交易信号的警报,
Atomic Analyst MT5
Issam Kassas
4.32 (19)
首先值得强调的是,该交易指标是非重绘、非延迟的指标,这使其成为手动和机器人交易的理想选择。 用户手册:设置、输入和策略。 Atomic Analyst是一种PA价格行动指标,利用价格的力量和动量来寻找市场上更好的机会。配备了高级过滤器,可帮助去除噪音和假信号,并提高交易潜力。使用多层复杂的指标,Atomic Analyst扫描图表,并将复杂的数学计算转化为任何初学者都能理解并用来做出一致交易决策的简单信号和颜色。 “Atomic Analyst”是专为新手和经验丰富的交易者量身定制的综合交易解决方案。它将高级指标和一流功能融合为一体的交易策略,使其成为所有类型交易者的多功能选择。 日内交易和剥头皮策略:专为快速准确的日内交易和短期交易而设计。 日内和摆动交易策略:可用作追求价格大幅波动的日内和摆动交易者的可靠工具。 多货币和市场:凭借其可靠的精度,在不同的工具和市场上运作。 多个时间框架:可在多个时间框架上使用,性能良好。 稳定性:所有指标均不重绘、不重绘和不滞后,确保可靠的信号。 信号清晰度:提供箭头信号,用于清晰的入场和出场点。 实时警报:通过交易入场、SL和TP警报通知交易者
Golden Spike Premium
Kwaku Bondzie Ghartey
Golden Spikes Detector Acknowledgement and Dedications:  The name of this indicator was Inspired by an Original; Mr Grant Koopman; a Knowledgeable and experienced Synthetics trader. I dedicate this indicator to Mr Grant.  Overview:   The Golden Spikes Premium is a groundbreaking trading indicator meticulously crafted for the Boom and Crash indices on the Deriv market. Tailored to meet the needs of discerning traders, this powerful tool operates exclusively on the one-minute timeframe, providing
Rainbow EA MT5
Jamal El Alama
Description : Rainbow EA MT5 is a simple Expert advisor based on   Rainbow MT5 indicator witch is based on Moving average with period 34. The indicator is incorporated in the EA, therefore, it is not required for the EA to operate, but if you wish, you can download it from   my product page . The Expert Advisor settings are as follows : Suitable for Timeframes up to H1 The parameters below can be set according to your trading rules. StopLoss ( Stop Loss in pips) TakeProfit ( Take Profit in pips
Trend Monitor MT5
Pavel Zamoshnikov
4.5 (2)
The indicator generates early signals basing on ADX reading data combined with elements of price patterns. Works on all symbols and timeframes. The indicator does not redraw its signals. You see the same things on history and in real time. For better visual perception signals are displayed as arrows (in order not to overload the chart). Features The best results are obtained when the indicator works on two timeframes. For example: M30 – the indicator shows the main trend; M5 – the indicator gen
Maximum Trend Arrows OT MT5
Mulweli Valdaz Makulana
STRICTLY FOR BOOM INDEX ONLY!!!!! Here I bring the Maximum Trend Arrows OT1.0 MT5 indicator. This indicator is made up of a combination of different trend indicators for entries and exits, for entries an orange arrow will paint on the chart below the current market and a red flag for closing of trades and it produces buy arrows only. When the orange arrow appears, it will appear along with it's sound to notify you. The 1H timeframe is recommended, don't use it anywhere else than on the 1H timefr
To download MT4 version please click here . - This is the exact conversion from TradingView: "Trend Direction Force Index - TDFI [wm]" By "causecelebre". - The screenshot shows similar results from tradingview and Metatrader when tested on ICMarkets on both platforms. - This indicator uses multiple levels of averaging to detect trend strength. - You can optimize filter low and filter high levels to achieve best results. - You have access to buffers to use in EAs. - This is a light-load processin
Cumulative Delta NG
Anton Polkovnikov
Cumulative delta indicator As most traders believe, the price moves under the pressure of market buying or selling. When someone redeems an offer standing in the cup, the deal is a "buy". If someone pours into the bid standing in the cup - the deal goes with the direction of "sale". The delta is the difference between purchases and sales. A cumulative delta - the difference between the cumulative sum of purchases and sales for a certain period of time. It allows you to see who is currently contr
Gioteen Volatility Index (GVI) - your ultimate solution to overcoming market unpredictability and maximizing trading opportunities. This revolutionary indicator helps you in lowering your losing trades due to choppy market movements. The GVI is designed to measure market volatility, providing you with valuable insights to identify the most favorable trading prospects. Its intuitive interface consists of a dynamic red line representing the volatility index, accompanied by blue line that indicate
Blahtech Market Profile MT5
Blahtech Limited
5 (10)
Was: $249  Now: $149   Market Profile defines a number of day types that can help the trader to determine market behaviour. A key feature is the Value Area, representing the range of price action where 70% of trading took place. Understanding the Value Area can give traders valuable insight into market direction and establish the higher odds trade. It is an excellent addition to any system you may be using. Inspired by Jim Dalton’s book “Mind Over Markets”, this indicator is designed to suit the
How to use Pair Trading Station Pair Trading Station is recommended for H1 time frame and you can use it for any currency pairs. To generate buy and sell signal, follow few steps below to apply Pair Trading Station to your MetaTrader terminal. When you load Pair Trading Station on your chart, Pair Trading station will assess available historical data in your MetaTrader platforms for each currency pair. On your chart, the amount of historical data available will be displayed for each currency pai
PZ Penta O MT5
PZ TRADING SLU
The Penta-O is a 6-point retracement harmonacci pattern which usually precedes big market movements. Penta-O patterns can expand and repaint quite a bit. To make things easier this indicator implements a twist: it waits for a donchian breakout in the right direction before signaling the trade. The end result is an otherwise repainting indicator with a very reliable trading signal. The donchian breakout period is entered as an input. [ Installation Guide | Update Guide | Troubleshooting | FAQ | A
这个指标用于比较图表上的交易品种与其他几个所选交易品种之间的强弱相对关系。 根据每个交易品种基于相同基准日的价格走势进行比较,可以看到几条不同走向的趋势线,反映出几个不同交易品种之间的强弱关系,这样可以更清楚地了解市场的趋势。 例如,你可以在EURUSD图表上应用这个指标,将其与货币对EURJPY和EURGBP进行比较,看看哪个更强。 你需要为指标输入参数: 需要比较的几个交易品种的名称 您需要选择比较基准日期。 请注意,使用指标前应确保相关交易品种的历史数据已经下载。 免费模拟版本是: https://www.mql5.com/zh/market/product/63921 .............................................
Renko Gold
Ignacio Agustin Mene Franco
Renko Gold! clearly indicates the floors and ceilings where it goes from 4 lines, the line below that marks the floor in green confirming with the thinnest line clarifies the purchase entry, the same is for sale, the top line marks the ceiling and the thinnest red line marks the sale, This indicator works for all temporalities! For Forex and Synthetic Indices markets! It also works for crypto markets! Good profit! World Investor.
Modified Bollinger Bands
Gennadiy Stanilevych
The standard Bollinger Bands indicator has been improved by integrating additional indications from the Standard Deviation indicator (StdDev), which gives an additional filter for confirming trading signals. In addition, the color of the indicator's lines shows the beginning of a trend, its development and exhaustion. This indicator has a signal block that notifies the trader of the beginning of the trend on any time frame to which it is attached. Settings Type of messages - select the type of
Mega Spikes Max
Niccyril Chirindo
5 (1)
Are you tired of missing out on the biggest opportunities in Boom and Crash trading? Mega Spikes Max is your ultimate tool for dominating the markets, giving you the precision and confidence you need to succeed. Why Choose Mega Spikes Max? Stay Ahead with Real-Time Alerts Never miss a profitable trade again. Get instant notifications directly to your mobile or desktop when a spike is imminent, even if you're away from your screen. Accurate Spike Detection Engineered for pinpoint accuracy, Mega
Terra Infinity
Ivan Simonika
Terra Infinity is a flat indicator. This improved version of the CalcFlat indicator has three additional lines that significantly increase its effectiveness. Unlike its predecessor with two static levels, Terra Infinity adds three dynamic lines above the main histogram, which are interpreted as follows: base signal line, minimum signal line, maximum signal line. These lines are formed using the additional parameter Avg, which is the average value of the histogram. Averaging produces a line cl
PipFinite Exit EDGE MT5
Karlo Wilson Vendiola
4.86 (29)
Did You Have A Profitable Trade But Suddenly Reversed? In a solid strategy, exiting a trade is equally important as entering. Exit EDGE helps maximize your current trade profit and avoid turning winning trades to losers. Never Miss An Exit Signal Again Monitor all pairs and timeframes in just 1 chart www.mql5.com/en/blogs/post/726558 How To Trade You can close your open trades as soon as you receive a signal Close your Buy orders if you receive an Exit Buy Signal. Close your Sell orders if
Double HMA MTF for MT5
Pavel Zamoshnikov
4 (4)
This is an advanced multi-timeframe version of the popular Hull Moving Average (HMA) Features Two lines of the Hull indicator of different timeframes on the same chart. The HMA line of the higher timeframe defines the trend, and the HMA line of the current timeframe defines the short-term price movements. A graphical panel with HMA indicator data from all timeframes at the same time . If the HMA switched its direction on any timeframe, the panel displays a question or exclamation mark with a tex
The Optimized MACD Divergence indicator is a powerful tool designed to identify potential trading opportunities by detecting divergences between price action and the MACD indicator. It combines classic divergence analysis with candlestick pattern recognition and volume filtering to provide more accurate and reliable signals. How it Works The indicator operates on the following principles: MACD Calculation:   It calculates the MACD indicator using user-defined parameters for fast EMA, slow EMA,
To get access to MT4 version please click here . - This is the exact conversion from TradingView: "Stochastic Momentum Index" By "UCSgears". - This is a popular version of stochastic oscillator on tradingview. - This is a light-load processing and non-repaint indicator. - Buffers are available for the lines on chart. - You can message in private chat for further changes you need. Thanks for downloading
Magic Finger 能帮助你清晰的发现趋势及交易机会。此系统根据经典策略加上个人交易经验制作。您也可以根据此指标加上您的交易风格去编写EA。 手指指向为开仓信号,变色线为趋势确认。如果您是日内交易者,可以选择在交易活跃的时间段内交易,参考变色线作为下单方向依据,手指信号作为过滤器。 如果你是趋势交易者,可以选择在H1以上的周期,在关键价格区域等待手指信号的出现,并入市交易,然后以变色线作为趋势的确认。 止损可以止损圆点作为依据。 RS为重要的多空分水岭 输入参数如下: RISK 5 MONEY RISK 2.0 AlertOption ********************************* Local Alert true TimesOfAlerts 2 E-Mail Alert false App PUSH Notification  false  Display_Option    *********************************  Barclor_Display  true  RS_Display   true  L
Wave Trend MT5
Diego Arribas Lopez
MT4 Version Wave Trend MT5 Wave Trend is an oscillator, which helps identifing in a extremely accurate manner market reversals. The Oscillator being obove the overbought level and a cross down of the fast into the slow MA usually indicates a good SELL signal. If the oscillators is below the oversold level and the fast MA crosses over the slower MA usually highlights a good BUY signal. The Wave Trend indicator can be also used when divergences appear against the price, indicating the current move
Your Trend Friend
Luigi Nunes Labigalini
5 (1)
The trend is your friend! Look at the color of the indicator and trade on that direction. It does not  repaint. After each candle is closed, that's the color of the trend. You can focus on shorter faster trends or major trends, just test what's most suitable for the symbol and timeframe you trade. Simply change the "Length" parameter and the indicator will automatically adapt. You can also change the color, thickness and style of the lines. Download and give it a try! There are big movements w
Stratos Pali mt5
Michela Russo
5 (4)
Stratos Pali Indicator is a revolutionary tool designed to enhance your trading strategy by accurately identifying market trends. This sophisticated indicator uses a unique algorithm to generate a complete histogram, which records when the trend is Long or Short. When a trend reversal occurs, an arrow appears, indicating the new direction of the trend. Important Information Revealed Leave a review and contact me via mql5 message to receive My Top 5 set files for Stratos Pali at no cost ! Down
PipFinite Trend PRO MT5
Karlo Wilson Vendiola
4.84 (551)
Breakthrough Solution For Trend Trading And Filtering With All Important Features Built Inside One Tool! Trend PRO's smart algorithm detects the trend, filters out market noise and gives entry signals with exit levels. The new features with enhanced rules for statistical calculation improved the overall performance of this indicator. Important Information Revealed Maximize the potential of Trend Pro, please visit www.mql5.com/en/blogs/post/713938 The Powerful Expert Advisor Version Automatin
Scan pattern
VLADISLAV AKINDINOV
The indicator is designed to help in making a decision on the direction of trading (buy or sell). It is a history scanner that searches for matches of the current pattern (combination of several current bars) with historical data in percentage terms by the relative vertical position of candles relative to each other, the size of each candle, the size of the candle body and the candle shadows. In history, the matches found are indicated by vertical lines on the candle of the beginning of the soug
该产品的买家也购买
CBT Quantum Maverick 高效的二元期权交易系统 CBT Quantum Maverick 是一款精心设计的高性能二元期权交易系统,专为追求精准、简单和纪律的交易者打造。无需自定义,该系统经过优化,可直接使用并产生高效结果。只需遵循信号操作,稍加练习即可掌握。 主要特点: 信号精准度: 基于当前K线生成下根K线交易信号,无频繁重绘。 市场多样性: 专为二元期权交易设计,兼容多种经纪商和资产类别,适应不同交易偏好。 兼容性: Deriv Synthetic Charts :适用于任何时间框架。 OTC Charts :来自如 Quotex、PocketOption、Binomo、Stockity、IQOption、Exnova、OlympTrade、Deriv、Binolla 和 Homebroker 的经纪商,可导入 MT5(一周内提供免费导入支持,之后需支付服务费用)。 外汇、加密货币和商品市场 :扩展资产利用。 高收益二元资产 :建议使用90%以上的高回报率资产。 额外优势: 全面的交易计划: 提供系统化和纪律性交易的分步支持计划。 高效时间利用: 每天仅需一
TPSpro RFI Levels MT5
Roman Podpora
4.53 (19)
指示       俄罗斯 -        英语   建议 与指示器一起使用     -       TPSpro 趋势专业版 -   MT4版本       交易中的一个关键要素是做出买卖交易工具决定的区域或水平。尽管主要参与者试图隐藏他们在市场中的存在,但他们不可避免地会留下痕迹。我们的任务是学习如何识别这些痕迹并正确解释它们。 主要功能: 向卖家和买家显示活跃区域! 该指标显示所有正确的初始买入和卖出脉冲水平/区域。激活这些水平/区域后,开始寻找切入点,水平会改变颜色并填充特定阴影。此外,还会显示箭头,以便更直观地了解情况。 显示更高时间范围内的级别/区域(MTF 模式) 添加了使用更高时间间隔显示级别/区域的功能。此外,该指标还具有自动趋势检测功能(   TPSproTREND PRO   )。 用于交易的单独专业的逐步算法。 该算法专为日内交易而设计,既可顺势交易,也可逆势交易。每个活动模板均提供详细说明。 适用于多种时间范围 。 TPSpro RFI 水平指标可用于图表上的任何时间范围,从一分钟(M1)开始一直到每月(MN)。 图形和声音警报。 该指标提供图形和声音指示,
RelicusRoad Pro MT5
Relicus LLC
4.78 (18)
现在$ 147(更新后增加到$ 499) - 无限帐户(PC或Mac) RelicusRoad 用户手册 + 培训视频 + 访问 Private Discord Group + VIP 身份 一种看待市场的新方式 RelicusRoad 是世界上最强大的外汇、期货、加密货币、股票和指数交易指标,为交易者提供保持盈利所需的所有信息和工具。我们提供技术分析和交易计划,帮助每一位交易者取得成功,从初学者到高级。它是一个关键的交易指标,可以提供足够的信息来预测未来的市场。我们相信一个完整的解决方案,而不是图表上几个没有意义的不同指标。这是一个多合一指标,显示无与伦比且非常准确的信号、箭头 + 价格行为信息。 RelicusRoad 基于强大的人工智能,提供缺失的信息和工具来教育您并使您成为交易专家,成为成功的交易者。 几乎所有技术指标都滞后,这意味着它们只能报告已经发生的事情。因此,他们只确认您过去可以看到的价格已经在哪里。我们相信领先指标可以预测未来价格,而无需重新绘制,也不要过度依赖可能改变并导致重新绘制的滞后指标。如果您根据滞后指标进行交易并建立头寸,您就知道您已经大部分时间
BookMap HeatMap
Roberto Spadim
1 (2)
This Indicator creates a heatmap based on depth of market of the current symbol or another symbol. Other symbol is useful when you trade futures market and a contract has 'mini' and 'full' split. For example, in Brazil (B3 - BMF&Bovespa), WDO and DOL are future Forex contract of BRL/USD (where 1 DOL = 5 WDO) and big banks work mostly with DOL (where liquidity is important). Please use with M1 timeframe , objects are too small to be displayed at higher timeframes (MT5 limit). The number of level
Waterfall by Kratus
Justine Kelechi Ekweh
5 (1)
Overview The Waterfall Trading Indicator is a powerful momentum detection tool designed to identify high-probability trading opportunities across multiple timeframes. Built on pure price action analysis, this indicator provides clear, non-repainting signals that are especially effective for binary options and forex trading. Key Features Non-Repainting Signals : Based on real-time price action, ensuring reliable trade signals Multi-Timeframe Compatibility : Effective across all timeframes, with o
FxaccurateLS
Shiv Raj Kumawat
WHY IS OUR FXACCCURATE LS MT5 THE PROFITABLE ? PROTECT YOUR CAPITAL WITH RISK MANAGEMENT Gives entry, stop and target levels from time to time. It finds Trading opportunities by analyzing what the price is doing during established trends. POWERFUL INDICATOR FOR A RELIABLE STRATEGIES We have made these indicators with a lot of years of hard work. It is made at a very advanced level. Established trends provide dozens of trading opportunities, but most trend indicators completely ignore them! The
TrendMaestro5
Stefano Frisetti
note: this indicator is for METATRADER4, if you want the version for METATRADER5 this is the link:  https://www.mql5.com/it/market/product/108106 TRENDMAESTRO ver 2.4 TRENDMAESTRO recognizes a new TREND in the bud, he never makes mistakes. The certainty of identifying a new TREND is priceless. DESCRIPTION TRENDMAESTRO identifies a new TREND in the bud, this indicator examines the volatility, volumes and momentum to identify the moment in which there is an explosion of one or more of these data a
MetaForecast M5
Vahidreza Heidar Gholami
5 (2)
MetaForecast能够根据价格数据中的谐波来预测和可视化任何市场的未来走势。虽然市场不总是可预测的,但如果价格中存在模式,MetaForecast可以尽可能准确地预测未来。与其他类似产品相比,MetaForecast通过分析市场趋势可以生成更精确的结果。 输入参数 Past size (过去的尺寸) 指定MetaForecast用于创建生成未来预测模型的柱数量。该模型以一条黄色线绘制在所选柱上。 Future size (未来的尺寸) 指定应预测的未来柱数量。预测的未来以粉色线表示,并在其上绘制了蓝色回归线。 Degree (程度) 此输入确定了MetaForecast将在市场上进行的分析级别。 Degree 描述  0 对于程度0,建议使用较大的值来设置“过去的尺寸”输入,以覆盖价格中的所有高峰、低谷和细节。  1 (建议的) 对于程度1,MetaForecast可以理解趋势,并通过较小的“过去的尺寸”生成更好的结果。  2 对于程度2,除了趋势,MetaForecast还可以识别反转点。对于大于1的程度,必须使用较高的“细节”和“噪音减少”输入值。  大于2 不建议使用大于
Elliot Waves Analyzer Pro
Viktor Weidenthal
2.67 (3)
Elliot Waves Analyzer Pro calculates Elliot Waves to Help Identify Trend direction and Entry Levels. Mainly for Swing Trading Strategies. Usually one would open a Position in trend direction for Wave 3 or a Correction for Wave C . This Indicator draws Target Levels for the current and next wave. Most important Rules for Elliot Wave Analysis are verified by the Indicator.  The Pro version analyzes Multiple Timeframes and shows the Subwaves and Target-Levels.   For an Overview  " Elliot Waves Anal
AriBot
Arman Belassarov
AriMax   – AI-Powered Trading Robot AriMax is a cutting-edge AI-powered trading robot designed to help traders maximize profits while minimizing risk. Utilizing advanced machine learning algorithms and real-time market analysis, AriMax identifies high-probability trade opportunities with precision and speed. Key Features:     AI-Driven Market Analysis   – Analyzes market trends and patterns to make data-driven trading decisions.     Automated Execution   – Places trades seamlessly with optimiz
IVISTscalp5
Vadym Zhukovskyi
5 (6)
我们向您介绍iVISTscalp5指标,它不仅独特,而且在交易操作中也非常有效。该指标基于时间数据,是多年金融市场经验和深入分析的结果。iVISTscalp5指标是手动交易的优秀工具。便利性、简单性和可视化 - 所有的复杂性都隐藏在内部。我们将iVISTscalp5指标的设置和使用简化到了最大程度。该指标适用于MT5终端中您所拥有的所有金融工具。 操作时间为UTC+3的早上4点到晚上8点。 iVISTscalp5指标菜单(见截图1): History - 计算行情的周数 dT_min - 选择时间间隔的时间(分钟) TFline - 绘制水平成交量(时间帧) BARSline - 绘制水平成交量(条数) TFtrend1 - 绘制日线通道(时间帧) BARStrend1 - 绘制日线通道(条数) TFtrend2 - 绘制周线通道(时间帧) BARStrend2 - 绘制周线通道(条数) ALERT_TIMER - 设置闹钟 ALERT - 开启/关闭闹钟 Save - 开启/关闭将时间记录到文本文件。 图表上的红色和蓝色旗帜表示时间(VIST智能剃须系统的信号)。卖出信号为红旗,买入
EXCLUSIVE! JUST  10 COPIES  AVAILABLE!   BONUS AUX VIP Club 2024 : Include EA CAP, CEP, LDH, PSC307 & AO4C to enhance the performance of this tool to its maximum potential  Click Here to Download Files   ( for users only ) FREE Trading Education Available Daily via Zoom --- For More Info or Instant Message Click link ---  https://t.me/abcdwave Transform your trading with the "Five Magic Bullets" Indicator, tailored for traders who embrace the power of Elliott Wave Chaos Theory.
Elliott Wave Trend MT5
Young Ho Seo
4 (3)
Elliott Wave Trend was designed for the scientific wave counting. This tool focuses to get rid of the vagueness of the classic Elliott Wave Counting using the guideline from the template and pattern approach. In doing so, firstly Elliott Wave Trend offers the template for your wave counting. Secondly, it offers Wave Structural Score to assist to identify accurate wave formation. It offers both impulse wave Structural Score and corrective wave Structure Score. Structural Score is the rating to sh
Introduction to X3 Chart Pattern Scanner X3 Cherart Pattern Scanner is the non-repainting and non-lagging indicator detecting X3 chart patterns including Harmonic pattern, Elliott Wave pattern, X3 patterns, and Japanese Candlestick patterns. Historical patterns match with signal patterns. Hence, you can readily develop the solid trading strategy in your chart. More importantly, this superb pattern scanner can detect the optimal pattern of its kind. In addition, you can switch on and off individu
Weis Wave with Alert MT5
Trade The Volume Waves Single Member P.C.
4.94 (16)
Rental/Lifetime Package Options and Privileges  Rent Monthly Six Months   Yearly/Lifetime Weis Wave with Speed with Alert+Speed Index x x x Manual  x x x Quick Set up Video x x x Blog x x x Lifetime Updates x x x Setup and Training Material x x Discord Access Channel "The SI traders"          x Rectangle Break Alert Tool      x How to trade with it:    http://www.tradethevolumewaves.com   ** If you purchase please contact me to setup your  : Two hour  webinar and  training Room and  complet
Seconds Charts
Aleksandr Goryachev
Micro  ******************* Секундные графики MT5 ********************** Более точного инструмента для входа в сделку вы не найдёте. Входные параметры: Timeframe, sek - период построения графика, секунды Displayed bars - отображаемые бары Step of price levels, pp, 0-off - шаг отрисовки ценовых уровней, пункты Scale points per bar, 0-off - масштаб в пунктах на бар Show lines - отображение текущих уровней Show comment - отображение комментария Standard color scheme - стандартная цветовая сх
SMC Trading Pro Tool
The Anh Pham
5 (1)
Welcome to the world of SMC (Smart Money Concepts) Trading, where we empower traders with the tools and knowledge to make smarter trading decisions. Our latest addition to our suite of trading tools is the SMC Trading Pro indicator, version 1.0. Key Features: Major Market Structure Identification with BODY break. Order Block must be in Major Swing ( not Small Swing ). Order Block with Fair Value Gap Detection. Order Block in Discount | Premium zone. Filter for only Bullish, Bearish or All Order
当然可以!以下是您提供的文本的中文翻译: 引入   MT4 / MT5 天文指标:您的终极天体交易伙伴 您准备好将交易体验提升到天文高度了吗?不用再寻找,就在我们的革命性 MT4 天文指标中。这个创新工具超越了传统的交易指标,利用复杂的算法提供无与伦比的天文洞察力和精确计算。 指尖上的宇宙信息:   瞻仰一个详尽的面板,展示了一宝藏般的天文数据。了解行星的地理/太阳心坐标,太阳/地球距离,亮度,伸长度,星座,黄道和赤道坐标,甚至是水平坐标——每个细节都经过精心计算并呈现得美轮美奂。指标生成的垂直线对应于时间值,为您的交易旅程提供了宇宙的视角。 行星线条与关系:   在您的图表上欣赏行星线条的魔力,具有可自定义的比例和角度。通过直观的控制面板轻松切换每个行星线条的可见性。通过连结、六分、四分、三分、对冲和逆行等指标,发现行星关系的艺术。在您选择的时间范围内探索这些宇宙构造,使您能够识别重要的交易机会。 揭示甘恩的智慧:   通过受甘恩启发的平方垂直线揭示潜在的反转时机。这种创新修改将甘恩历经考验的原则带入现实,帮助您提前了解市场的转向和趋势。 月亮引导:   在您的图表上优雅地导航月相,
Hurst Cycles Diamonds
Fillipe Dos Santos
Hurst Cycles Diamonds Description This indicator is an alternative version inspired by the pioneering work of David Hickson and the Hurst Cycles Notes indicator developed by Grafton. The main objective is to provide a clear and intuitive view of the Hurst cycles. Credits Original Concept : David Hickson - Hurst Cycles Theory Inspiration : Grafton - Hurst Diamond Notation Pivots Alternative Version : Fillipe dos Santos Main Features Identifies and displays pivots in multiple time cycles Visual t
TSO Fibonacci Chains MT5
Dionisis Nikolopoulos
Fibonacci retracement is a method of technical analysis for determining support and resistance levels. The TSO Fibonacci Chains Indicator is different from a simple Fibonacci Retracements indicator in that it provides the targets for each retracement level. In other words, there is an Extension Level (D) for every Retracement Level (C). In addition, if an Extension Level is reached, then a new Fibonacci setup is created automatically. These consecutive Fibonacci setups create a chain that reveal
WanaScalper
Isaac Wanasolo
1 (1)
A scalping indicator based on mathematical patterns, which on average gives signals with relatively small SL, and also occasionally helps to catch big moves in the markets (more information in the video) This indicator has three main types of notifications: The first type warns of a possible/upcoming signal on the next bar The second type indicates the presence of a ready signal to enter the market/open a position The third type is for SL and TP levels - you will be notified every time price re
Big Player Range
Thalles Nascimento De Carvalho
5 (3)
释放 "BigPlayerRange" 的力量:市场技术分析的利器 我们隆重推出 BigPlayerRange ,一款先进的技术分析工具,专为揭示 市场中机构投资者的兴趣区域 而设计。借助该工具,您可以精准识别大玩家的活跃区域,从而提升您的交易策略的效果。 主要特性: 机构兴趣区域映射 : BigPlayerRange 突出显示金融机构的高活动区域,提供关于市场可能走势的重要见解。 目标退出点的预测 :此指标使用两步预测建议潜在退出点,助您基于价格未来方向规划策略。 回调概率分析 :评估当价格回到识别范围时的 回调概率 ,此功能有助于风险管理和策略调整。 如何使用 BigPlayerRange: 识别兴趣区域 :利用此指标锁定机构活跃的关键区域,从而预测重要市场变动。 目标退出点的预测 :根据指标提供的预测制定退出决策,以实现策略性平仓。 回调概率评估 :监测价格回到兴趣范围时的回调可能性,并据此调整策略。 核心触发点:监控价格相对于绿色和红色线的位置 BigPlayerRange 的中心区域 展示了 机构集中的市场能量 。监控价格相对于 绿色和
VIP Buy Sell Signals
Hapu Arachchilage Tharindu Lakmal
Contact me through this email aaddress to download the FREE strategy PDF for this indicator tharindu999lakmal@gmail.com Introduction   The   "Buy Sell Signals"   is designed to provide BUY and SELL trade signals based on the current market conditions.   A   Trading Strategy   (Chee sheet)  has been  provided for this trading indicator.   (Read the description). This indicator has time tuned e ntry signals . so,   you will enter the market at the very best price level   with this indicator .  
Dinapoli Package MT5
Samil Bozuyuk
5 (2)
All in One package includes the  Oscillator Predictor ,  MACD Predictor ,  Thrust Scanner  and  Advanced Fibonacci  indicators which are mandatory for applying  Dinapoli  trade plans.  Please visit below links for detailed explanations of indicators. Advanced Fibonacci Indicator =>  https://www.mql5.com/en/market/product/107933 Thrust Scanner Indicator =>  https://www.mql5.com/en/market/product/52829 Overbought /Oversold Predictor indicator => https://www.mql5.com/en/market/product/52628 Macd
SMCpro
Arief
5 (2)
Indicator USER MANUAL, trade setups, solving issues, etc :  Direct Download Here     ( for users only ) Hello World! Introducing.. SMCpro tool and Indicator for  MetaTrader 5 , a cutting-edge feature designed to revolutionize your trading experience. With innovative ICT Smart Money Concept, you gain unparalleled insight into market dynamics, empowering you to make informed trading decisions like never before. SMC Indicator built on the foundation of advanced algorithms and real-time dat
The indicator is designed to close positions on the market in time. For example: to take profits ahead of schedule if the price has not reached TakeProfit, and the market is turning around. The indicator analyzes the momentum, not the trend. He does not give any information about the trend. The indicator is well suited for finding divergence. The Ershov 38 Parrots indicator dynamically adjusts to the market and detects price movement impulses of medium and high amplitude. It almost does not rea
VTrende Pro
Andrii Diachenko
5 (1)
VTrende Pro - MTF indicator for trend trading with a display panel for MT5 *** Videos can be translated into any language using subtitles (video language - Russian) Although the signals of the VTrende Pro indicator can be used as signals of a full-fledged trading system, it is recommended to use them in conjunction with the Bill Williams TS. VTrende Pro is an extended version of the VTrende indicator. Difference between Pro version and VTrende: - Time zones - Signal V - signal 1-2 waves -    S
The Volume Spread Analysis indicator is based on the original Volume Spread Analysis method. It was designed for quick and easy recognition of VSA patterns. Even though this indicator looks very simple, it is the most sophisticated tool we've ever made. It is a really powerful analytical tool that generates very reliable trading signals. Because it is very user-friendly and understandable, it is suitable for every type of trader, regardless of his experience. What is VSA? VSA - Volume Spread A
Meco Ultimate Channel
Thapelo Kapwe
5 (1)
This indicator belongs to the family of channel indicators. These channel indicator was created based on the principle that the market will always trade in a swinging like pattern. The swinging like pattern is caused by the existence of both the bulls and bears in a market. This causes a market to trade in a dynamic channel. it is designed to help the buyer to identify the levels at which the bulls are buying and the bear are selling. The bulls are buying when the Market is cheap and the bears a
SYSTEM INTRODUCTION:   The Binary Options Conqueror System Is Specifically Designed For Binary Options Trading. Unlike Other Systems And Indicators That Were Adopted From Other Trading Environments For Binary Options. Little Wonder Why Many Of Such Systems Fail To Make Money . Many End Up Loosing Money For Their Users.     Forward Testing Of The System Has Shown Remarkable Results . The Results Of Forward Testing On Live Trading Account Is Consistent With The Results Obtained By Back Testing .
筛选:
无评论
回复评论