Visual ATR Bands Bounce Indicator MT4
- 指标
- AL MOOSAWI ABDULLAH JAFFER BAQER
- 版本: 1.21
- 更新: 3 二月 2025
- 激活: 5
The Visual ATR Bands Bounce Indicator is a robust tool designed to empower traders with advanced insights into price action using Average True Range (ATR) bands. Please note, this indicator is not optimized, giving you the freedom and flexibility to tailor it to your trading style and strategy.
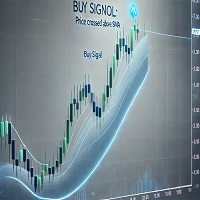
The Visual ATR Bands Bounce Indicator leverages the power of ATR to dynamically plot bands around price action. These bands serve as a flexible envelope, adapting to market volatility. The key idea is to identify potential bounce zones when price interacts with these bands, enabling traders to capture high-probability reversal opportunities.
The ATR bands are calculated based on market volatility, ensuring they adjust to changing conditions and provide meaningful bounce points. When price touches or penetrates the bands, it indicates potential exhaustion or overextension, making it a prime spot for a reversal or correction. Use the indicator across different timeframes to confirm trends and avoid false signals. Enhance accuracy by pairing this indicator with trend-based tools like moving averages or oscillators.
This tool is perfect for traders who appreciate volatility-based strategies and prefer to adapt their setups. Whether you are a swing trader or scalper, the ATR Bands Bounce Indicator provides an adaptable framework for spotting reversals.
This indicator is customizable, allowing you to adjust the settings to match your preferred ATR period and band multipliers. The dynamic nature of the ATR bands ensures it stays relevant, even in volatile markets. It is designed for traders to optimize and fine-tune, unlocking its full potential based on individual preferences.
Need help? Contact me via direct message for support. Visit my MQL5 profile to explore more EAs and indicators that suit your trading style.
Start optimizing your trading strategy today with the Visual ATR Bands Bounce Indicator.
