Visual EMA ReversalScout Indicator MT4
- 指标
- AL MOOSAWI ABDULLAH JAFFER BAQER
- 版本: 1.0
- 激活: 5
The Visual EMA ReversalScout Indicator combines a powerful EMA crossover strategy with RSI-based divergence detection to generate reliable buy and sell signals. Its advanced logic ensures robust and actionable market insights while maintaining flexibility for optimization.
🔍 Strategy Breakdown
1️⃣ EMA Crossovers:
- Uses Fast EMA and Slow EMA to identify trend directions and reversals.
- Bullish signals arise when the Fast EMA crosses above the Slow EMA, indicating an uptrend.
- Bearish signals occur when the Fast EMA crosses below the Slow EMA, signaling a downtrend.
2️⃣ EMA Slope Filtering:
- Analyzes the slope of the Fast EMA over recent bars to confirm trend momentum.
- Prevents false signals by ensuring consistent EMA movement in the signal direction.
3️⃣ RSI Divergence:
- Detects price-RSI divergence to enhance signal reliability.
- Bullish Divergence: Price makes lower lows, while RSI forms higher lows.
- Bearish Divergence: Price makes higher highs, while RSI forms lower highs.
4️⃣ Overbought/Oversold Conditions:
- Integrates RSI levels to identify overbought (above 70) and oversold (below 30) zones, enhancing reversal predictions.
5️⃣ Signal Delay Mechanism:
- Implements a delay feature to avoid redundant signals within a specified number of bars, reducing market noise and overtrading.
📊 Key Features
✅ Adaptive Parameters: Customize EMA periods, RSI settings, and divergence length for different assets and timeframes.
✅ Visual Indicators:
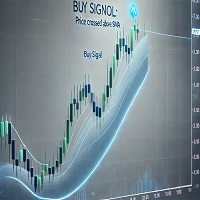
- Green Arrows: Buy signals.
- Red Arrows: Sell signals.
✅ Dynamic RSI Display: Shows RSI levels in a separate window with clear overbought and oversold zones.
✅ Detailed Logs: Monitor signal generation and skipped signals for deeper analysis.
💡 How to Use
- Install and Apply: Add the indicator to your chart and configure input parameters as per your strategy.
- Follow the Signals: Enter trades when buy or sell arrows appear.
- Optimize Settings: Adjust EMA and RSI values based on the market conditions.
🚀 Why Choose This Indicator?
🔹 Combines two proven strategies (EMA and RSI divergence) for accurate signals.
🔹 Offers flexibility with parameter optimization.
🔹 Works seamlessly across all timeframes and asset classes.
🔗 Explore More
Visit my official website to discover other innovative EAs and indicators tailored to elevate your trading success.
Start your journey to smarter trading today with the Visual EMA ReversalScout Indicator for just $65! 💹


