Visual EMA PriceSync Indicator MT4
- 指标
- AL MOOSAWI ABDULLAH JAFFER BAQER
- 版本: 1.4
- 更新: 6 二月 2025
- 激活: 5
Visual EMA PriceSync Indicator
Price: $65
Discover a cutting-edge trading indicator designed to synchronize price action with EMA (Exponential Moving Average) trends. The Visual EMA PriceSync Indicator is your ultimate tool for identifying precise market entry and exit points, making it an essential addition to any trader’s arsenal.
What does it do?
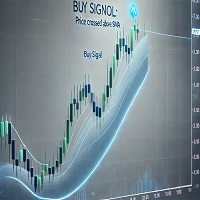
The indicator detects crossover signals between the price and EMA, which signify potential trend reversals or market corrections. These signals are displayed directly on your chart with clear and vibrant buy and sell arrows, ensuring you never miss a trading opportunity.
How does it work?
- EMA Calculation: The indicator calculates the EMA based on your chosen period. EMA smooths price data to reveal the trend direction effectively.
- Price Crossover Detection: It monitors price movements relative to the EMA.
- A BUY signal appears when the price crosses above the EMA, suggesting bullish momentum.
- A SELL signal occurs when the price crosses below the EMA, indicating bearish momentum.
- Signal Delay Control: You can customize the bars delay parameter to filter out false signals and reduce market noise.
- Dynamic Logs: Enable detailed logs to track signal behavior and gain insights into the logic behind every arrow plotted on the chart.
Key Features:
- Adaptive Settings: Adjust the EMA period and signal delay to fit your trading style.
- Vivid Visuals: Intuitive arrows and a smooth EMA line help you identify trends effortlessly.
- Real-Time Alerts: Signals are plotted as soon as conditions are met, ensuring timely decisions.
- User-Friendly: Perfect for all experience levels, from beginners to pros.
Why choose this indicator?
- It simplifies complex market data into actionable signals.
- Enhances your trading efficiency by providing high-accuracy alerts.
- Allows you to backtest and optimize parameters to suit various markets.
- Works seamlessly across all timeframes and assets.
Example Strategy:
Use the BUY and SELL arrows as triggers for entry, then combine them with your preferred stop-loss and take-profit levels. For instance:
- Enter a BUY when the indicator signals and the price breaks out above a key resistance level.
- Exit when a SELL signal appears, or at your predefined target.
Explore More:
Visit my official website to check out other powerful EAs and indicators, each crafted to elevate your trading success.
Invest Now:
Take control of your trades with the Visual EMA PriceSync Indicator for just $65 and experience the power of synchronized price and EMA analysis. Your journey to smarter trading starts here!
