Iranger
- 实用工具
- Gennadiy Stanilevych
- 版本: 1.0
Description The indicator based on Average True Range (ATR) is designed to accurately determine the possible range of price fluctuations on a selected timeframe. This tool is ideal for both beginner traders and experienced professionals looking to effectively plan their trades.
Key Features:
-
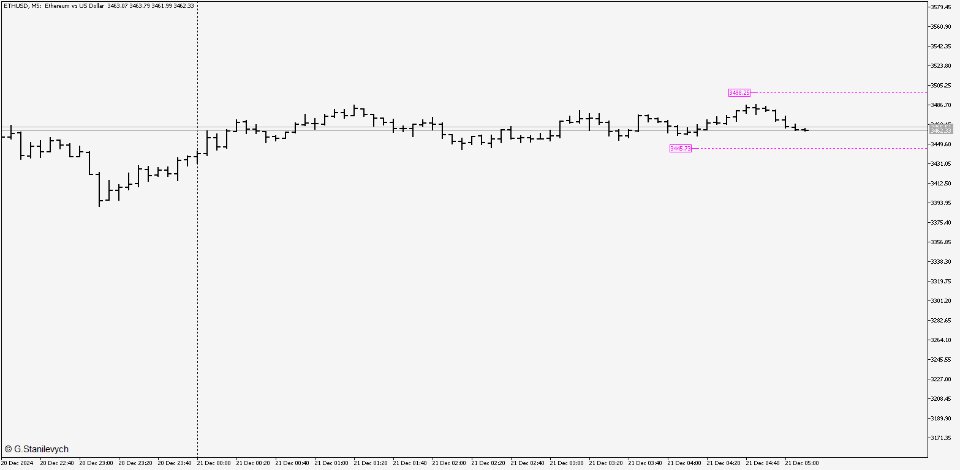
Displays possible price fluctuation levels on the chart, simplifying visual analysis.
-
Utilizes the power of the ATR algorithm to calculate precise volatility values.
-
Adapts to any timeframe, providing relevant data regardless of the trading style.
-
Useful for setting target profit levels (Take Profit) and stop-loss levels (Stop Loss).
-
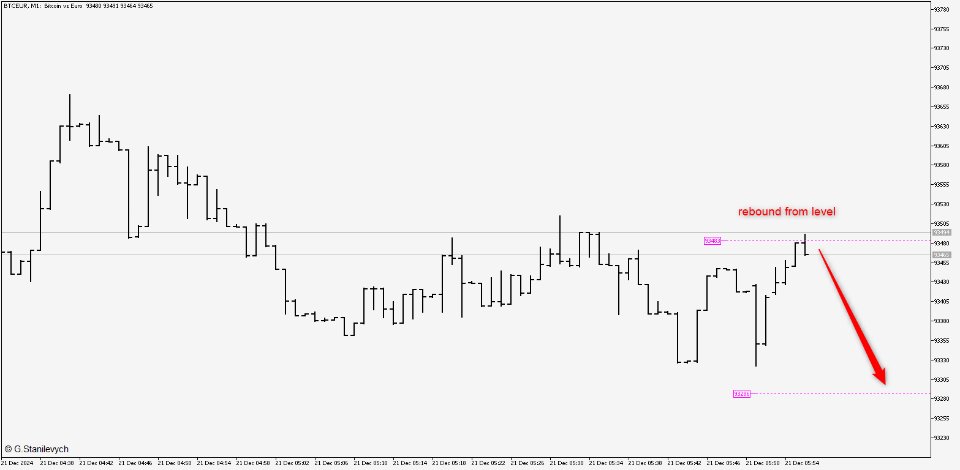
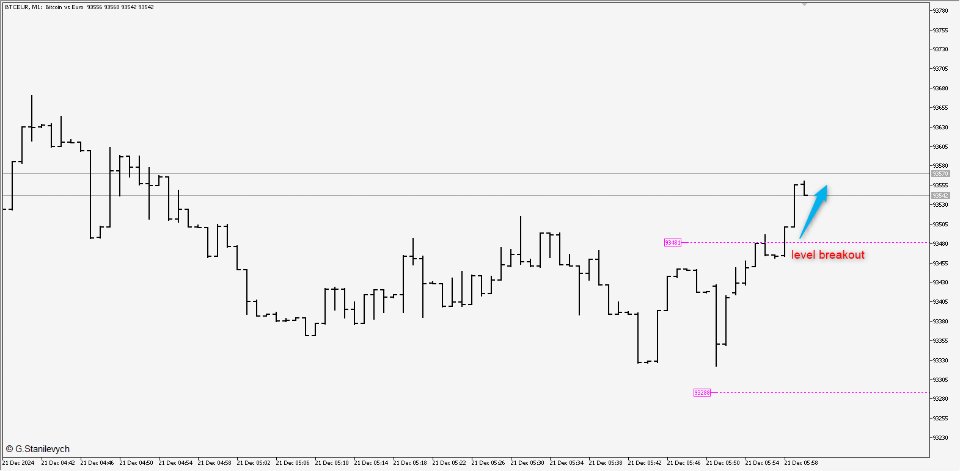
Indicates key levels that can be used for breakout or rebound trading.
Advantages:
-
Enables real-time assessment of asset volatility.
-
Reduces the risk of poor trade planning through objective data.
-
Helps adapt to current market conditions.
The indicator is suitable for intraday trading, scalping, and medium-term strategies. It will become an indispensable tool for those looking to increase their profitability through competent volatility analysis.
Settings:
ATRPeriod=100; /*ATR period*/
clrBuy=clrMagenta; /*Critical level for time frame*/
clrSel=clrMagenta; /*Critical level for time frame*/
LineStyle=STYLE_DOT;
LineWidth=1;
bMail=true;
bAlert=false;
bPush=true;
Usage Recommendations:
-
Apply the indicator to the chart of the desired asset.
-
Configure ATR parameters for optimal level display.
-
Use the indicated levels for trading:
-
On a breakout, when the price confidently moves beyond the range.
-
On a rebound, when the price shows a reversal from the boundary of the range.
-
The indicator helps identify key entry and exit points, simplifying trading decisions and risk management.

