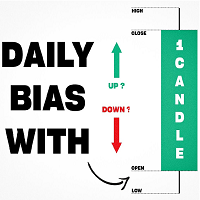
Daily Bias by candle closure for MT4
- 指标
- Minh Truong Pham
- 版本: 1.0
- 激活: 5
Inspired by TTrades video on daily bias, this indicator aims to develop a higher timeframe bias and collect data on its success rate. While a handful of concepts were introduced in said video, this indicator focuses on one specific method that utilizes previous highs and lows. The following description will outline how the indicator works using the daily timeframe as an example, but the weekly timeframe is also an included option that functions in the exact same manner.
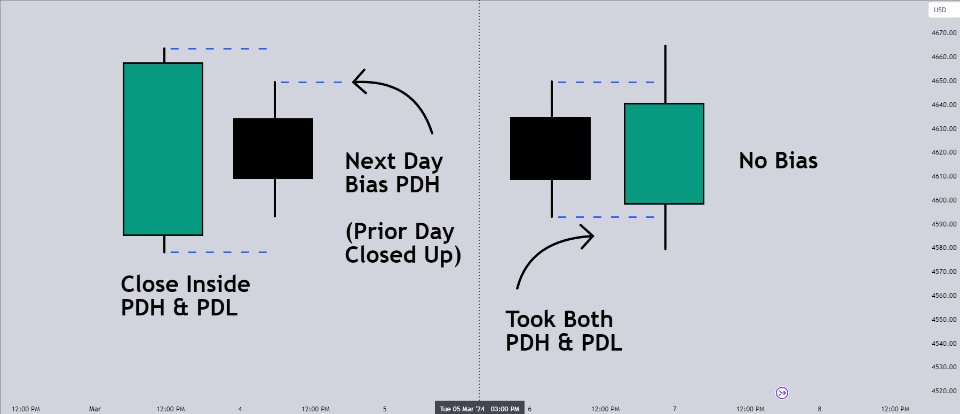
On the daily timeframe, there are a handful of possible scenarios that we consider: if price closes above its previous day high (PDH), the following day's bias will target PDH; if price trades above its PDH but closes back below it, the following day's bias will target its previous day low (PDL). Figure 1
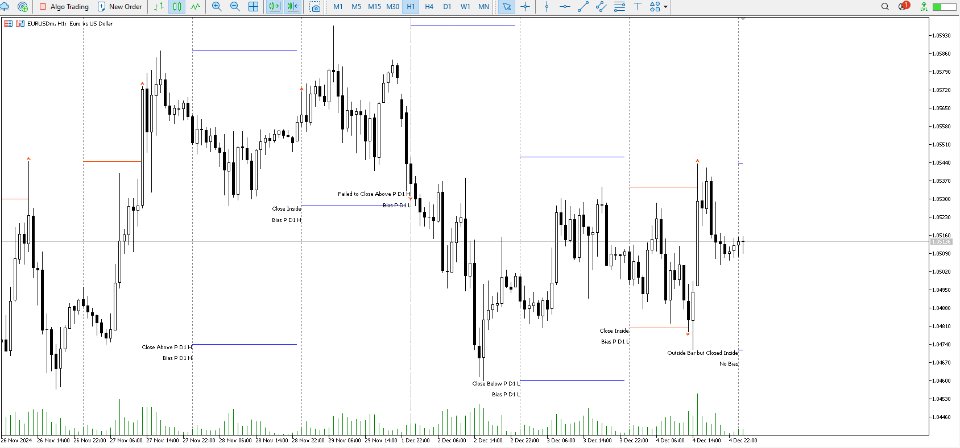
With a rigid framework in place, we can apply it to the charts and observe the results. Figure 2
As shown above, each new day starts by drawing out the PDH and PDL levels. They start out as blue and turn red once traded through (these are the default colors which can be changed in the indicator's settings). The triangles you see are plotted to indicate the time at which PDH or PDL was traded through. This color scheme is also applied to the table in the top right; once a bias is determined, that cell's color starts out as blue and turns red once the level is traded through.
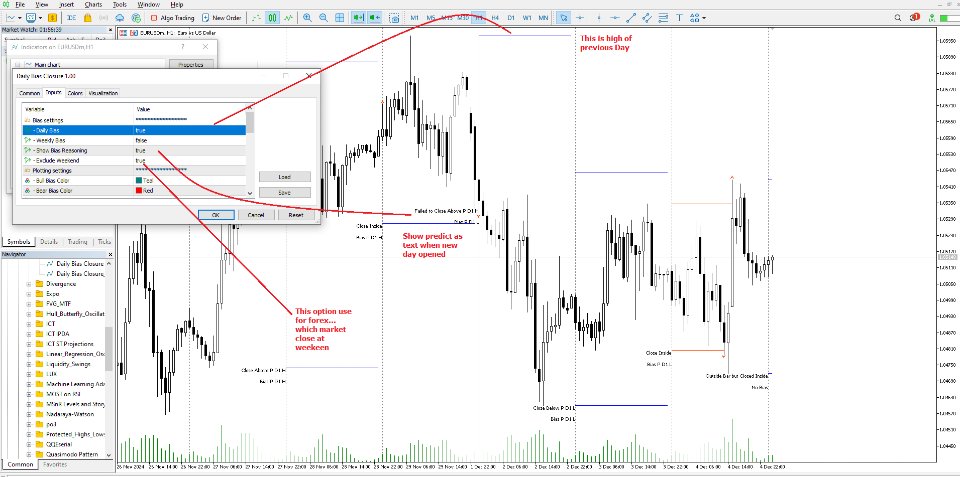
Setting:
+ Show daily / weekly bias as horizontal line
+ Show Prediction
+ Exclude Weekend (forex market is closed at weekend but cryptol keep running)
See fingure 3 for more detail
- Style settings :
+ Before Hit Colors: color of daily/weekly bias line when price not touch this level yet
+ After Hit Colors: color of daily/weekly bias line when price is touched this level
+ Day Separator: show daily seperator. Same with Week Separator
- Notification settings
