XCalper TFO
- 指标
- Aecio de Feo Flora Neto
- 版本: 1.20
- 更新: 15 七月 2020
- 激活: 10
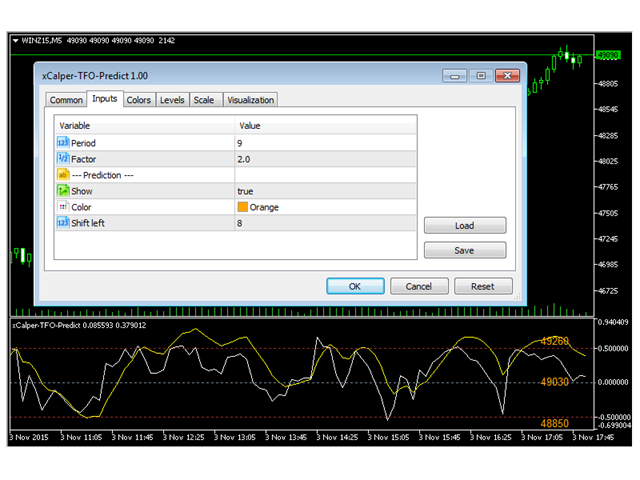
This oscillator was developed exclusively by xCalper in 2015 based on moving averages calculations to indicate and try predicting oversold and overbought levels.
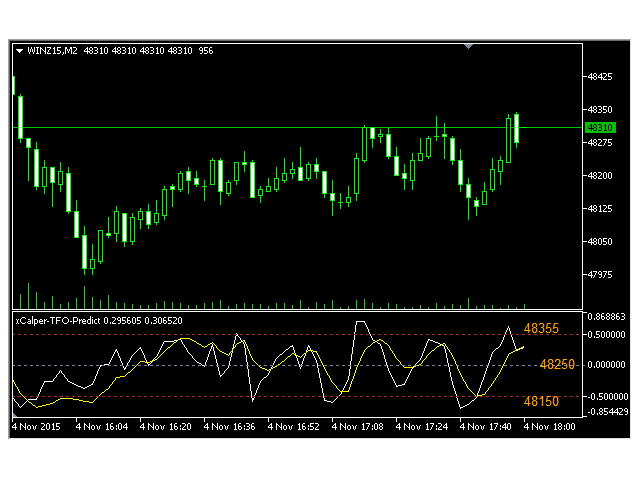
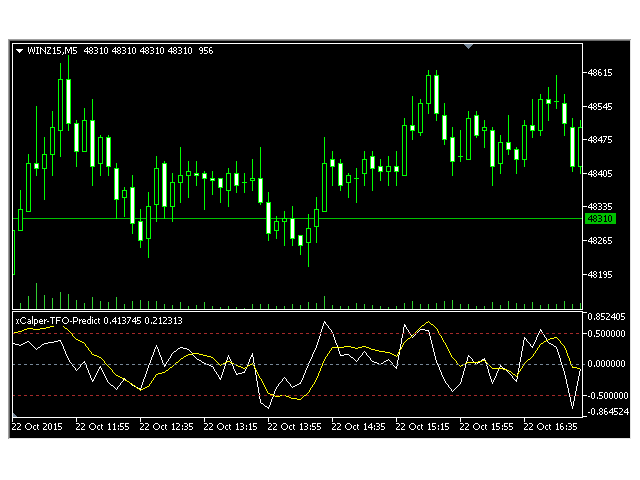
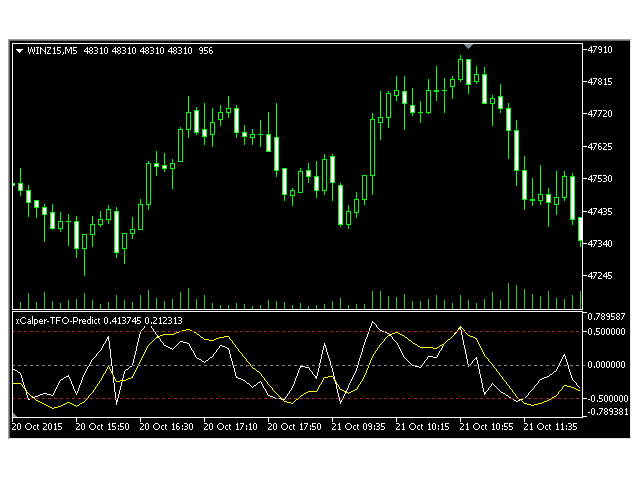
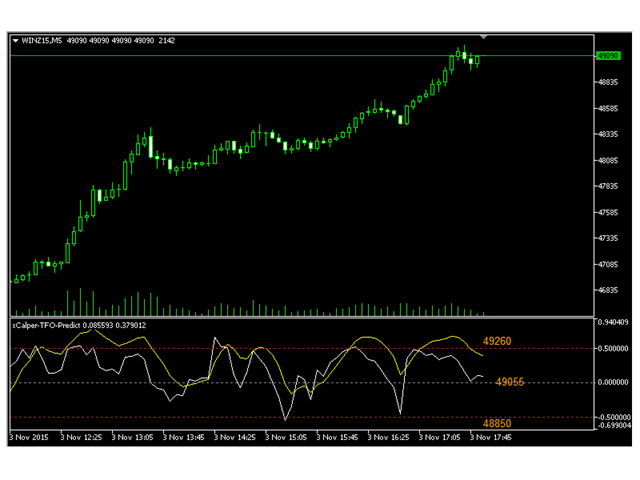
The fast line (white, by default) oscillates basically between values -0.5 (oversold) and +0.5 (overbought). Whenever this line crosses upward value -0.5, it means an oversold price level. When it crosses downward value +0.5, it means an overbought price level. When fast line crosses value 0.0 and returns, it is a strong pull-back indication.
The slow line (yellow, by default) is a simple average of fast line with period and scale as parameters. This line has similar interpretation of the fast line for its oversold/overbought levels.
Additionally, slow line signal (positive, above 0.0 or negative, below 0.0) can guide trade direction in conjunction with fast line.
This oscillator is better used in sideway markets, where its optional but powerful price prediction can help traders and scalpers to enter and exit positions.

