• 概述
  • 评论
  • 评论

Hit Rate Top Bottom Signal

命中率顶部底部信号

命中率顶部底部信号

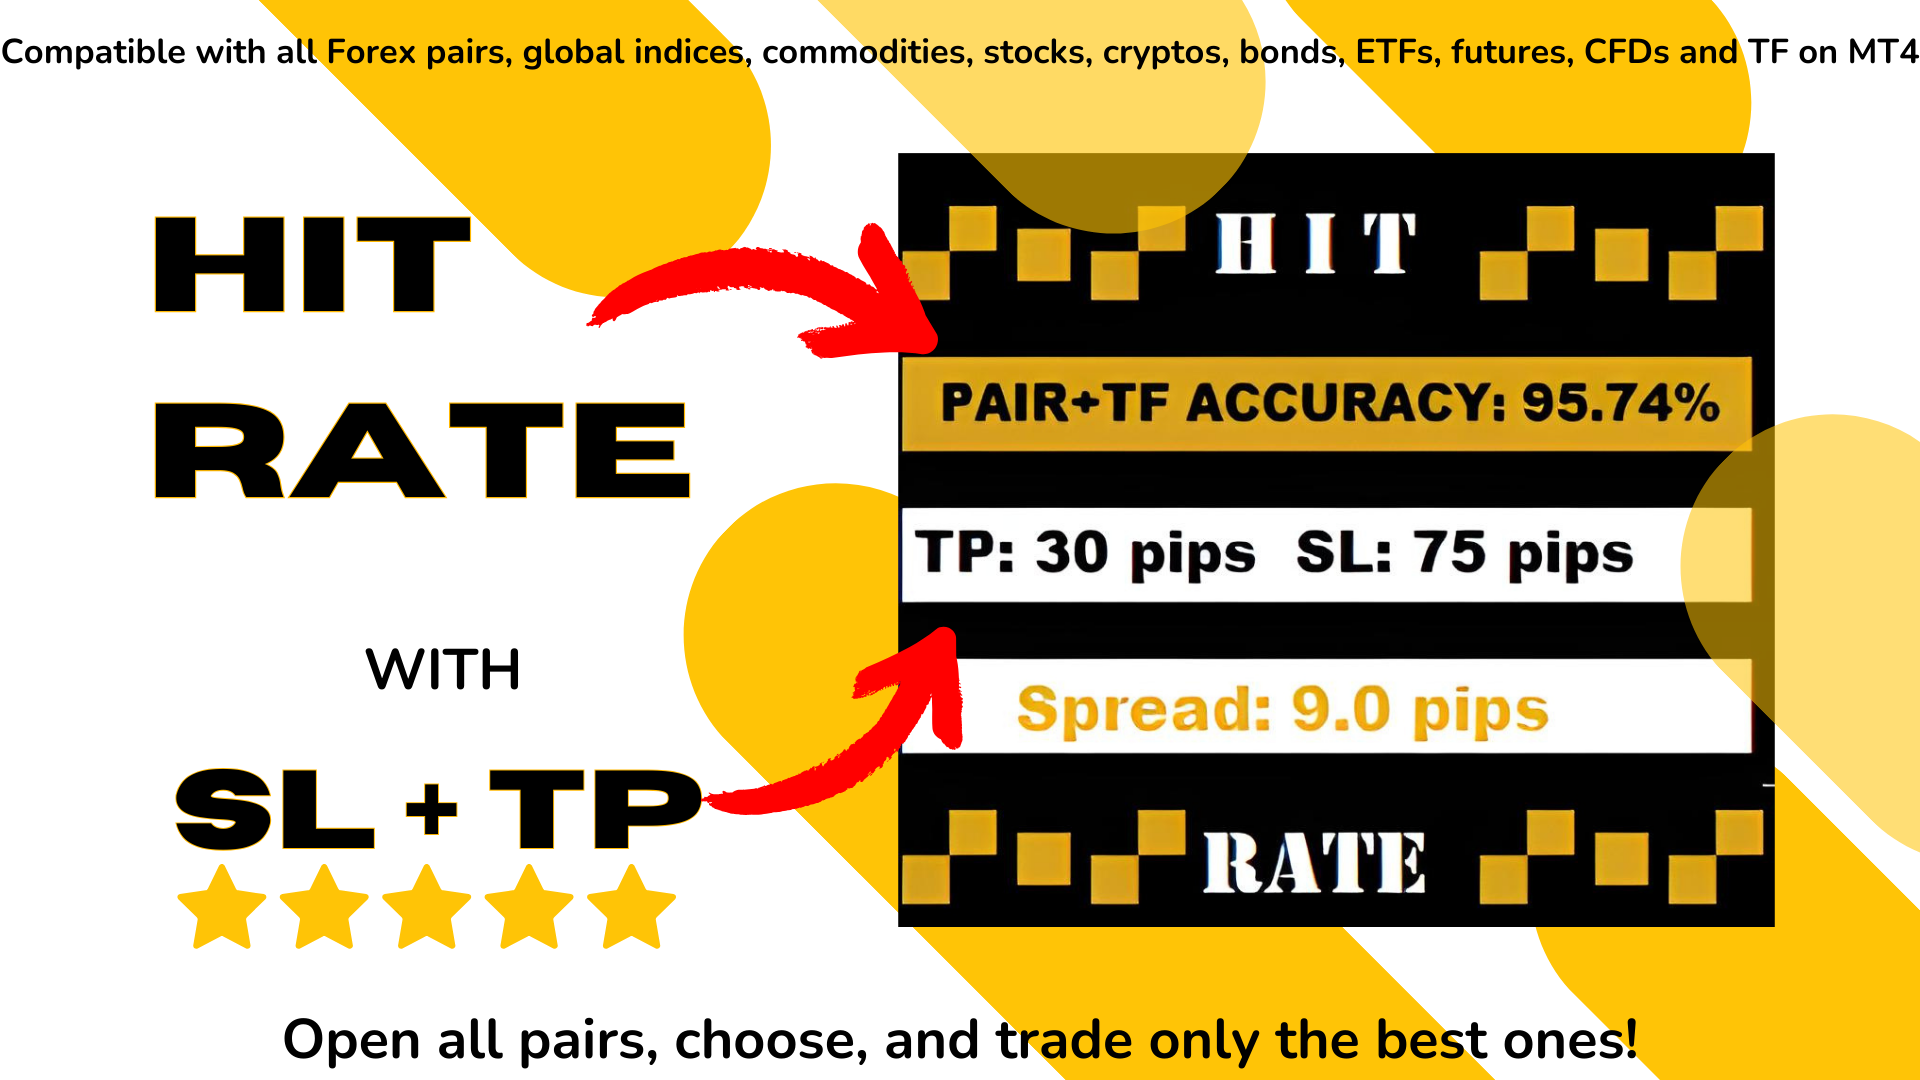
命中率顶部底部信号 提供了一种完全创新的方法。它非常适合那些希望预先评估信号在特定 TP-SL 下的表现以及在哪些货币对/时间框架(TF)中效果最佳的人。

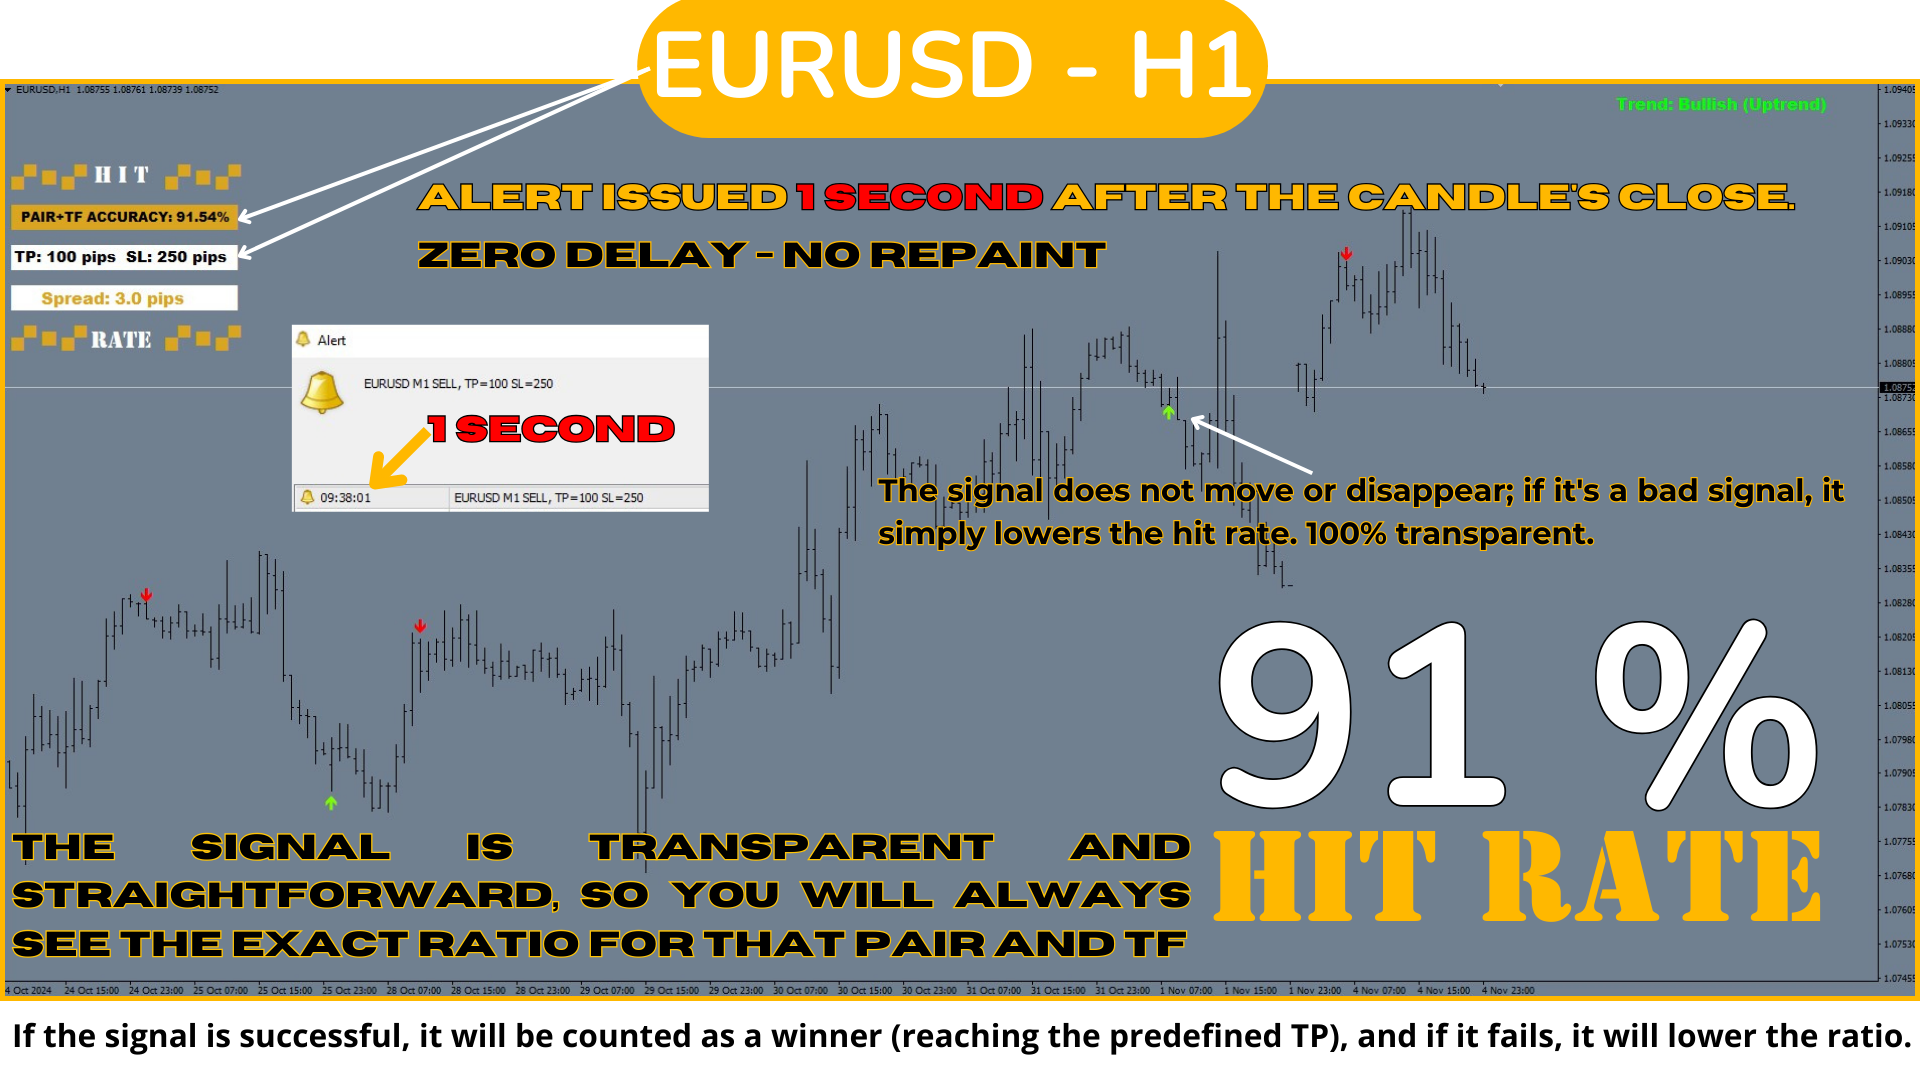
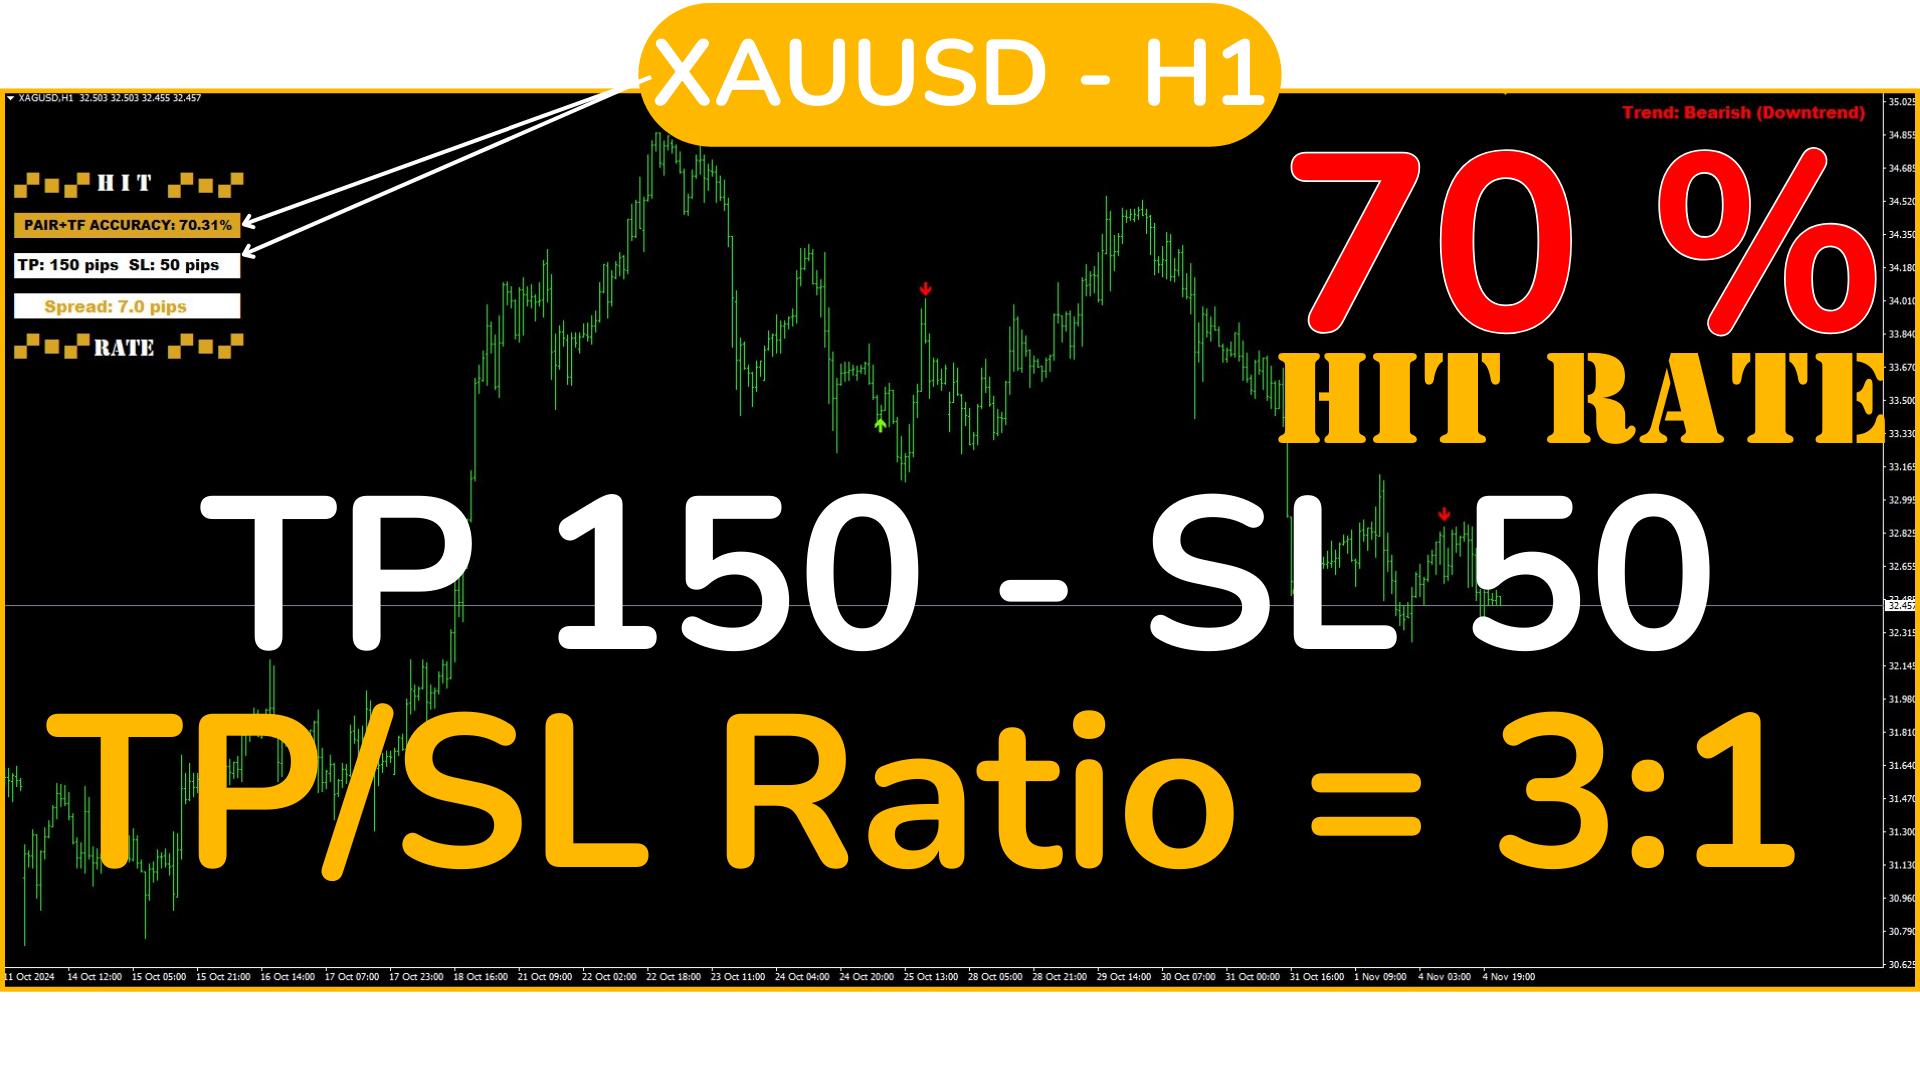
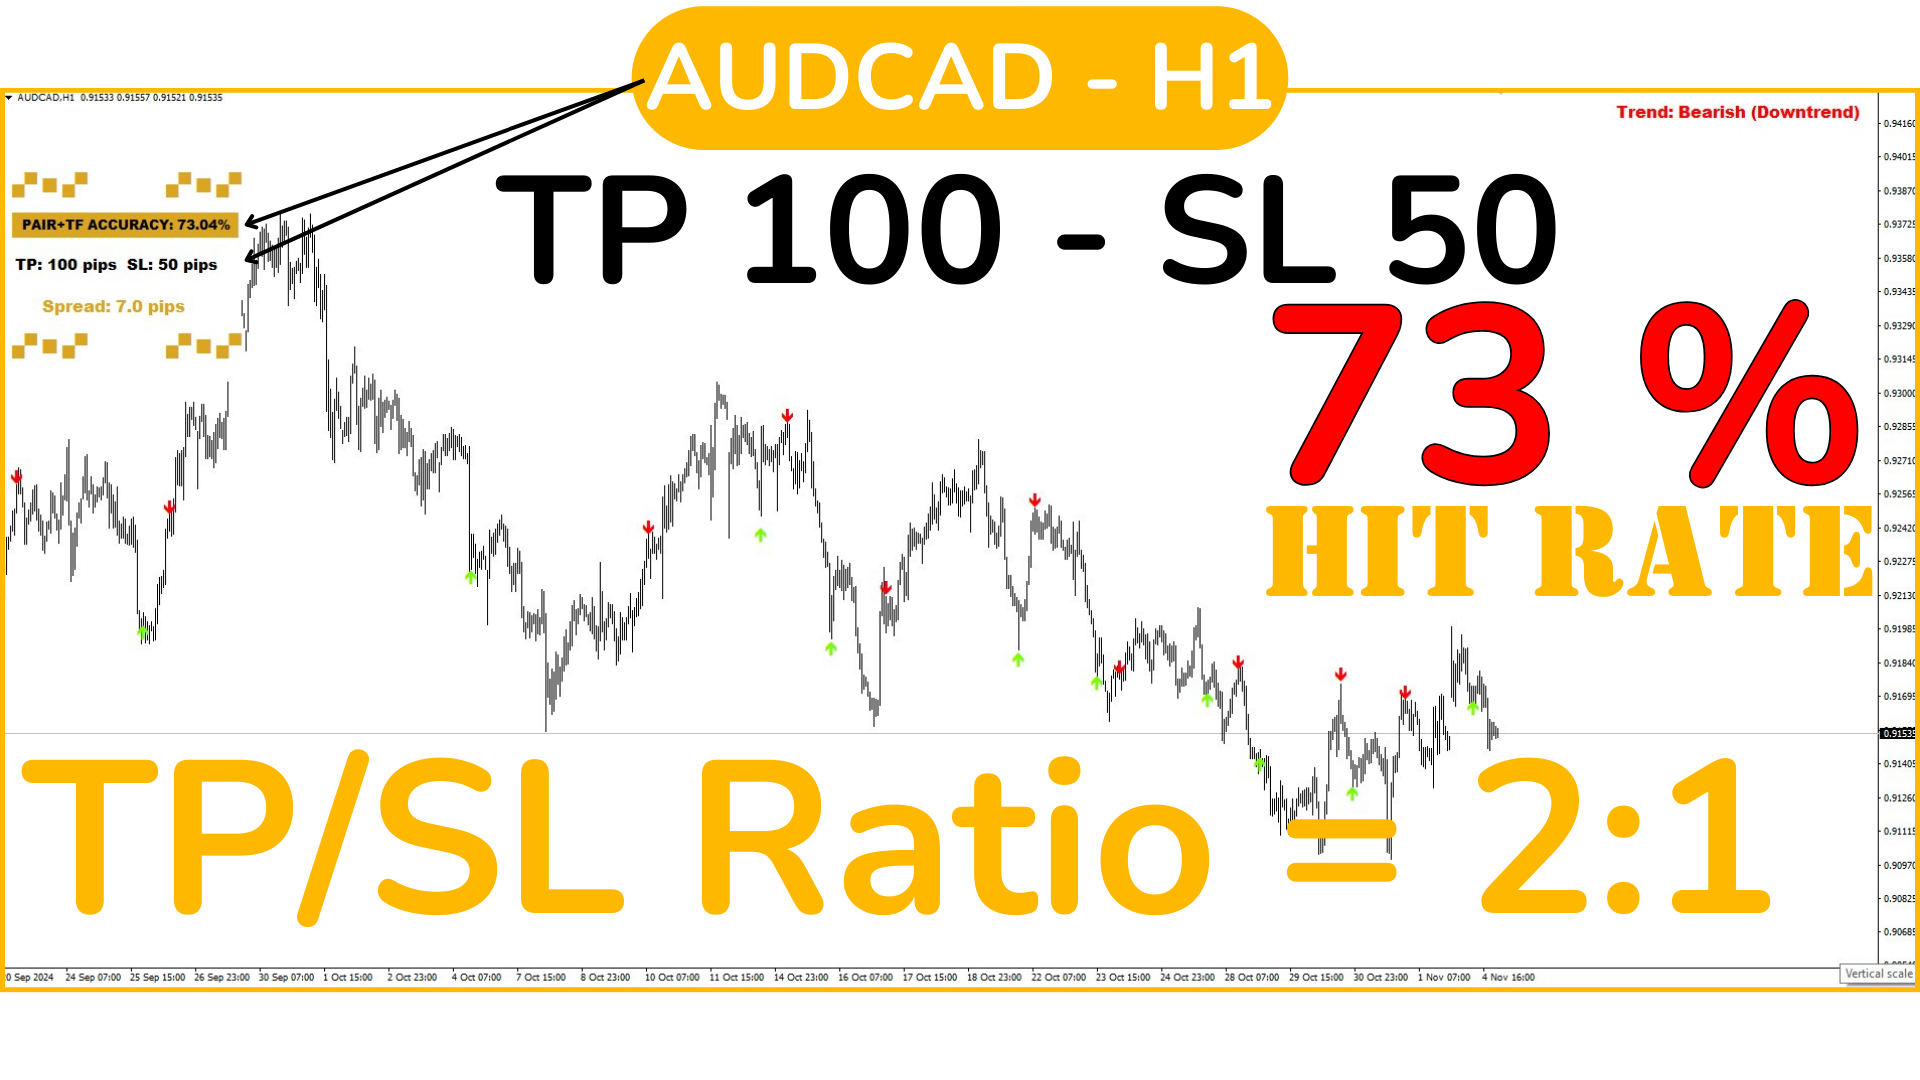
命中率顶部底部信号 策略是 任何交易员和任何交易类型 的重要工具,因为它不仅发出 精确且不重绘的信号,明确指示何时交易以及交易方向,而且还 详细记录每个货币对和时间框架的命中率,并预设止盈(TP)和止损(SL)。这使得能够提前知道信号的有效性比率,对于良好的风险管理和精确的交易至关重要。

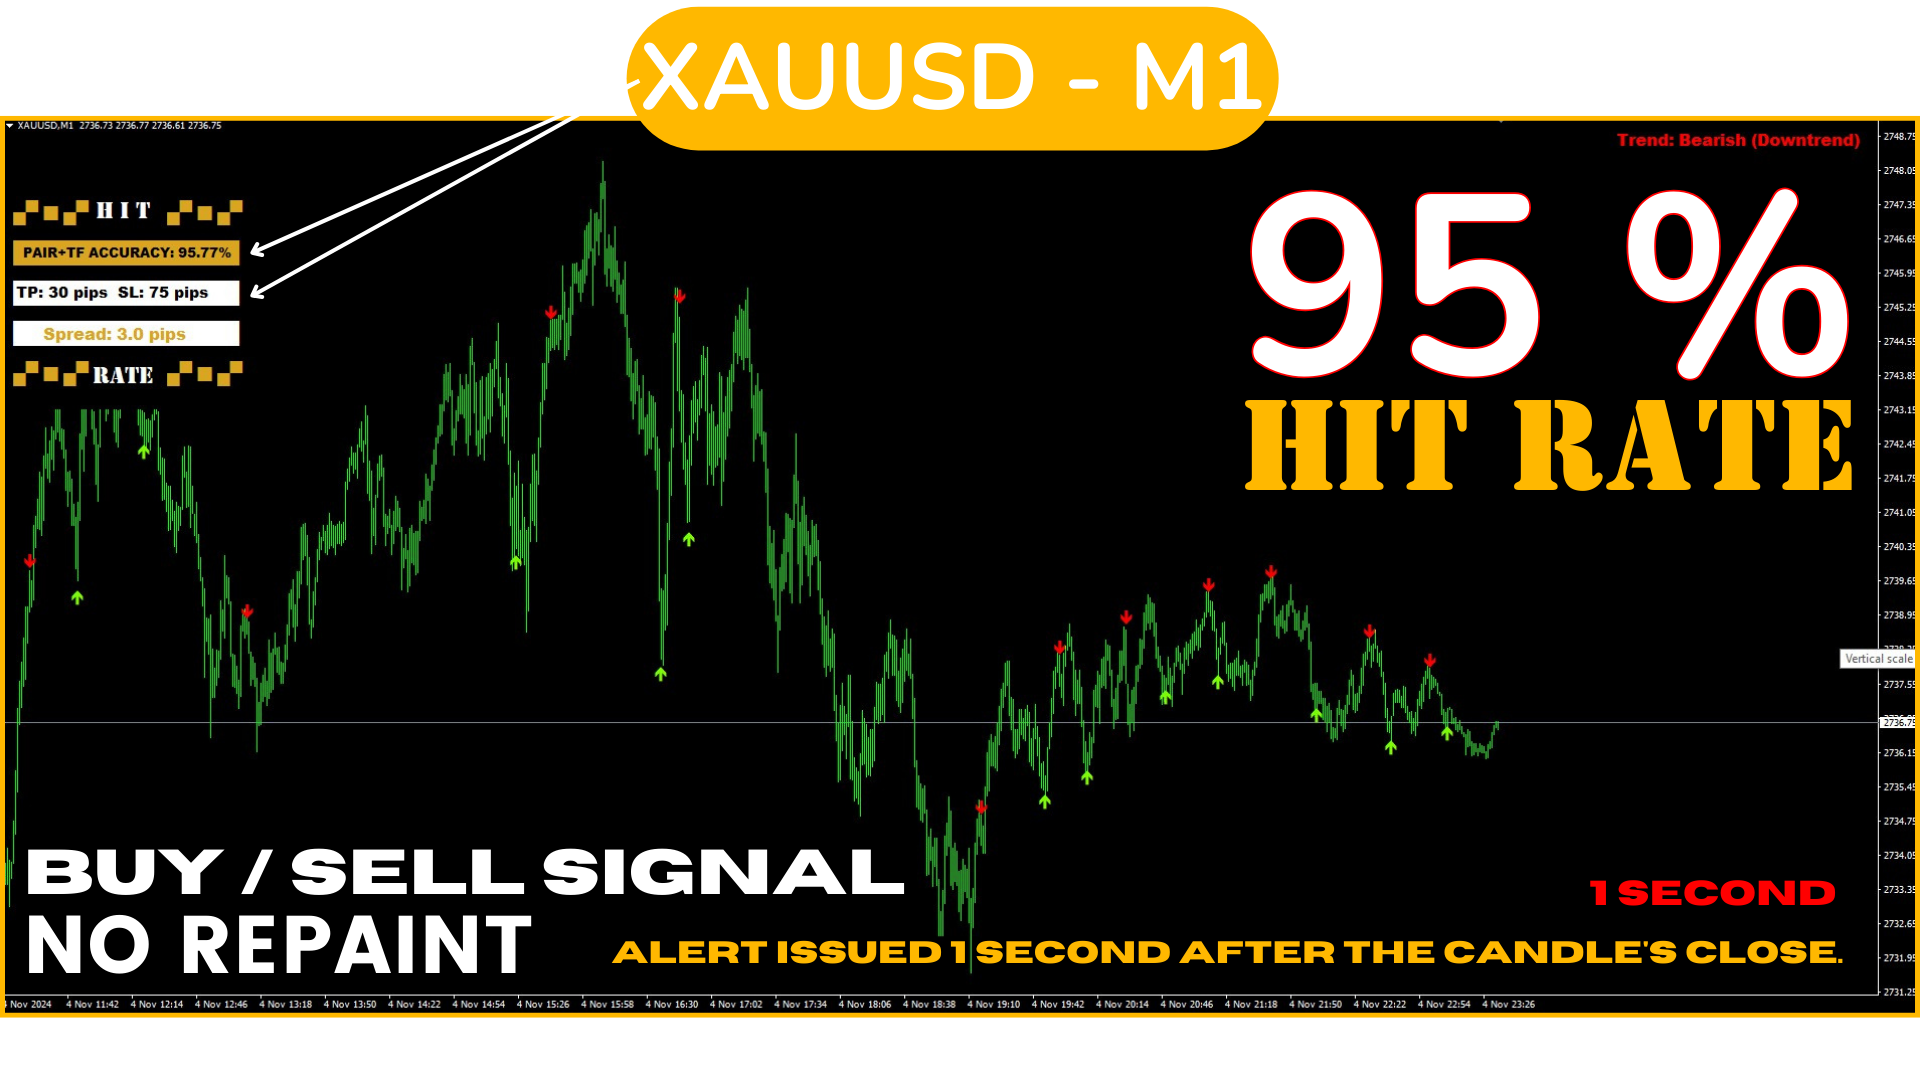
该策略的独特之处在于它专注于在波动的反转点进行检测,而不是在整个行情中,这使得信号的发出频率比传统的顶部底部信号更高,专注于
市场每一个重要波动的关键时刻。


这种以百分比显示 信号历史效果与SL/TP比率结合的能力 使得这项策略成为安全交易的最佳选择,让交易员能够基于数据做出决策。依靠一个不仅清晰直接而且历史记录良好的信号,我们正在使用市场上最好的策略之一。


如何使用该系统进行交易?

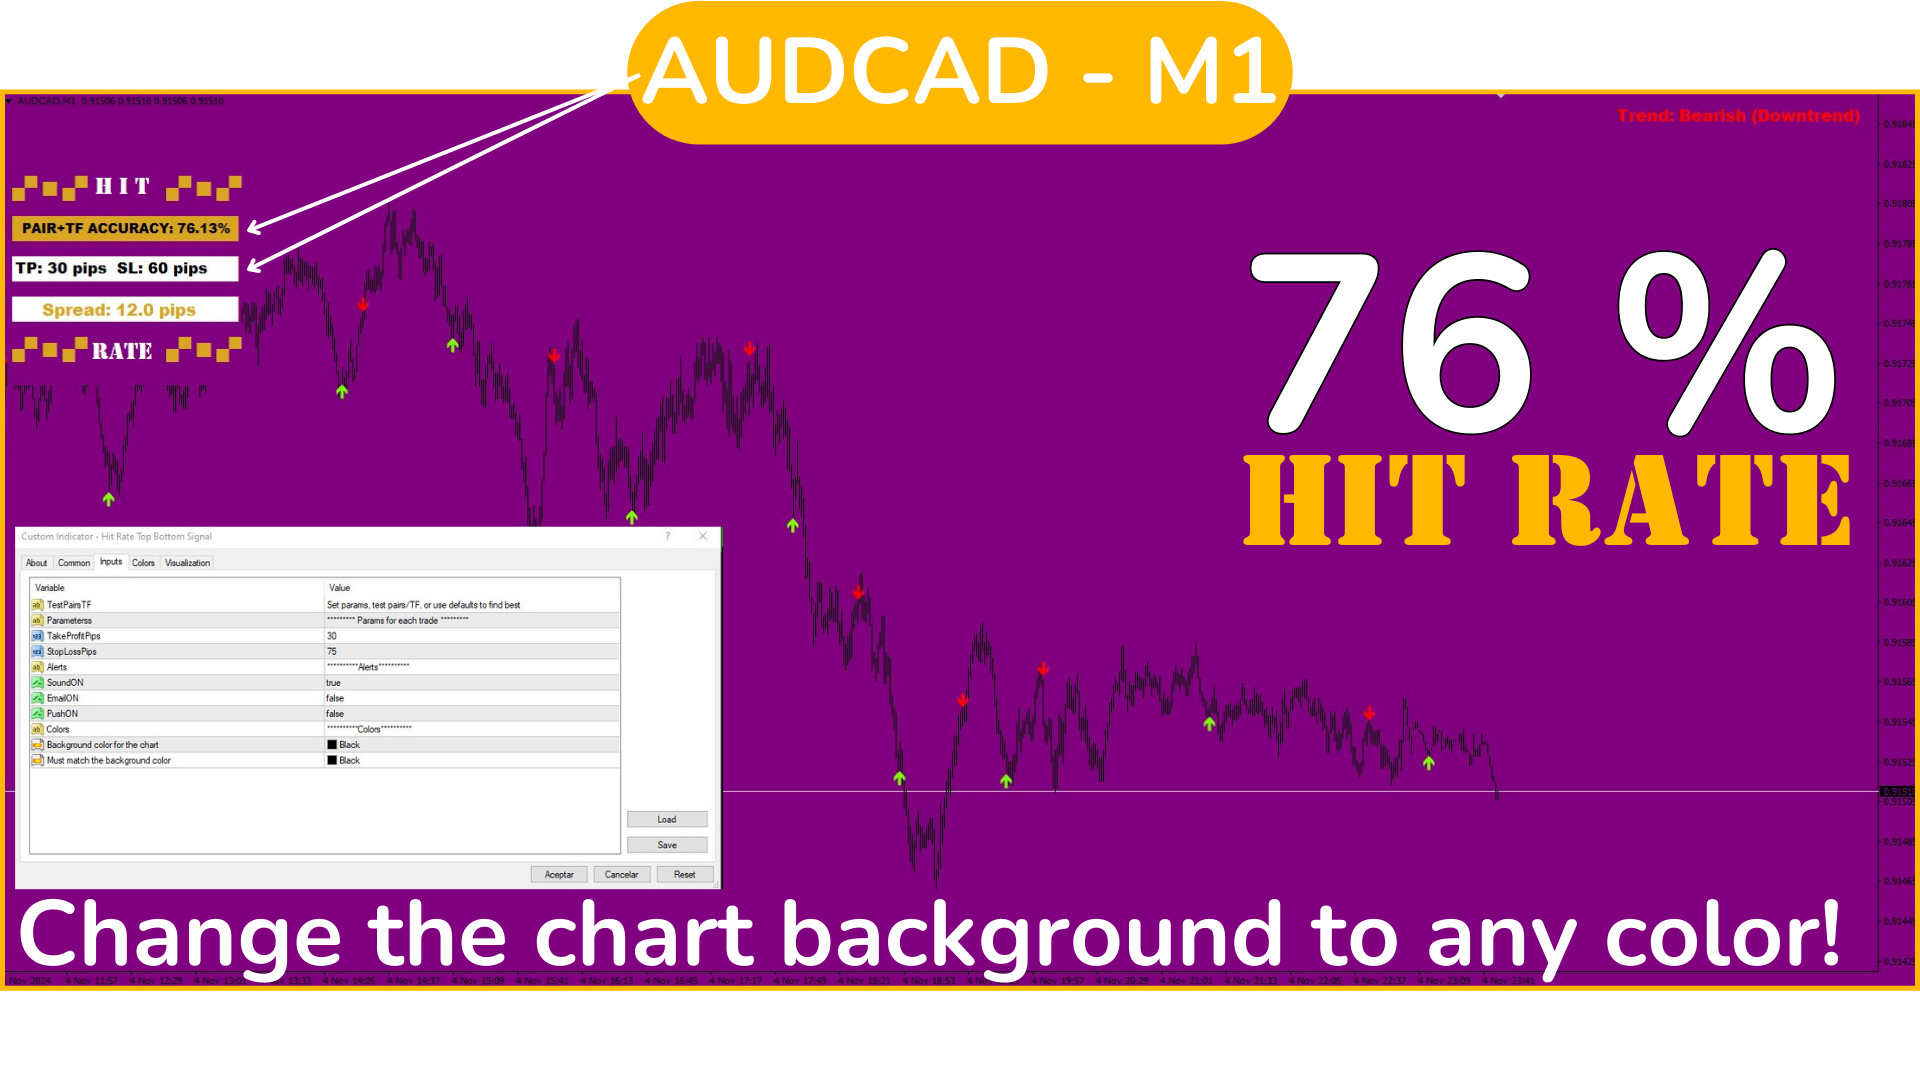
打开多个货币对并在每个货币对上加载指标。现在,分析每个货币对,以确定哪些货币对和时间框架(TF)信号效果最好,并集中精力在这些货币对上。(见图)

默认情况下,信号设有100点的TP和250点的SL,但您可以设置自己想要的值或保留默认值。

请注意,250点的SL在H1和M1上并不相同,但不用担心:手动更新SL和TP参数时,系统会重新计算该信号在新参数下的命中率,从而提前知道这些参数的预期结果。

这样,您可以调整每个货币对的具体参数以“优化”该货币对和时间框架的策略,从而了解该信号在该特定背景下的命中率。建议每天进行此过程,每次交易前都要进行,以识别当前最有效的货币对/时间框架。默认参数在M30或H1等时间框架上效果最好,具体取决于货币对。

步骤说明:

  1. 选择一个货币对并检查每个时间框架。 验证在哪一个的命中率最高,例如,如果使用默认TP和SL设置,命中率超过85%-90%。选择该时间框架。 若您不使用默认TP和SL,欲了解最佳比率,请阅读下方的“SL/TP与命中率比率”。

  2. 对所有可用的货币对重复此过程;货币对越多,您将获得更多交易机会。

  3. 现在,只需等待信号并在信号发出后立即进行交易,遵循预设的SL和TP。

  4. 如果您希望选择特定的TP和SL进行交易,首先需在“输入”标签中修改数据并设置每个货币对的值,始终以点数为单位。然后检查该货币对的每个时间框架,选择效果最好的时间框架并保持关注信号。

在手机上自由交易:

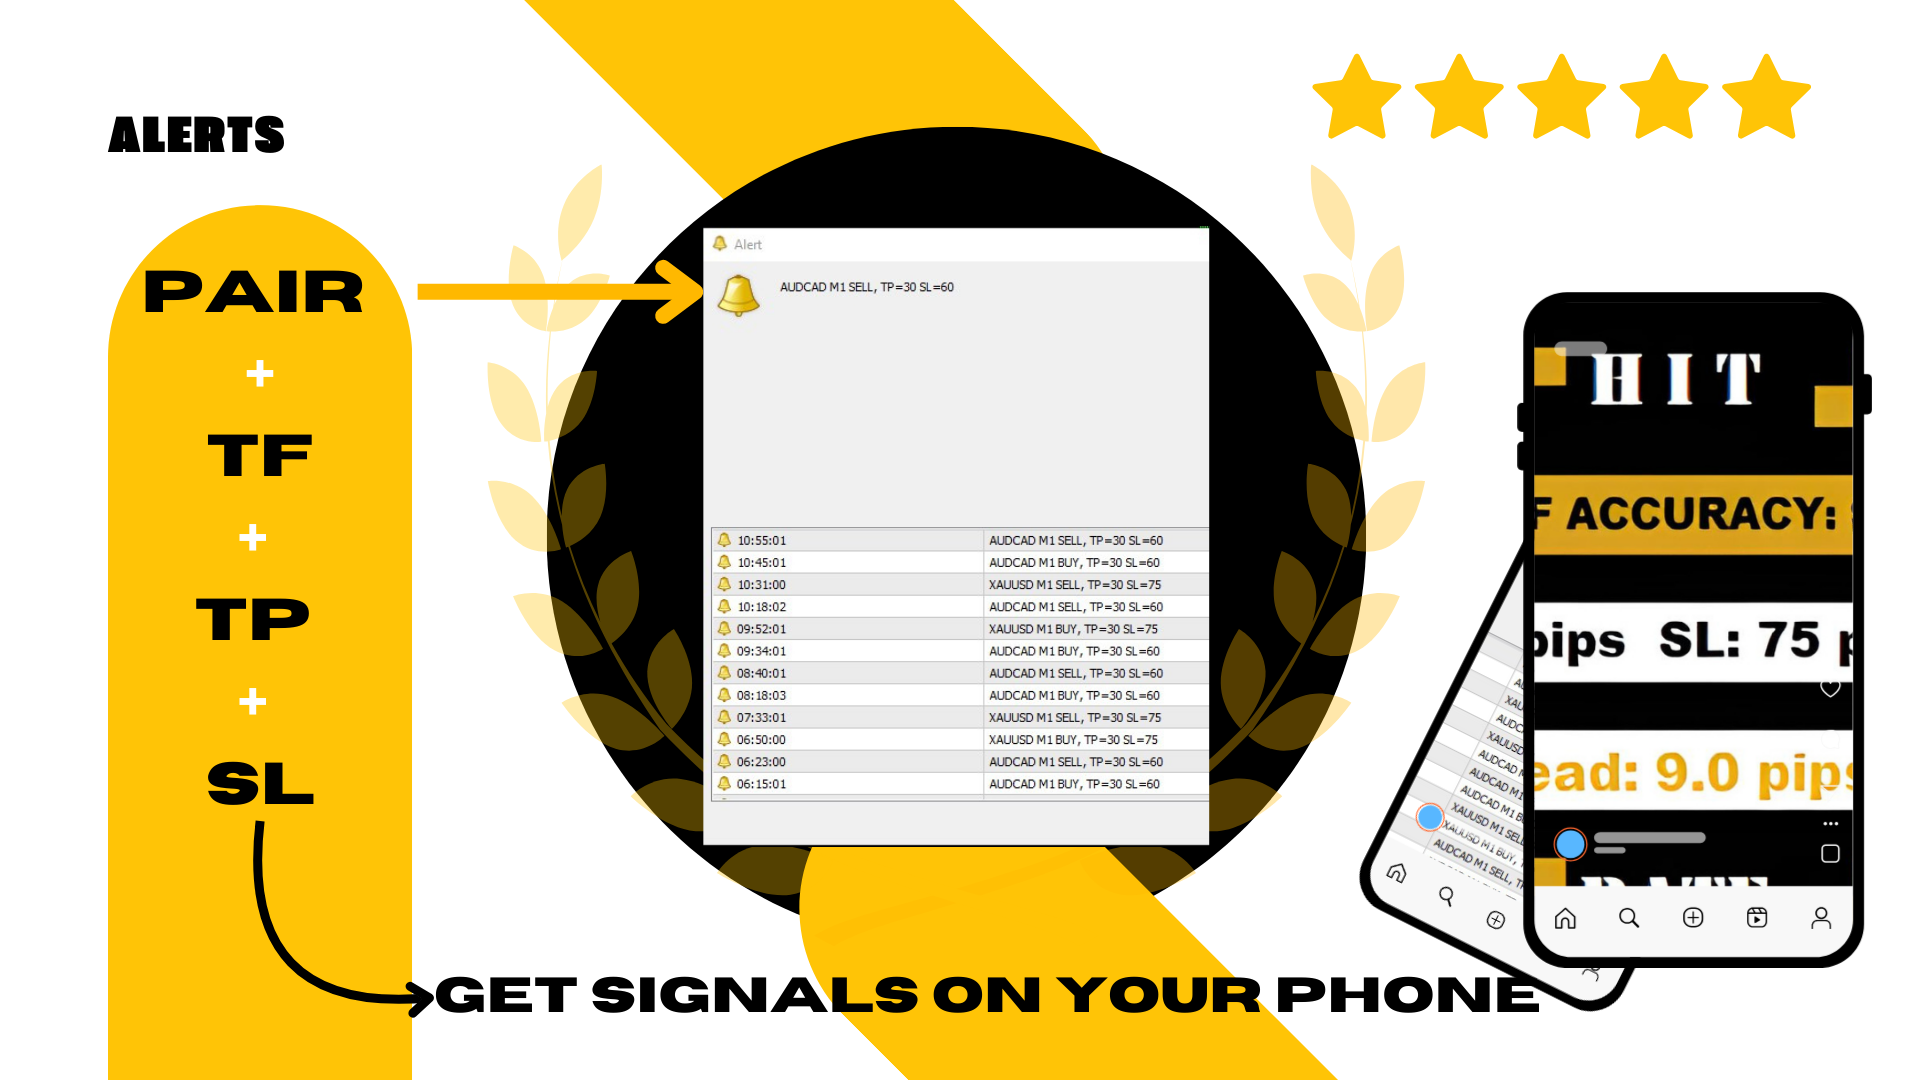
此“步骤说明”流程应在电脑上进行配置,然后您可以在手机上接收交易通知。 如何做到?确保您的手机已设置在MT4终端上接收推送消息,并允许您的终端从手机接收通知。

当信号发出时,您会收到通知:货币对 - 时间框架 - 信号类型(买/卖)-以及该货币对预先设置的TP和SL值。


这样,您无需一直在电脑前,因为您可以 从手机上进行交易,设置货币对的SL和TP,无需持续监控。

当然,对于那些希望在电脑上交易的用户,屏幕上会出现声音和视觉信号,每当货币对发出信号时,您将看到相同的数据(货币对 - 时间框架 - 信号类型以及TP和SL值)。


理解SL/TP与命中率的比率

交易策略的成功取决于两个关键因素一是止损(SL)和止盈(TP)之间的比率,二是信号的命中率。每个因素都在策略的盈利性中起着至关重要的作用,理解它们的相互作用是优化系统的关键。

1. SL/TP 比率:

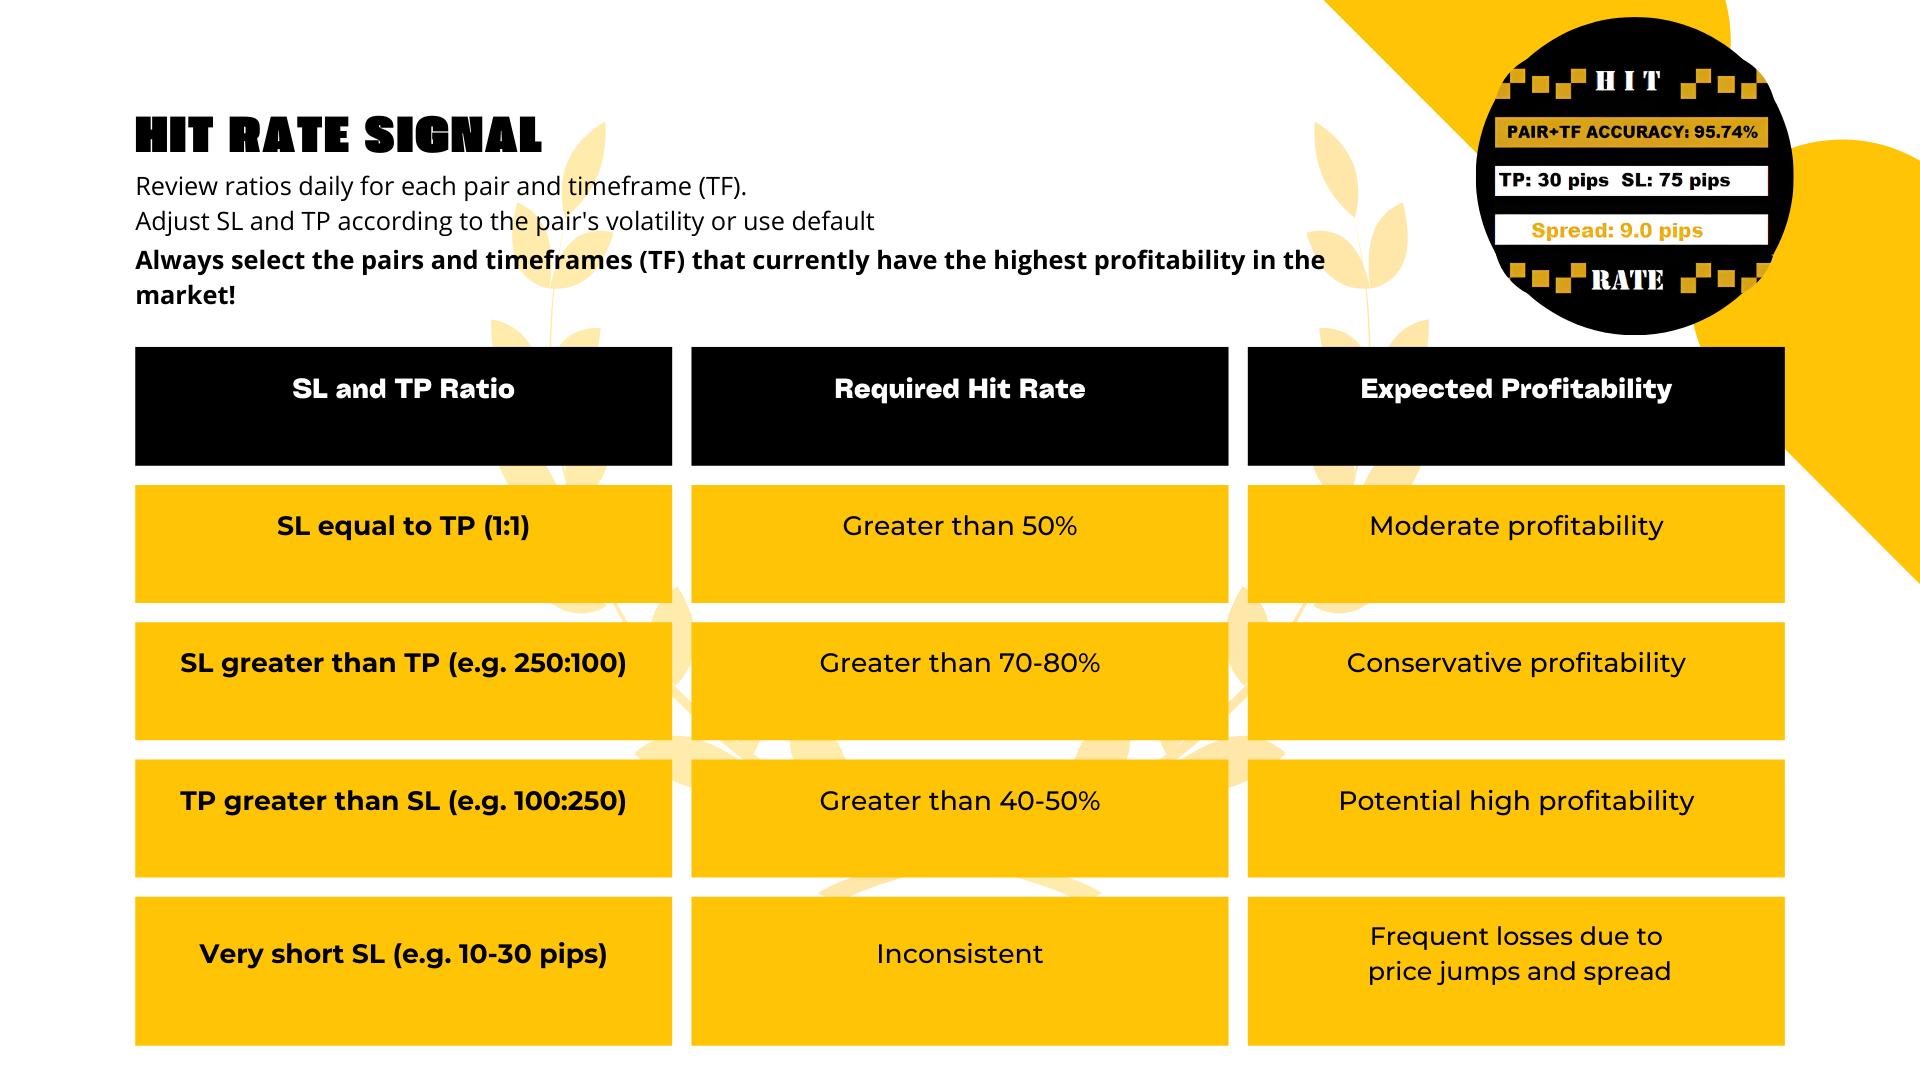
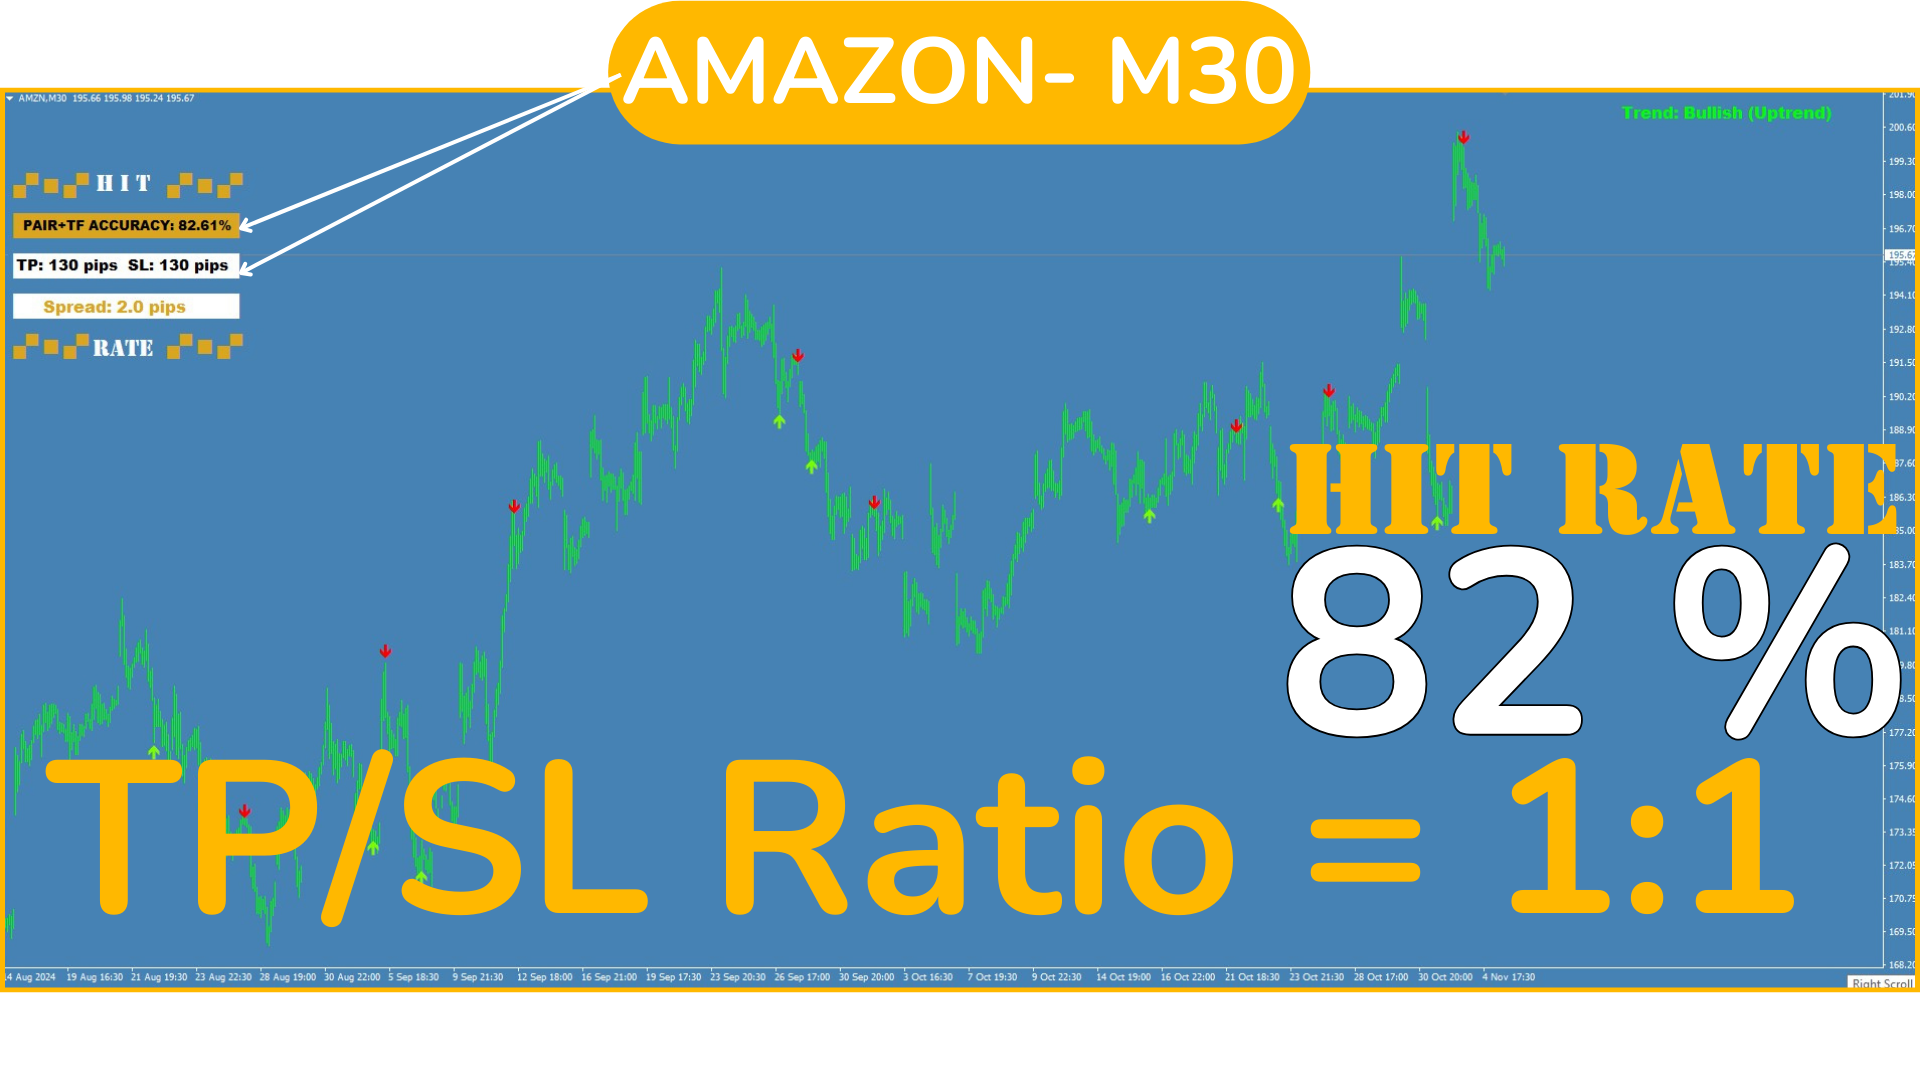
  • SL/TP 比率为 1:1: TP值与SL值相等(例如,SL:100点,TP:100点)。在这种情况下,策略需要超过50%的命中率才能盈利,因为收益和损失基本相同。
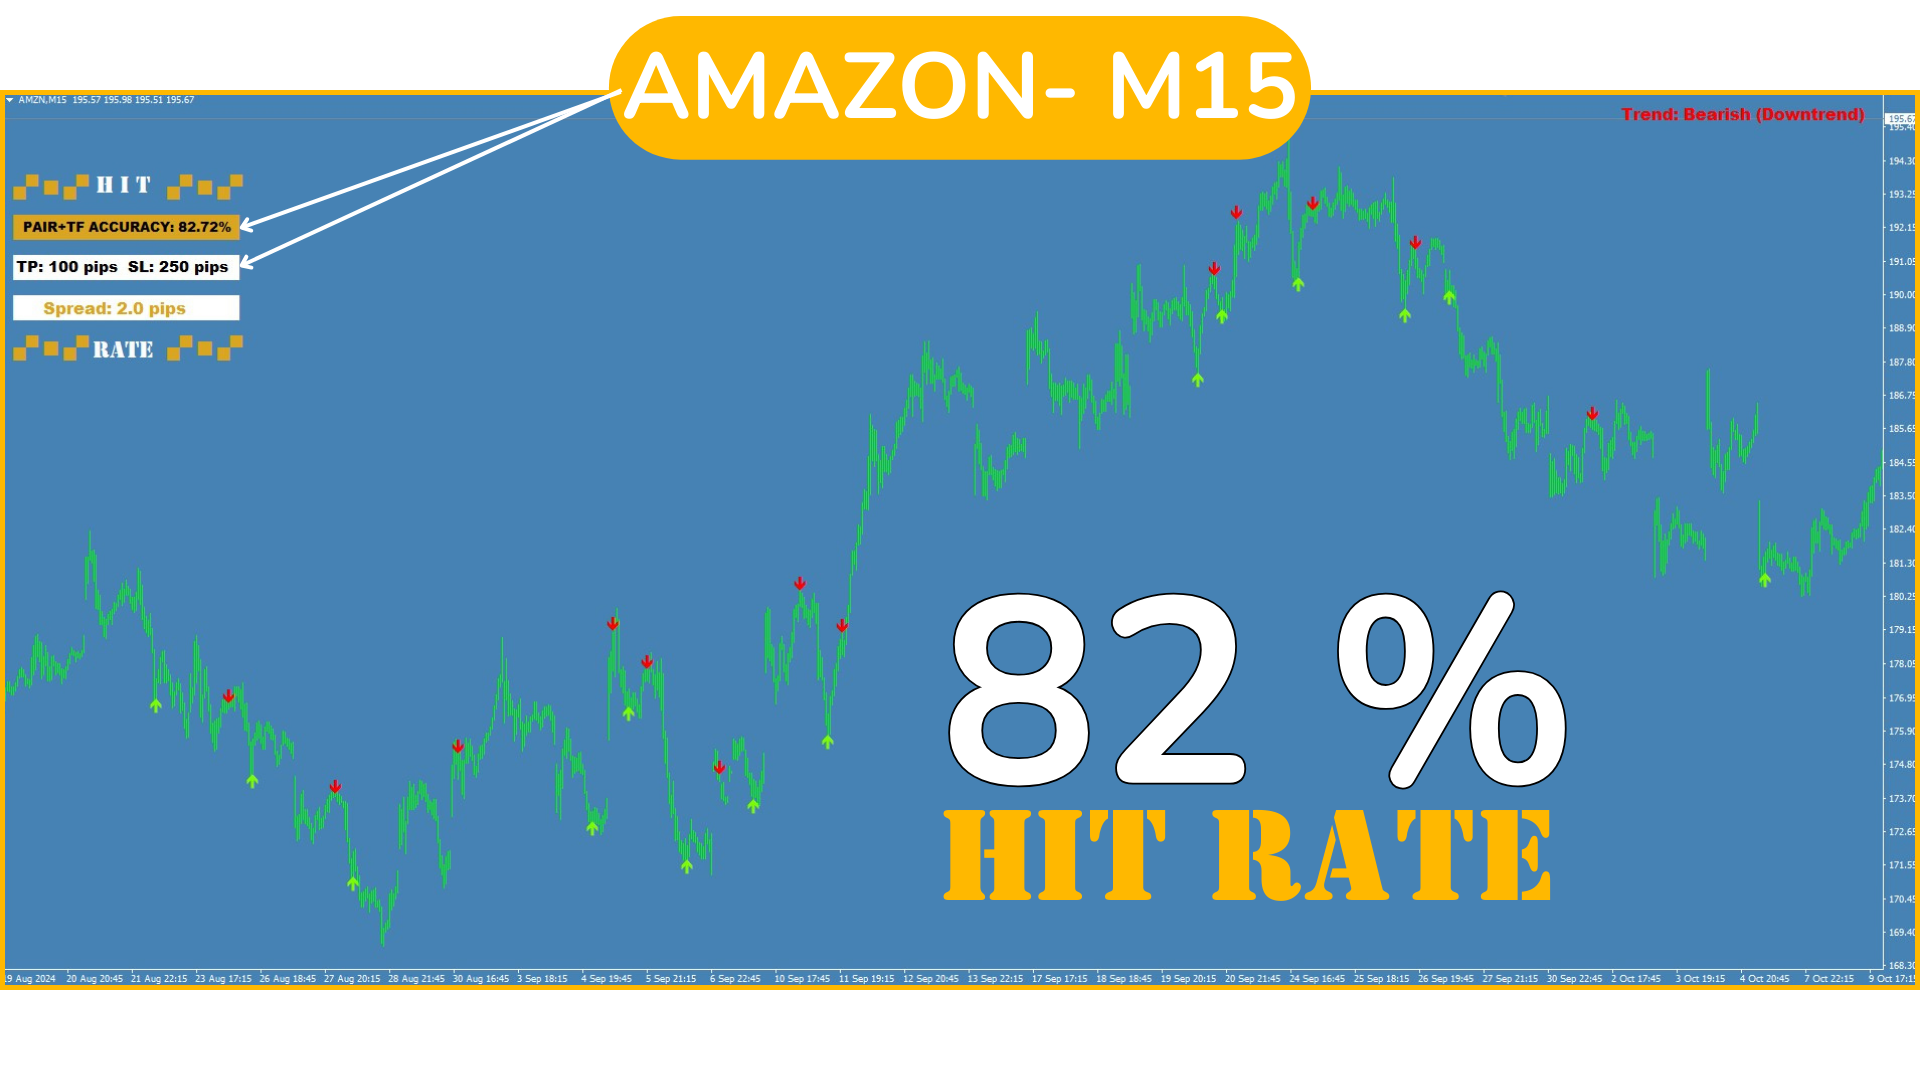
  • SL大于TP:例如,SL:250点,TP:100点),需要更高的命中率来弥补触及SL时的损失。在这种情况下,理想的命中率应在70%-80%以上。
  • TP大于SL: (例如,TP:250点,SL:100点),即使命中率较低,该策略也可获利,因为每次盈利的交易可以弥补多次亏损。在此情况下,40%-50%的命中率即可产生盈利。

在所有情况下!!始终注意,如果SL设得太“紧”,例如10-30点,可能会频繁触发(请注意点差),导致本应盈利的交易变成亏损。因此,请小心,为价格提供足够的活动空间(宽松的SL)。

2. 命中率:

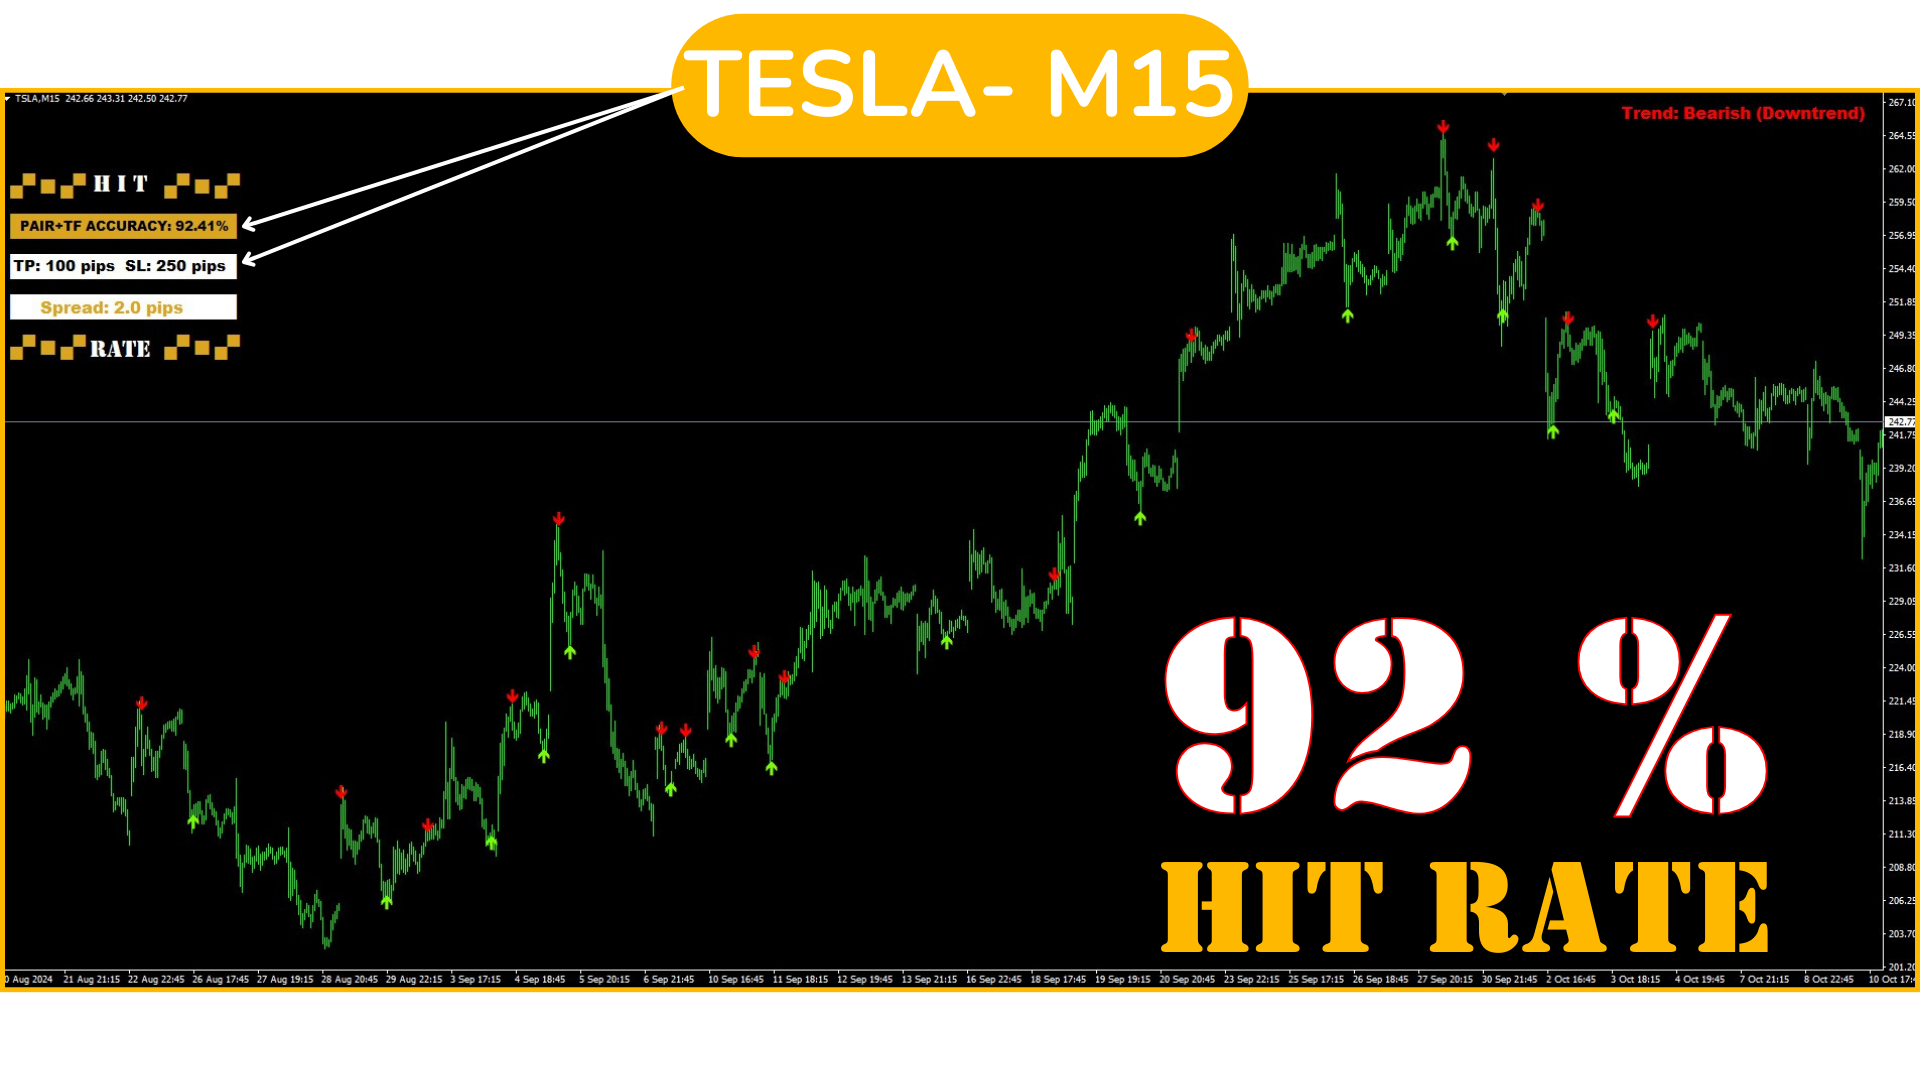
  • 命中率表示系统的准确率。高命中率的系统(例如90%)更可靠,并允许使用更宽的SL/TP比率(SL大于TP)。
  • 但是,低命中率不一定意味着亏损,只要TP大于SL。即使命中率较低,利润也足以覆盖亏损。

    因此,提前了解信号的命中率非常重要,以便在良好的资金管理(SL+TP)下实现最佳结果。


3. 根据货币对和时间框架进行优化:

每个货币对和时间框架对相同的SL/TP比率可能有不同的反应,因此重要的是根据货币对和时间框架的表现来调整SL和TP。例如,在波动较大的货币对或更高的时间框架上,使用更大的TP可能更合适。

尝试在每个货币对和时间框架上使用不同的SL和TP设置,观察每个的命中率。这将帮助您找到最佳平衡,以最大化收益并最小化亏损。


盈利性评估示例:

假设一个策略的SL为250点,TP为100点。为了让此配置实现盈利, 命中率应达到 理想上高于70%-80%,以覆盖触及SL所造成的损失。

然而,如果反转比率至SL 100点和TP 250点,则40%-50%的命中率已足够,因为每笔盈利交易可弥补多次亏损。


总结:

  • SL 大于 TP: 需要较高的命中率(理想上在70%以上)。
  • TP 大于 SL: 可以在较低的命中率下工作,约40%-50%。
  • 每日优化: 每日检查每个货币对和时间框架中的比率是否保持,以达到最佳表现。如果发现某个货币对的表现下降,请重复“步骤说明”并重新扫描最佳配置。

重要的是要理解,因为该策略可以在所有外汇对、黄金、白银、股票、指数甚至加密货币(如果您的经纪商允许)以及任何时间框架中使用,所以没有必要坚持使用:1-点差过高的货币对 2-不符合所需比率的货币对,请从最佳货币对中选择!


最后,请记住,没有一种通用的理想配置。通过更改设置,您会发现不同的配置可能根据货币对和时间框架提供良好的结果。这就是为何拥有一个清晰的信号来通知我们何时交易及其对应的SL和TP(已提前测试),并提供
 命中率分析,使命中率顶部底部信号成为一项完整的策略。即使只需阅读通知中的数据并据此进行交易,您也能确信所做的决策是经过分析和测试的。

轻松交易,简单明了,无需猜测和疑惑!


推荐产品
Arbitrage Indicators 是一个专业且易于使用的外汇交易指标,它使用最新AI的套利模型的最佳交易原则。 该指标提供准确的买入和卖出信号。只适用于货币对。 它共有六个不同的指标选项, MACD、KDJ、RSI、CCI、RVI、DEMARK。 可供用户自由切换。 它直观展示了货币对的走向及反转信号,当两线交叉颜色时货币即有很大概率发生反转。 推荐时间框架: 任何时间框架都有效,但我们喜欢使用   M5、 M15、M30 和 H1   也是不错的选择! 推荐交易品种: 我们喜欢使用的最佳交易品种是   M15 时间框架上的 EURUSD 、GBPUSD 、USDJPY、 USDCAD、 AUDUSD 、USDCHF 有问题可联系:QQ:2813871972 微信: FX-AIEA 邮箱:2813871972@qq.com
AWTime Indicator
Komang Putra Riswanjaya
Overview The Time Trading Indicator AWT is designed for traders who often miss or overlook their trading opportunities. This tool helps users stay on top of their trading windows by providing timely alerts. Key Features User-friendly interface: Simple and intuitive design for easy navigation. Easy to use:   Set it up quickly and start receiving notifications instantly. Alert and Push Notifications:   Stay informed with real-time alerts and push notifications. Customizable Objects:   Adjust the
FREE
Smart Set up leve l is a very powerful indicator based on the concept of order blocks and set up entries with proper fvg and breakouts to make a very nice level to enter like a pro trader. Very easy to use interface and friendly to enter on buy and sell signals. Works Best on M15 Time frame on Gold, Bitcoin and Fx pairs. Daily 4-5 trades on each pair  Works great on gold like a pro on M15 It is non repainting nor lagging It is very powerful indicator giving precise entries and prop acts can be c
Alpha Trend sign Alpha Trend sign 是我么长期以来非常受欢迎的交易工具,它可以验证我们的交易系统,并且明确的提示交易信号,并且信号不会漂移。 主要功能: •  根据市场显示活跃区域,根据指标可以很直观的判断当前行情是属于趋势行情,还是震荡行情。    并根据指标的指示箭头切入市场,绿色箭头提示买入,红色箭头提示卖出。 •  建议使用5分钟以上的时间周期进行交易,避免因为小周期波动出现频繁的交易信号。 •  您也可以开启信号提示,以免错过最佳的交易时机。 •  本指标不但可以很好的预测趋势行情,也可以在宽幅震荡行情中获利。 •  本指标本着大道至简的原则,适合不同阶段的交易者使用。 注意事项: •  Alpha Trend sign 有明确的进出场信号,不建议逆势操作,以免造成损失。 •  Alpha Trend sign 是特别成熟的指标,我们团队人手一个,使用它可以实现稳定盈利。     
VR Cub
Vladimir Pastushak
VR Cub 这是获得高质量切入点的指标。该指标的开发是为了促进数学计算并简化对仓位入场点的搜索。多年来,该指标所针对的交易策略已被证明其有效性。交易策略的简单性是其巨大的优势,即使是新手交易者也能成功进行交易。 VR Cub 计算开仓点以及获利和止损目标水平,这显着提高了效率和易用性。查看使用以下策略进行交易的屏幕截图,了解简单的交易规则。 设置、设置文件、演示版本、说明、问题解决,可以从以下位置获取 [博客] 您可以在以下位置阅读或撰写评论 [关联] 版本为 [MetaTrader 5] 计算入场点的规则 开仓 要计算入场点,您需要将 VR Cub 工具从最后一个高点拉伸到最后一个低点。 如果第一个点在时间上早于第二个点,交易者等待柱线收于中线上方。 如果第一个点在时间上晚于第二个点,交易者等待柱线收于中线下方。 根据上述条件,严格在 柱线收盘 后建仓。 换句话说,如果我们在小时图上进行交易,那么从最高点到最低点的时间距离必须超过24小时,最高点和最低点之间的点数必须大于或等于平均价格变动每天。 维持和改变市场地位 可以有多个未平仓头寸;每个头寸都可以单独修改。 VR Cub
REX complete 3in1
Christophe Godart
This is the complete REX package. It consists of the lite, pro and ULTRA version.  Perfect for beginners and intermediates. REX complete is 100% non repaint. The strategy is based on a mix of different strategies, statistics, including pivot points, oscillators and patterns.  As the trading idea consists of a variety of some classic indicators like Momentum, Williams Percent Range, CCI, Force Index, WPR, DeMarker, CCI, RSI and Stochastic, it is clear that the fundamental indicators have being u
Chart Patterns Detect 15 patterns (Ascending Triangle, Descending Triangle, Rising Wedge, Falling Wedge, Bullish Flag, Bearish Flag, Bullish Rectangle, Bearish Rectangle Symmetrical triangle, Head and Shoulders, Inverted Head and Shoulders, Triple top, Triple Bottom, Double Top, Double Bottom) Use historical data to calculate the probability of each pattern to succeed (possibility to filter notification according to the chance of success) gives graphic indication about the invalidation level and
Szia! Egy indikátorral. Több idő gyertyájának kirajzoltatása egy charton. Különböző színek rendelhetők a long és short gyertyákhoz. Vonal vastagsága állítható. A gyertya kitöltése engedélyezhető. Hello! With an indicator. Drawing multiple time candles on a chart. Different colors can be ordered for long and short candles. Line thickness can be adjusted. Filling the candle can be allowed. Videó: https://www.youtube.com/watch?v=-9bequnAw-g&amp ;ab_channel=GyulaKlein
SRP Pro
Farhad Kia
5 (1)
Strong Retracement Points Pro edition! SRP (Strong Retracement/Reversal Points) is a powerful and unique support and resistance indicator. It displays the closest important levels which we expect the price retracement/reversal! If all level are broken from one side, it recalculates and draws new support and resistance levels, so the levels might be valid for several days depending on the market! If you are still hesitating to start using this wonderful tool, you can check this link to see how ef
Preface: First of all, let me introduce myself. I am a programmer and have been working for over 20 years. 2023 has passed, and our studio has achieved a record of 500 times with 7 manual transmissions. Below, we will show you how to do it through a series of operations. The first step is to model. Modeling is to find a fixed trading pattern. I think everyone has heard of a 2/8 probability, and through this probability, we can further refine it, which means that 1 to 4 is the optimal state. We h
FreqoMeterForecast
Stanislav Korotky
The main idea of this indicator is rates analysis and prediction by Fourier transform. Indicator decomposes exchange rates into main harmonics and calculates their product in future. You may use the indicator as a standalone product, but for better prediction accuracy there is another related indicator - FreqoMaster - which uses FreqoMeterForecast as a backend engine and combines several instances of FreqoMeterForecast for different frequency bands. Parameters: iPeriod - number of bars in the ma
Visual Vortex Indicator MT4
AL MOOSAWI ABDULLAH JAFFER BAQER
Unleash the Power of Market Dynamics with the Vortex Indicator! The Visual Vortex Indicator is your advanced tool for decoding market trends, reversals, and momentum shifts. Priced at $65, this indicator provides a comprehensive view of market behavior, but it’s designed for you to fine-tune and optimize it according to your unique trading strategy. What Makes It Unique? The Vortex Indicator is based on a strategy that identifies directional movements and trend strength by analyzing key price d
This indicator is another variant of the famous powerful indicator Fibonacci-SS https://www.mql5.com/en/market/product/10136 but has different behaviour in placing Pending Order and TP Line. Automatically places Fibonacci retracement lines from the last highest and lowest visible bars on the chart with: An auto Pending Order (Buy/Sell). Taking Profit 1, Taking Profit 2 is pivot point and Taking Profit 3 for extended reward opportunity. The best risk and reward ratio. Simple and powerful indicat
This advisor enters the market at the opening of   London Market . It has a automatic function that give buy (arrow up green) and sell (arrow down red) signal when the indicator met high probabilities requirements.Once the signal is generated it is the trader discretions to start the order button and do trade manually. Stop loss are base on ATR. Recommended Take profit is 20pips.  The trading system is suitable for both experienced traders and beginners.  Timeframe is  M5 . Minimum account bal
Stratos Pali
Michela Russo
5 (3)
Stratos Pali Indicator   is a revolutionary tool designed to enhance your trading strategy by accurately identifying market trends. This sophisticated indicator uses a unique algorithm to generate a complete histogram, which records when the trend is Long or Short. When a trend reversal occurs, an arrow appears, indicating the new direction of the trend. Important Information Revealed Leave a review and contact me via mql5 message to receive My Top 5 set files for Stratos Pali at no cost! Dow
RTSPattern
Tomas Belak
The indicator provides a superior alternative to price action analysis. It enables the identification of normalized patterns, which are then transformed into a graphical representation to forecast future steps within a time series. In the top-left corner, you'll find information regarding the expected prediction accuracy, determined through a complex MSQE calculation. You have the flexibility to adjust the time window, making it easy to validate the indicator's performance. Additionally, you can
True SnD
Indra Lukmana
5 (1)
This Supply & Demand indicator uses a unique price action detection to calculate and measures the supply & demand area. The indicator will ensure the area are fresh and have a significant low risk zone. Our Supply Demand indicator delivers functionality previously unavailable on any trading platform. Trading idea You may set pending orders along the supply & demand area. You may enter a trade directly upon price hit the specific area (after a rejection confirmed). Input parameters Signal - Set
Simple to read and powerful, no fancy lines and drawings to clutter your chart or distract you. The trend probability oscillator estimates how likely a trend will continue in a certain period. The cummulator period controls how many bars in the past to use and is a proxy for the timescale the trend probability should hold. The use of a Max Line improves this further by indicating when a trend is likely to reverse. In most cases a trend must lose momentum before reversing. Hence, a trend probabil
Gartley Projection D
Oleksandr Medviediev
3.71 (7)
具有经过验证的概念和盈利能力的最佳、最有效、可靠的产品。感谢您的考虑。  该指标根据H.M.Gartley的发展(《股票市场利润》,1935年)识别和确认谐波模式(XABCD)。 它将D点投影为透视投影中的一个点(在设置中指定ProjectionD_Mode = true)。 不会重绘。当工作时间段的柱形图关闭时,如果已识别的模式点在Patterns_Fractal_Bars柱中未移动,则在图表上出现一个箭头(指向预期价格运动的方向)。从此刻起,箭头将永久保留在图表上。 注意:连续出现2-3个或更多箭头 - 这是市场条件的变化,而不是重绘。 总共有85种模式(包括Gartley-222和Gartley-222WS,完整列表可在评论部分的Google Drive链接中找到)。在所有已识别的模式中,只有最新识别的模式填充了单一颜色。 参数 DrawPatterns(true/false)- 以实心颜色绘制模式 ProjectionD_Mode(true/false)- 定义D点作为透视投影模式 Patterns_Fractal_Bars - 在认定为形成分形的情况下,最新
供求区关键价指标 背景 系统自动搜索 K 线中的供求区域,并画出实时的关键价格线,交易者可以根据价格交易线进行交易。 主要特点 系统是自动搜索 K 线中的供求区域的,系统同时会画出实时的关键价格线,交易者可以根据价格交易线进行交易。所以使用供求区策略的交易员无需再耗费时间去寻找标识供求区域,而可以关注在价格对供求区域以及关键价格的反应,制定适合自己的交易策略。 然而供求区策略本身就是一个在震荡时期更加有效的策略,所以当市场呈现强大趋势的时候,应当小心使用,或者按顺应趋势的方向使用指标提供的建议。   范围 ShowZones :是否显示供求区域 DrawLines: 是否显示关键价格 SupplyZoneLineColor: 供给区价格线颜色 DemandZoneLineColor: 需求区价格线颜色 PenatratedLineColor: 被击穿价格线颜色   执行 只需将指标附加到图表上即可。 请给我您宝贵的意见,让我改进指标。 如有问题,联系微信 imlizard
Watch the Clock
David Leander Tschacher
Watch the Clock shows a clock at a desired position. The clock is useful if you want to check when a candle closes. You can also set an alert to be prepared before the news. ️ Watch the Clock works also in the strategy tester. ️ Watch the Clock requires a minimum of CPU power. ️ Watch the Clock can improve your manual style of trading. Inputs Alert -> At which time should the alert occur? Time Shift in Minutes -> Should the time be incremented by x minutes? Size -> The font size of the tim
MACD Divergence
Sergey Deev
2.5 (2)
The indicator detects divergence signals - the divergences between the price peaks and the MACD oscillator values. The signals are displayed as arrows in the additional window and are maintained by the messages in a pop-up window, e-mails and push-notifications. The conditions which formed the signal are displayed by lines on the chart and in the indicator window. Indicator Parameters MacdFast - fast MACD line period MacdSlow - slow MACD line period MacdSignal - MACD signal line period MacdPric
Dynamic Forex28 Navigator
Bernhard Schweigert
5 (5)
Dynamic Forex28 Navigator - 下一代外汇交易工具。 当前 49% 折扣。 Dynamic Forex28 Navigator 是我们长期流行的指标的演变,将三种功能合二为一: 高级货币强度 28 指标 (695 条评论)+ 高级货币 IMPULSE 带警报 (520 条评论)+ CS28 组合信号(奖励)。 有关指标的详细信息 https://www.mql5.com/en/blogs/post/758844 下一代强度指标提供什么? 您喜欢的原始指标的一切,现在通过新功能和更高的精度进行了增强。 主要特点: 专有货币强度公式。  所有时间范围内的平滑和准确的强度线。 非常适合识别趋势和精确进入。 动态市场斐波那契水平(市场斐波那契)。  此指标独有的独特功能。 斐波那契应用于货币强度,而不是价格图表。 适应实时市场活动以获得准确的反转区域。 实时市场动量。  第 9 行显示市场是活跃还是被动。 对于定时交易至关重要。 全面的警报和显示。  每种货币最强的买入和卖出动量。 ​​28 对的双重动量买入和卖出。 超买/超卖警告外部范围和止损。 反转
Crypto_Forex 指标“晨星模式”适用于 MT4。 - 指标“晨星模式”是价格行为交易的非常强大的指标:无需重绘,无延迟。 - 指标检测图表上的看涨晨星模式:图表上的蓝色箭头信号(见图片)。 - 带有 PC、手机和电子邮件警报。 - 还有它的兄弟 - 看跌“黄昏之星模式”指标可用(点击以下链接)。 - 指标“晨星模式”非常适合与支撑/阻力位结合使用。 ................................................................................................................. // 出色的交易机器人和指标可在此处获得: https://www.mql5.com/en/users/def1380/seller 这是仅在此 MQL5 网站上提供的原创产品。
ZhiBiMACD MT4
Qiuyang Zheng
4.5 (2)
这是一款独特的MACD指标,它比传统MACD要准确,而且好用。它适合任何图表周期,并且适合任何市场品种。 红色的柱子是(Buy)的波段信号、蓝色的柱子是(Sell)的波段信号。 黄色线和绿色线是趋势线,这两条线永远不会交叉。 Buy:蓝色柱子中,再看绿色线向上穿越中间0轴。 Sell:红色柱子中,再看黄色线向下穿越中间0轴。 这款MACD的背离形态信号的准确率在99%: 背离形态Buy:价格一个波段比一个波段低,而指标的柱子却越缩越高,这种情况下可以立即做Buy单。 背离形态Sell:价格一个波段比一个波段高,而指标的柱子却越缩越低,这种情况下可以立即做Sell单。 注意:指标里面的五角星会随着价格波动而变化。
The indicator identifies two most important patterns of technical analysis - Pin Bar and Engulfing. MT5-version  https://www.mql5.com/en/market/product/53701 Settings: Mincandle size for PinBar - The minimum size of the Pin-Bar candlestick; Percentage of candle body on size - The percentage of the candle body in relation to its length; PinBar Alert - Alert when a Pin-Bar is detected; PinBar Mail - Sends an email when a Pin Bar is found; PinBar Notification - Sends a push notification when a Pin
PABT Pattern Indicator - it's classical system one of the signal patterns. Indicator logic - the Hi & Lo of the bar is fully within the range of the preceding bar, look to trade them as pullback in trend. In the way if indicator found PABT pattern it's drawing two lines and arrow what showing trend way.  - First line - it's entry point and drawing at: 1. On the high of signal bar or on middle of the signal bar (depending from indicator mode) for buy; 2. On the low of signal bar or on middle of t
ProTrading Arrow
Nedyalka Zhelyazkova
5 (1)
" A NEW TRADING METHOD… AN AMAZING TRADING INDICATOR! " Additional Bonus : You get the Forex Trend Commander indicator for FREE! It should not be forgotten that trading is not an event, but a process. This process has no end, i.e. it should never stop completely and completely. To lock in a profit from market movements you need to implement the strategy in practice, in most cases it takes much longer than planning it. ProTrading Arrow indicator is an advanced reversal system that can be played
RiKen
Gabriel Gomes
RiKen:以证明的精确度和可靠性革新技术分析 发现RiKen,这是一款创新的技术分析工具,旨在转变您的交易体验。这个指标通过其独特的功能重新定义了金融市场: 令人印象深刻的70%准确率 :RiKen以70%的显著准确率提供买卖信号,为寻求优化投资决策的交易者提供了宝贵的资产,为更有利可图的交易操作提供了坚实的基础。 创新的视觉箭头信号 :通过图表上的直观箭头,RiKen清晰地指示了理想的进入和退出点。这一功能最小化了对密集手动分析的需求,以清晰、精确的方式突出交易机会。 无重绘,消除错误信号 :从根本上,RiKen被设计为不重绘,确保所提供的信号是最终且可靠的。这一特性消除了对错误信号的担忧,增强了基于RiKen信号的交易决策的信心。 通用适用性 :RiKen可适应任何货币对和时间框架,提供了无与伦比的灵活性,确保各种风格和策略的交易者都能从其有价值的见解中受益。 先进的市场分析 :RiKen基于复杂算法,直观地阐明市场动态,过滤掉噪音并聚焦于关键信息。这使得预测趋势、促进快速、明智的决策变得可能。 具有赢率显示的回测功能 :RiKen允许进行回测模拟,显示赢率,从而证明了其有效性,
Indicement MT4
Profalgo Limited
5 (2)
歡迎來到指數! 道具準備就緒! -> 在這裡 下載設定文件 推出促銷活動: 目前價格只剩幾本! 最終價格:990$ NEW: Choose 1 EA for FREE! (limited to 2 trading account numbers) 終極組合優惠   ->   點擊此處 加入公共團體: 點擊此處   LIVE SIGNAL INDICEMENT 將我 15 年在創建專業交易演算法方面的經驗帶入指數市場。 EA 使用經過深思熟慮的演算法來找到最佳入場價格,並在內部運行多種策略來分散交易風險。 所有交易都有停損和止盈,但也使用追蹤停損和追蹤停盈來最小化風險並最大化每筆交易的潛力。 該系統建立在非常流行且經過驗證的策略之上:交易突破重要的支撐位和阻力位。   我很高興地說,在多年的 EA 開發過程中,我已經完善了這個策略 該 EA 專為 US500、US30 和 NAS100 指數交易而開發。 這些市場特別適合這種類型的策略交易。 回測顯示出非常穩定的成長曲線,回撤非常可控且恢復很快。  該 EA 已針對所有 3 個指數進行了壓力測試,使用不同經紀商的多個價格回饋。此外
该产品的买家也购买
Trade Invest Pro
Dmitriy Kashevich
Trade Invest Pro - Boss in the world of cryptocurrency! This indicator is ideal for cryptocurrency trading! Work on Trade Invest Pro took us half a year! But not in vain! Now only accurate signals near support - resistance levels! He showed himself well on timeframes m5 m15 for binary options! Optionally, it can be configured for forex for timeframes m30 and more! Reacts well to news! Doesn't paint! and does not disappear from the schedule! As soon as a red arrow appears, open a deal fo
这是最赚钱的指标。它的表现非常出色。无论市场上有什么兴趣,你都能看到。 几乎在所有情况下,它都只会给你一个长期的市场观点,但不要被愚弄,以为它是受事件约束的。不是这样的。它能找到市场上最大的利益所在,并将其展示给你。别忘了,最大的资金(利益)每天都不会在市场上出现。这是您没有遇到过的情况。月租金可能会给您一到两个信号,仅此而已。但当我们谈论大资金时,他们就是这样行事的。 如果您想了解更多,请点击这里。 这是最赚钱的指标。它的表现非常出色。无论市场上有什么兴趣,你都能看到。 几乎在所有情况下,它都只会给你一个长期的市场观点,但不要被愚弄,以为它是受事件约束的。不是这样的。它能找到市场上最大的利益所在,并将其展示给你。别忘了,最大的资金(利益)每天都不会在市场上出现。这是您没有遇到过的情况。月租金可能会给您一到两个信号,仅此而已。但当我们谈论大资金时,他们就是这样行事的。 如果您想了解更多,请点击这里。
Dark Sniper
Dmitriy Kashevich
Dark Sniper pointer indicator.  Complete absence of redrawing   The percentage of correct indicator forecasts depends on your settings; the default is period 7 (performed better) The arrow indicates the direction of the next candle and the possible direction of the trend in the future.  Suitable for small timeframes m1 and m5  It is recommended to open transactions from 1 to 2 candles.  The signal appears on the current candle. Open a trade on the next one since the signal is being generat
Magic M2
Tuan Anh Dao
4.5 (8)
------ GOOD LUCK   -----   (Telegram: @MagicBinary) The indicator allows you to trade binary options. T his indicator give high winning ratio with over 20 years of backtesting  The recommended time frame is М1 and the expiration time is 3, 5 minutes. The indicator suitable for Auto and Manual trading. A possible signal is specified as a arrows above/under a candle. You can entry current candle /intrabar or can wait until candle close Arrows are not re-painted Trade sessions: Any/ Rec
Risk Reward ratio indicator for MT4  BING Risk Reward indicator is a powerful, basic, very needed tool for every trader. Clearly visualize Open Price , Stop Loss , and Top Profit levels on your graphs with easy-to-see colors and trendlines. Does BING Risk Reward show alerts? Of course! BING Risk Reward Indicator offers all Alerts available for the MT4 platform(Email, Popups, Sound, and Push). It shows alerts on Open Price , Stop Loss , and Top Profit. That way, besides easily seeing what is go
Lineverse Trendlines
Arkady Segal
5 (1)
Automatic, live & interactive picture of all trendlines. Assign push, email and sound alerts to the lines of your choice and be informed about price rollback, breakout, rollback after breakout, number of rollbacks, line expiration by double breakout. Correct, drag or delete the lines and interactively tune the line system. https://youtu.be/EJUo9pYiHFA . Chart examples https: //www.mql5.com/en/users/efficientforex Price Interaction Events All events are effective immediately and only after one
The indicator displays the probable ( Support and resistance ) levels. The indicator draws horizontal and trend levels of support and resistance. The indicator settings: Trends - the mode for displaying trend lines or horizontal lines of support and resistance Yes - display trend lines only No - display horizontal lines only UseResource - use the resources built into the indicator. Yes - use the ZigZag indicator from the resources of the product. No - use a custom ZigZag indicator. HistoryBar -
The indicator of a Professional Trader is an arrow indicator for predicting the direction of price movement. I have been working on this indicator since 2014. You can use this indicator as your main indicator, use its entry signals, and use it as your only indicator to find entry points. About the product: Recommended TF [H4-D1-W1]   . The indicator predicts the direction of the next candle. Fits a variety of tools; Flexibility in settings for different instruments and intervals through the MO
THE GRAFF III
Antonin Skaryd
The [GRAFF] III manual trading system is based on multiple MetaTrader (MT4) indicators. Together, the entire PACK of GRAFF III indicators makes an advanced trading tool. The system consists of over 20 different custom-built indicators which have been carefully selected and tested in the long term to produce strong and efficient trading signals. The particular indicators are based on different mathematical formulas, so the entire system is calibrated to remove false signals from its own indicator
You can fins our other products from link : https://www.mql5.com/en/users/drbastem/seller   Also, you can ask all your questins from email : haskayafx@gmail.com or mobile : +90 530 867 5076 or @MehmetBastem    on telegram application This indicator is used to determine the trend. Standard Osma indicator is used. It has the indicator warning system: beep, e-mail and has three types of alerts, including messages to mobile phone. It shows the best performance on the chart of 5 minutes. When the
You can fins our other products from link : https://www.mql5.com/en/users/drbastem/seller   Also, you can ask all your questins from email : haskayafx@gmail.com or mobile : +90 530 867 5076 or @MehmetBastem    on telegram application This indicator is used to determine the trend. Standard Three Moving Average and ADX indicators are used. It has the indicator warning system (audio, e-mail) and three types of alerts, including messages to mobile phone. It shows the best performance on M5. When
This indicator is used to determine the trend. Standard Three Moving Average and ADX indicators are used. It has the indicator warning system (audio, e-mail) and three types of alerts, including messages to mobile phone. It shows the best performance on M5. When the trend value reaches the value set, the warning system is activated. This indicator works only with Forex symbols. Inputs SoundAlarm = true - Sound Alert Sendmail=true - Send an e-mail in case of a buy or sell signal Sendnotification
You can fins our other products from link : https://www.mql5.com/en/users/drbastem/seller   Also, you can ask all your questins from email : haskayafx@gmail.com or mobile : +90 530 867 5076 or @MehmetBastem    on telegram application This indicator is used to determine the trend. Standard MACD indicator is used. It has the indicator warning system: beep, e-mail and has three types of alerts, including messages to mobile phone. It shows the best performance on the chart of 5 minutes. When the
Smooth price for Monarch MT4
Konstantin Gruzdev
3.67 (3)
The Smooth Price technical indicator is used for plotting a smoothed line as close to the price of the financial instrument as possible, and serves to eliminate its noise components. The indicator is part of the Monarch trading system, but here it is presented as an independent technical analysis tool. The indicator is based on the cluster digital filter , which, unlike the ClusterSMA , is applied directly to the price time series. Smooth Price does not redraw (except the very last, zero bar) an
A simplistic indicator informing a user on RSI divergence by sending messages to mobile device and email. The indicator draws 2 vertical lines, marking two RSI extrema that formed the divergence. You get the alert, open the charts and make a decision. The indicator does not show past divergences, thus when you attach it to a chart for the first time you see nothing. Graphics and alerts will appear as soon as divergences do. Drop it in Tester to see how it works. Parameters: RSIPeriod - number of
Pan PrizMA CD Phase is an analogue of the МetaТrader 5 indicator , and is an option based on the Pan PrizMA indicator. Details . Averaging by a quadric-quartic polynomial increases the smoothness of lines, adds momentum and rhythm. Extrapolation by the sinusoid function near a constant allows adjusting the delay or lead of signals. The value of the phase - wave status parameter (which is close in meaning to the trigonometric phase or the angle of the radius-vector rotation in the trigonometric p
Green Wall Arrows
Daniel Luchinger
1 (1)
The Name Green Wall : Arrows hits a lot of TP, by changing the idea of non using SL as something bad, but instead use Small TP and a lot of free Margin and Patience. Use micro TP and a lot of Free Margin with this indicator on Forex. It also can be used with Binary Options. This strategy is intended to be traded Manually. This Indicator runs on Open Bar, arrows will delete when price are against it. The only Indicator Parameter is Alerts true/false, all the rest is included inside the code. Arro
Golden Monowave
Ahmed Mohamed Ali
Golden Monowave is monowave indicator, the monowave theory is one of Elliott wave approach and one of most complicate and accurate method. Golden Monowave can shortcut many major steps to identify and describe the monowave. It works on any timeframe and with any trading instrument, including currencies, indices, futures, etc. Input Parameters initial_Bars - set the initial number of bars to calculate. wave_color - select the color of the wave. label_color - select the color of labels. temp_labe
Ticks Size
Viktor Kolmakov
This indicator displays in a separate window the difference between the number of points which increased the price, and the number of points that decreased the price during the time interval specified in the settings. The time interval for calculation is expressed as the number of bars of the chart the indicator is attached to. This approach allows you to evaluate the movement direction (growth or fall) of the instrument's price, the strength of the movement and the size of the movement in point
NostradamusMT4
Andrey Spiridonov
1 (1)
NostradamusMT4 is a powerful indicator from the set of professional trader. The indicator is based on Andrei Spiridonov's original price calculation method (ESTIMATED PRICE) for the current candle price. Advantages The indicator does not redraw. It works on any timeframes. Works with any trading instruments. Perfectly suitable for scalping and trading binary options. Parameters Color - color of the ESTIMATED PRICE FUTURE line. How to work with the indicator The indicator forms the ESTIMATED P
BinaryIndicator
Andrey Spiridonov
BinaryIndicator is a highly accurate indicator for trading binary options. It shows excellent results in scalping. This indicator is based in multifactor analysis of trend indicators, as well as confirmation oscillators, which in the end gives an increased accuracy of signals. Advantages of the indicator Increased accuracy of signals. Excellent results when trading binary options with a short expiration time from M30 to M1 . It works on any timeframes. Works with any trade symbols. Parameters
FutureTrade
Andrey Spiridonov
3 (2)
FutureTrade is one of the few indicators that predicts the price right on the price chart. The indicator calculation algorithm is based on the fast Fourier transform. Given the oscillatory behavior of the price, the Fourier function predicts its future behavior. The indicator should be attached in the usual way to a chart with the trading instrument specified symbol and with the M15 timeframe. This timeframe is the most optimal for working with any symbols. Once started, the indicator calculates
BinaryScalping
Andrey Spiridonov
BinaryScalping is a professional indicator for trading binary options and scalping. The algorithm of the indicator is based on the calculation of pivot points for each time period separately, the location of the price of the trading instrument relative to the pivot points is analyzed and the probability of a trading operation is calculated. The indicator has a built-in filter of trading signals based on the global trend. The indicator is installed in the usual way and works with any trading inst
Primus Trading Engine is a trading system that combines price action,ratio based indicators & custom indicators to create this leading indicator with a multi-timeframe approach to give you high probability trade setups for forex,CFD cash/futures,metals & binary option to assist in making predictions on what is MOST likely to happen in the market Main Chart Features Price Action Signal-Arrow displayed on a specific bar;NOT buy/sell arrow;DOES NOT repaint;Bullish arrow on a bullish bar,price is l
This is the FXTraderariel PowerTrend . It compute a trendfollowing system based on it own algorithm. It gives you a buy or sell signal based on the trend. It based on the Supertrend, but our Version is not repainting. Furthermoore we added some Improvements and you can get an Arrow, Push or Alert when the trend changes. Depending on the settings it and trading style, it can be used for scalping or long-term trading . The indicator can be used on every time frame , but we advise to use it on H1
BinaryUniversal
Andrey Spiridonov
BinaryUniversal is a signal indicator for binary options and Forex. In its work, the indicator uses a complex algorithm for generating signals. Before forming a signal, the indicator analyzes volatility, candlestick patterns, important support and resistance levels. The indicator has the ability to adjust the accuracy of the signals, which makes it possible to apply this indicator for both aggressive and conservative trading. The indicator is set in the usual way, it works on any time period and
Sweet Waffle
Christophe Godart
The arrows are calculated with: -     2 Parabolic  parameters -     2 ADX parameters -     4 Stochastic parameters We recommend to combine it with Parabolic, ZigZag or Elliot waves indicator. Always trade the trend! If you make sure to draw your trend lines and support/resistance zones you will just have to wait for the signal to appear. Take the trade. For Binary Options it is advisable to set the expiry time to 5-15 min in M1 chart. THIS INDICATOR IS ZERO REPAINT Best assets to trade: - EUR
Let´s try to make some real money! Call me profit addicted. I thought why not try to make THE dream come reality. With discipline, a clear strategy and this indicator I focus on entering the perfect trades. This indicator is very easy to use as you will get perfect entry points for Put or Call trades. The arrows are calculated with: -     Momentum  parameters -     Candle stick patterns -     Fundamental Price action We recommend to combine it with Parabolic, ZigZag or Elliot waves indicator
SystemPro
Andrey Spiridonov
SystemPro - a professional indicator, is a full-fledged, self-sufficient author's strategy for working in the Forex market. A unique algorithm for analyzing the foreign exchange market is based on the calculation of reference points for three different time periods. Thus, the indicator simultaneously analyzes the long-term, medium-term and short-term price behavior before issuing a signal. The indicator is set in the usual way and works with any trade symbols. Advantages of the indicator It is
作者的更多信息
HFT Fast M1 Gold Scalper V8 EA
Martin Alejandro Bamonte
Dear traders, after having voluntarily removed the HFT FAST M1 GOLD SCAPER V6 EA a couple of months ago, and receiving hundreds of messages—having listened to both “camps”: those who asked me to tame the beast, and those who got very upset when I actually did limit it—I realized that both sides were right, but it’s impossible to please different types of traders with different styles and levels of aggressiveness in trading. After running tons of tests with this beastly EA, I concluded that the i
Aurum Apex Mt4 EA
Martin Alejandro Bamonte
5 (2)
现在您可以从 评论 选项卡下载Aurum Apex的演示版本,以评估其在您自己的经纪商上的实时表现! Aurum Apex EA 是一款功能强大的 100% 自动化交易工具,专为 MT4 平台设计。它实时分析市场,发现各种交易机会。 适用于所有级别的交易员,Aurum Apex EA 提供三种风险模式,可通过风险参数进行调整: 风险 = 0.1(低风险): 适用于对黄金行情不熟悉的新手交易员。此设置最小化意外惊喜,同时建立信心。 风险 = 0.2(中风险): 推荐给熟悉黄金交易的经验丰富的交易员。它在潜在利润和回撤之间实现最佳平衡。 风险 = 0.3(高风险): 针对每天只使用几个小时的高级交易员。此设置适用于在使用 EA 3 到 4 小时后将其停用的人。在重大的美元和比特币新闻事件期间建议谨慎。 我们建议在您的 ECN 或零点差账户上最低使用 $1000 的金额,仅在 M1 时间框架上交易 XAUUSD 货币对。然而,Aurum Apex 可以根据您账户中的可用资金自动调整手数。 营业时间: 默认的营业时间是从早上 8:00 到晚上 10:00(经纪人的时间),无需手动调整即可实现
Candle Probability Scalper
Martin Alejandro Bamonte
Candle Probability Scalper 该指标使得剥头皮交易变得简单且100%直观。 Candle Probability Scalper 会让你一目了然地看到买方和卖方的力量百分比数据,以 实时 方式显示在当前K线中。 百分比数据会在每个跳动中更新,因此每秒钟你都可以知道大多数买卖双方的行为,没有任何延迟。这将极大地帮助你确定或确认买方和卖方的力量,以及价格可能的走向。 以下是如何使用的指南: 1. 查看M1时间框中的买方和卖方百分比,并用其他时间框(M5, M15)进行确认: 如果 M1中的买方百分比超过60% ,且M5和M15中的买方百分比与M1一致,也超过60%,这是一个 买入 的好信号。 如果 M1中的卖方百分比超过60% ,且M5和M15中的卖方百分比与M1一致,也超过60%,这是一个 卖出 的好信号。 这确保了动力不仅仅是短暂的,并有助于确认方向的稳定性。 就是这么简单!观察1分钟时间框中的市场主导方,并通过其他时间框来确认信号。 2. 何时退出交易: 保持交易短平快:一旦方向开始减弱或买卖双方的百分比显著下降,就退出市场。记住,这是一种剥头皮交易方式,
Scalping Signal NO Repaint NO Lag
Martin Alejandro Bamonte
5 (1)
"Scalping Signal No Repaint No Lag" 是市场上唯一一个在拖动到任何图表上时,无需加载任何模板或其他指标就能自动加载所有必要指标的指标。它会自动配置图表,使其看起来与提供的图像完全相同。此指标保证没有重绘或延迟的信号,因此非常适合在所有货币对和时间框架(TF)上进行剥头皮交易策略。 功能 自动加载指标 :当您将指标拖动到任何图表上时,所有附加的必要指标都会自动加载,并且图表会根据预设的偏好进行配置。不过,如果您愿意,可以从设置中更改参数。 图表可视化 :调整图表属性以增强可视化效果,包括使用日本蜡烛和特定颜色的多头和空头蜡烛。可以根据需要修改背景和蜡烛的颜色。 信号生成 :使用两个移动平均线之间的差异以及RSI与其EMA的交叉来生成买入和卖出信号,并在图表上用箭头表示。 趋势可视化 :根据快速和慢速移动平均线的比较显示当前市场趋势(多头、空头或中性)。 点差可视化 :在图表上显示当前货币对的点差,以便您选择点差较低的货币对。开仓前请务必检查。 用于信号的指标 简单移动平均线(SMA) :用于计算快速和慢速移动平均线之间的差异。这些移动平均线不会重绘,因为
M1 Easy Scalper
Martin Alejandro Bamonte
M1 EASY SCALPER is a scalping indicator specifically designed for the 1-minute (M1) timeframe, compatible with any currency pair or instrument available on your MT4 terminal. Of course, it can also be used on any other timeframe, but it works exceptionally well on M1 (which is challenging!) for scalping. Note: if you're going to scalp, make sure you have an account suitable for it. Do not use Cent or Standard accounts as they have too much spread! (use ECN, RAW, or Zero Spread accounts) Robustn
Gold Vertex EA
Martin Alejandro Bamonte
Gold Vertex EA is a reliable and stable option for those looking to automate their trading in the gold market. With a robust system based on one of the most effective indicators and a solid trend-following strategy, Gold Vertex EA is a powerful tool for traders who want precise, worry-free trading. Requirements Platform : MetaTrader 4 Supported Instruments : Specifically developed and configured for Gold (XAUUSD) Recommended Account Type : ECN or low spread Minimum Deposit Recommended : $100 Tim
Clear Breakout
Martin Alejandro Bamonte
5 (1)
"Breakout Buy-Sell" 指标旨在根据不同市场交易时段(东京、伦敦和纽约)的价格突破,识别并突出潜在的买卖机会。该指标帮助交易者清晰地可视化买卖区域,以及止盈(TP)和止损(SL)水平。 使用策略 该指标可以按以下方式使用: 初始设置 :选择交易时段并调整 GMT 偏移。 市场可视化 :观察每个交易时段开始时绘制的突破箱。这些箱子表示该期间的最高点和最低点。 买卖信号 :价格突破箱子的最高点被认为是买入信号。价格突破最低点被认为是卖出信号。 风险管理 :使用 TP1、TP2、TP3 和 SL 水平来管理头寸。TP 水平设计用于不同的利润目标,而 SL 确保对不利走势的保护。 应用策略 为了最大限度地利用此指标,建议采用以下策略: 伦敦时段 :选择伦敦时段,并根据您的经纪商位置调整 GMT 偏移。 目标设置 :根据当前市场波动性定义 TP 和 SL,或允许每个货币对的特定建议。 主动监控 :观察突破箱,等待市场条件下的买入或卖出信号。 警报管理 :设置警报,当价格达到关键水平时通知您,这样就不需要不断监控图表。 外部参数说明 Margin :在突破水平上添加的点数空间,以建
GbpUsd Pip Hunter EA
Martin Alejandro Bamonte
GBPUSD Pip Hunter EA 主要功能: 为GBPUSD在M15时间框架优化: 专为GBPUSD货币对在15分钟图表上设计和测试。 最低推荐账户余额: 要求最低账户余额为1000美元,以确保低回撤。 适合的点差: 最好使用低点差或ECN账户,以最大化盈利。 风险管理: 包括通过将指数手数功能设置为1.0来禁用该功能的选项,根据您的交易需求进行调整。 可定制参数: 提供一系列可调整参数,允许用户根据自己的交易风格和风险承受能力定制EA。 GBPUSD Pip Hunter EA参数解释 MM(资金管理开关) 描述: 一个用于启用或禁用资金管理功能的开关。 选项: 否: 禁用资金管理。 是: 启用资金管理。 MMType 描述: 指定使用的资金管理类型。 选项: 否: 禁用资金管理。 是: 启用资金管理。 UseAdd 描述: 用于启用或禁用额外交易仓位的布尔参数。 选项: 是: 允许多个交易仓位。 否: 只允许一个交易仓位。 LotExponent 描述: 用于计算手数的指数值。 示例: 1.5 备注: 将其设置为1.0表示禁用指数手数功能,所有交易使用相同的手数。 Slip
Multi Timeframe Moving Averages
Martin Alejandro Bamonte
MTFMA(多时间框架移动平均线)指标在不同的时间框架上使用多条移动平均线(MA)提供买卖信号(不会重绘),显示在主图表的独立窗口中。它既多功能又易于解读,适用于小时间框架的剥头皮交易和大时间框架的长期交易。 为什么是多时间框架? 术语多时间框架指的是指标使用和组合多个时间框架数据的能力。MTFMA基于四条可配置的移动平均线(MAs)计算并显示信号。每条MA可以调整不同的周期、计算方法和价格类型,使交易者能够在一个图表上看到短期和长期趋势的组合。 关键点: 多功能性:适用于任何时间框架,从几分钟到几个月,适用于剥头皮交易和长期交易。 不重绘:一旦生成信号(向上或向下箭头),它不会改变颜色,允许交易者依靠生成的信号做出交易决策。 易于解读:买卖信号在下方指标中清晰显示为绿色和红色箭头,消除了复杂分析的需要。 可配置性:用户可以调整移动平均线的参数以适应他们的具体交易策略。 增强策略: 为了实现安全的入场,建议等待所有四条EMA变为相同颜色。最佳入场是在所有四条EMA变色的第一根或第二根蜡烛上进行。 只有在与区间突破相一致时,您可以在4根甚至5根蜡烛后打开您的头寸。我想强调,只有在出现明确
NextCandlePredictor No Repaint
Martin Alejandro Bamonte
NextCandlePredictor 指标 NextCandlePredictor 是一种带有警报的信号指标,不会重绘,不会改变颜色,不会移动,不会消失且没有延迟。它将帮助您识别任何时间框架内的下一个或即将到来的蜡烛的方向。高度推荐用于纽约、伦敦或甚至两者重叠等高波动市场。 主要特征: 时间框架的多功能性: 提供在任何时间框架内快速准确的信号,从 M1 到 H1 及更长时间。 清晰的买入/卖出信号: 使用 ADX 的 DI+ 和 DI- 线生成清晰的买入和卖出信号,确保您做出最佳的交易决策。 直观的可视化: 信号直接显示在图表上,绿色(买入)和红色(卖出)箭头,允许快速和轻松的读取。 可自定义的设置: 根据您的偏好和交易策略调整分析的柱数和警报选项。请根据您希望使用的 TF 查看下面的建议表。 即时和蜡烛收盘时的可选警报: 默认情况下,警报会在满足 ADX 条件的同一蜡烛上发出,确保信号的及时性。您还可以选择在当前蜡烛收盘时接收警报以获得更多确认。 快速性能: 设计为高效运行,理想用于高频操作和快速决策。 不重绘: 一旦信号发出,它将固定在当前蜡烛上,不会移动、改变颜色或消失。 无延
"MultiSymbol & TF Chart Integrated" 指标旨在快速提供全面的市场视图,允许您在单个图表上监控多达60个货币对(多模式)或在所有时间框架中查看您交易的货币对(简单模式)。 主要优点: 全面监控: 允许在单个图表上一目了然地实时监控所有所需的货币对。 节省时间: 避免了在图表之间切换的需要,实时查看每个货币对的行为。 趋势分析: 非常适合趋势交易者,允许您查看更高的时间框架以在做出决策前确认趋势。 极端定制化: 根据您的具体需求调整指标的每个方面。 极端定制化: 高度可配置的指标参数: 符号和时间框架: 允许配置多达60个不同的符号。 每个符号可以有自己的时间框架(例如,M1,M5,M15,M30,H1,H4,D1,W1,MN1)。 显示模式: 简单模式: 配置具有特定时间框架的单个图表。 多模式: 配置具有不同符号和时间框架的多个图表。 颜色配置: 可定制的看涨和看跌蜡烛颜色。 蜡烛灯芯的颜色。 价格刻度的颜色。 缩放和定位: 基于价格范围和ATR的图表自动缩放。 使用像素参数定位图表。 图表布局的行数和列数。 列与列之间的间距和行与行之间的间距。 图
Pairs and TF Changer
Martin Alejandro Bamonte
厌倦了在多个图表之间切换以监控不同的货币对和时间框架? Pairs and TF Changer 指标将彻底改变您的交易体验! 加载所有策略指标后,将 Pairs and TF Changer 添加到图表中。如有必要,您可以调整其位置、颜色或显示的列数! 主要特点: 无缝集成: 轻松将此指标集成到您的交易策略中。 只需点击一次,即可在单个图表上交易所有货币对和时间框架。 无需切换或打开其他图表。 高度可定制: 在图表上的任何位置调整其位置(上、下、左、右)。 配置显示1行或10行按钮。 自定义颜色以匹配您的交易主题。 使按钮透明以保持图表清晰整洁。 通用兼容性: 兼容所有类型的指标和策略。 支持所有符号,包括外汇、金属、美股、指数、石油、期货和加密货币。 配置参数: UniqueID: "Pairs and TF Changer" 指标的唯一标识符。 ToAddSymbols: "您可以添加任何无空格的符号,以分号 ';' 分隔" 允许您添加要监控的符号。 Symbols: "EURUSD;USDJPY;GBPUSD;USDCHF;AUDUSD;AUDCAD;AUDCHF;AUDNZD
GO Trend MultiTimeFrame
Martin Alejandro Bamonte
GoTrend 多时间框架指标 "GoTrend Multi-Timeframe" 指标是交易员寻求快速高效地评估不同时间框架内货币对整体和具体趋势的必备工具。 此指标允许交易员一目了然地获得市场方向的清晰全面视图,优化决策过程并提高其交易策略的有效性。 主要特点: 多时间框架分析: 此指标提供六个不同时间框架的详尽分析:M5, M15, M30, H1, H4 和 D1,使交易员能够了解每个时间段的趋势。 集成技术指标: 此指标使用五个可靠的技术指标:RSI, SAR, MA, MACD 和 ADX,以确定每个时间框架的趋势方向。 清晰直观的可视化: 信号显示在主图表的选定角落,使用直观的符号和颜色。这使得交易员能够一目了然地评估市场情况。 组合信号: 除了每个指标的单个信号外,"GoTrend Multi-Timeframe" 还提供一个组合信号,总结该货币对的整体市场趋势。 交易优势: 快速清晰的趋势概览: 使用此指标,交易员可以快速清晰地看到多个时间框架内的趋势方向,这对于做出知情且及时的决策至关重要。 优化进出场点: 不同时间框架内的买卖信号帮助交易员优化进出场点,增加交易成
Inferno Signals EA
Martin Alejandro Bamonte
Inferno Signals EA 旨在利用市场的重大波动,运行在稳健的 M30 时间框架上。 它非常适合那些希望以较少的初始资金开始的用户,最低只需每对 100 美元,具有自动资金管理功能,包括动态手数调整和安全措施,如止损(SL)。 凭借低回撤和专注于捕捉最佳机会的策略,Inferno Signals EA 旨在在确保投资安全的前提下最大化收益。该 EA 避免过度交易,仅在特定区域开仓,能够检测到强劲趋势的延续和可能的反转点。当价格处于最佳区域时,Inferno Signals EA 将采取行动并持续进行交易,而当没有明确的机会时,它将暂停操作。 EA 操作: EA 使用挂单方式,如 Buy Stop 和 Sell Stop,这些挂单将相应地变成买单或卖单,并始终通过止损 (SL) 进行保护。 默认设置适用于大多数环境。然而,根据账户类型(推荐使用 ECN 或 Zero Spread 账户),可能需要调整“Distance”参数(默认设置为 21)。根据经纪商和滑点情况,可能需要将其增加到 51。例如,这一调整需要每位交易者根据他们的账户特性和交易的货币对进行测试。 EA 包含最
MarketPrice Indicator
Martin Alejandro Bamonte
The MarketPrice Indicator is designed to provide a quick, one-glance visualization of the trend direction for a currency pair across all time frames (Time Frames), streamlining decision-making. MarketPrice Indicator is based on daily levels and trading signals derived from moving average crossovers and market strength according to various technical indicators. It comes fully configured, though you can, of course, modify any parameters as desired. Indicator Logic The indicator uses a combination
Last 50 Pips
Martin Alejandro Bamonte
FlashPoints Breakout
Martin Alejandro Bamonte
在每天的市场开始时, Flashpoints Breakout 将使用前一天的数据(最高价、最低价和收盘价)来审查枢轴、支撑和阻力位,以计算两个突破水平(看涨和看跌)。 这样一来,您可以在早上第一时间获得新的入场水平以及止盈 (TP) 和止损 (SL) 值,从而在无需额外计算的情况下下达买入止损或卖出止损挂单。 通过 Flashpoints Breakout ,您每天可以根据预期的突破水平下达 1 或 2 笔买入止损单和 1 或 2 笔卖出止损单,以确保不遗漏任何机会。 查看顶部的数据面板并下达订单 —— 1 或 2 笔买单和 1 或 2 笔卖单。在面板中,您会找到精确的入场值、SL 和 TP,以及图表上对应这些值的线条(参见图像)。 1. 买入操作 (BUY): 入场 1 "BUY" ==> 在买入区域: 订单 1: 买入止损在买入区域。 止损 (SL): 卖出区域。 止盈 (TP): 突破高点。 入场 2 "BUY" ==> 在突破高点: 订单 2: 买入止损在突破高点。 SL: 买入区域。 TP: 目标。 2. 卖出操作 (SELL): 入场 1 "SELL" ==> 在卖出
Buy Sell Magic Signal
Martin Alejandro Bamonte
BUYSELLMAGIC is a non-repainting signal-type trading indicator designed to precisely detect entry points in the market.  Features Reliable and permanent signals : BUYSELLMAGIC signals are final once the candle closes, ensuring they will not be modified or removed from the chart. This gives you the confidence of working with an indicator that keeps its signals stable and trustworthy. Comprehensive alerts : In addition to signals on the chart, you’ll receive notifications via email, pop-up alerts
Automatic Fibonacci Pivots
Martin Alejandro Bamonte
Automatic Fibonacci Pivots automatically calculates pivot levels and support/resistance based on Fibonacci, clearly showing key reference points that indicate potential reversal or trend continuation zones, as well as buy and sell areas . Designed for traders seeking clarity on charts without having to recalculate and manually place Fibonacci levels each time. Once set up on your computer, it will send an alert to your phone when a potential buy/sell signal is issued, allowing you to trade direc
Trade Insights Display
Martin Alejandro Bamonte
Trade Insights Display is the ideal companion for traders who want to operate with clarity and precision. This indicator provides real-time access to critical account data, such as: Balance Equity Margin Spread Swap Remaining time for the current candle . These data points are essential, regardless of the strategy or other indicators you use. Having this indicator always visible allows you to quickly assess your account status, the swap for each pair (helping you avoid high-cost trades), and the
EuroGeddon EA
Martin Alejandro Bamonte
EUROGEDDON EA – 无与伦比的稳定性与风险控制 EUROGEDDON EA 是一款 自适应智能 全自动交易机器人,专为小账户稳健增长而设计,确保始终保持对账户资金的全面控制。 使用 每 $200 对应 0.01 手 的低风险策略,它在运行过程中实现了极低的回撤,同时展现出卓越的性能 —— 值得你亲自验证。 下载演示版本并亲自体验。 不要只看回测结果,试试我们频道中提供的演示账户,看看它在真实市场中的表现。 即使在重大经济新闻期间也能稳定运行 EA 的逻辑不会受到高影响力的基本面事件影响。它可以在高波动期间持续运行而不被打乱。 自适应智能 (这正是它能在新闻期间稳定运行的关键) 虽然 EA 预设了入场间距和止盈点位,但它并不总是严格遵守这些参数。 在常规市场环境下它会执行设定值,但一旦检测到由新闻或其他因素引发的 高波动情况 ,它就会 实时调整策略 。 它可以在已有交易的情况下,动态修改入场间距和止盈点,从而降低风险,保护账户资金,避免过度暴露。 无需再担心新闻时段! EUROGEDDON 会自动检测市场波动并进行调整, 你无需手动干预 。
筛选:
无评论
回复评论