ATR Bands by tSageHuz
- 指标
- Nguyen Trung Khiem
- 版本: 1.0
Here's a clearer, more organized description for the indicator:
An enhanced ATR Bands indicator that provides flexible, configurable price bands based on Average True Range (ATR). While traditional ATR-based indicators often have limitations in their configurability and functionality, this version offers comprehensive features for both stop-loss and take-profit level calculations.
Key Features:
- Configurable source price (close, high, low) for ATR band calculations
- Adjustable scaling factors with decimal precision for fine-tuned bands
- Upper and lower bands displayed simultaneously
- Optional take-profit bands with independent scaling
- On-chart data table showing exact values and distances from close
- Compatible with non-chart timeframes
- Organized settings with helpful tooltips and common value suggestions
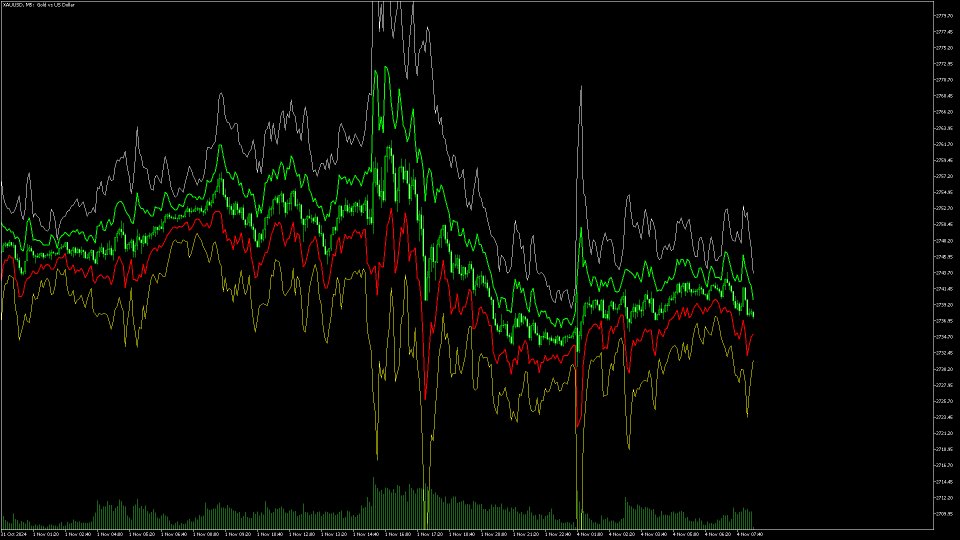
The indicator can help identify potential support/resistance zones, particularly during consolidation periods. When price breaks and closes outside the ATR bands, it often signals a significant move in that direction, making it useful for both standalone signals and confluence with other indicators.
Default Settings:
- ATR Period: 3 (updated from 14)
- Band Scaling Factor: 2.5 (updated from 2.0)
Based on the original work by AlexanderTeaH, with significant enhancements to improve usability and technical analysis capabilities.
Input Parameters:
- ATRPeriod (default = 3): Number of periods for ATR calculation
- ATRMultiplier (default = 2.5): Multiplier for ATR bands width
- ShowTPBands (default = false): Enable/disable Take-Profit bands
- TPScaleFactor (default = 1.5): Multiplier for Take-Profit bands Colors and Visualization:
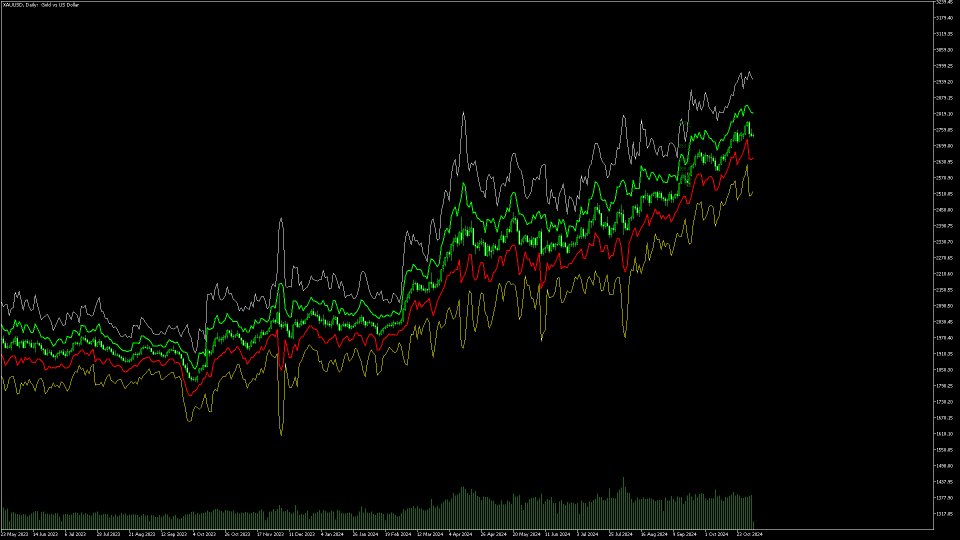
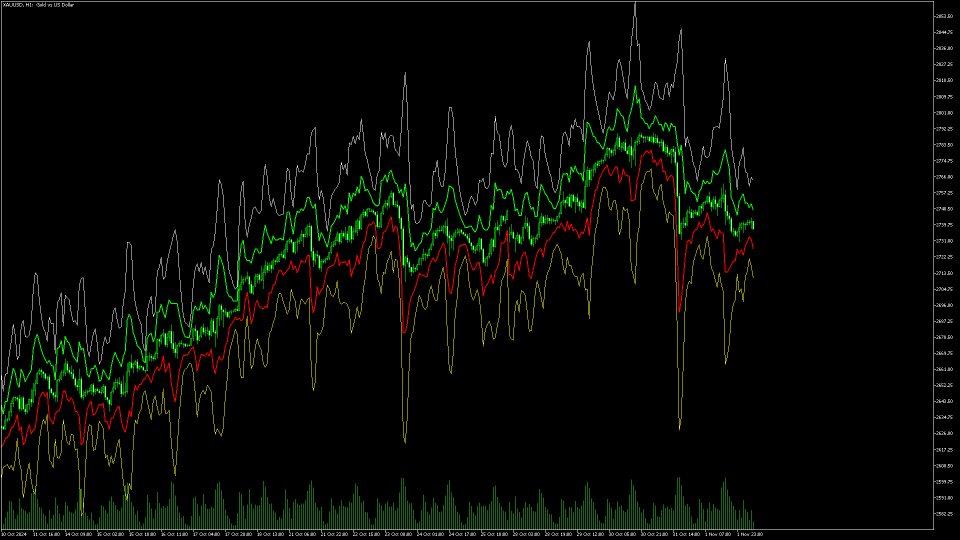
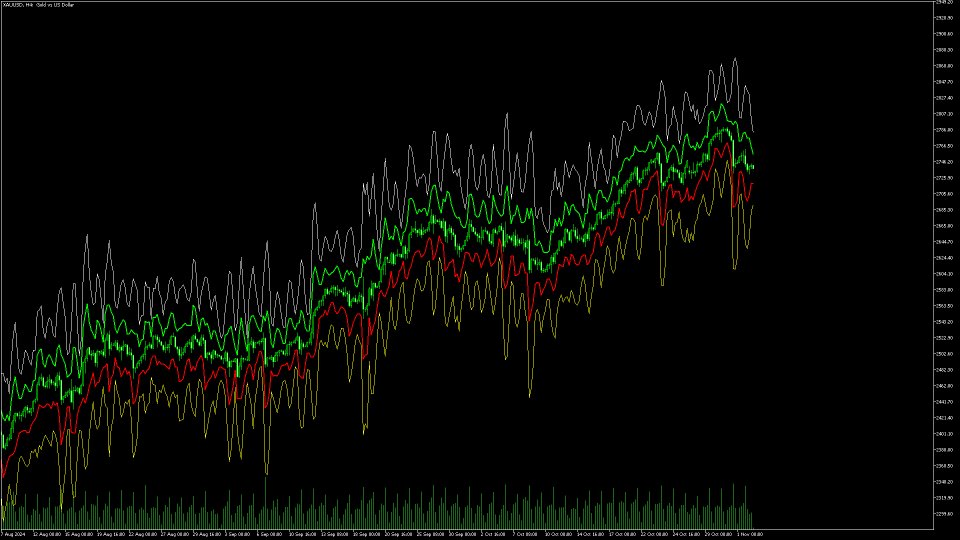
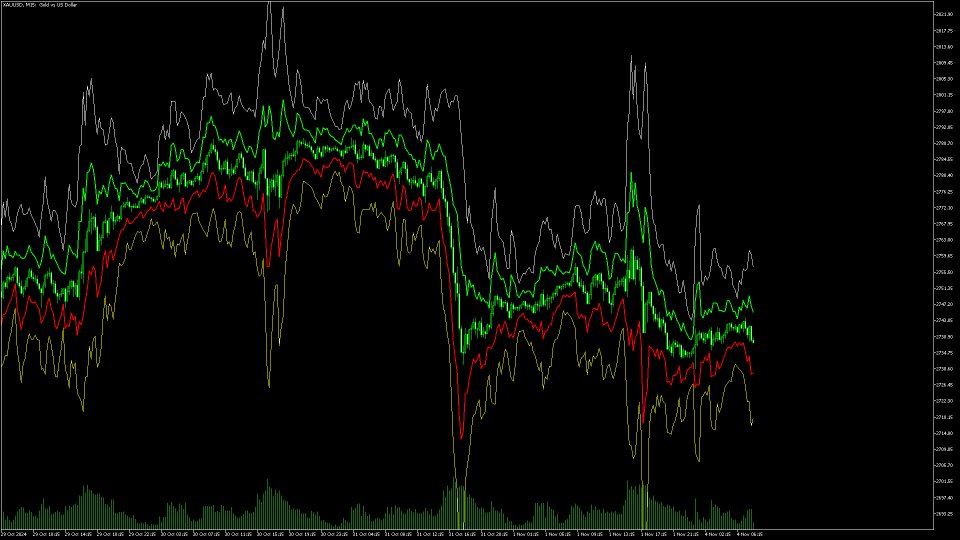
- Upper ATR Band: Green line (width 2) - Lower ATR Band: Red line (width 2)
- Upper TP Band: White line (width 1)
- only if ShowTPBands is true
- Lower TP Band: Yellow line (width 1)
- only if ShowTPBands is true
Basic Usage:
1. The ATR bands show volatility-based support and resistance levels
2. Upper Band (Green) = Potential resistance/short entry
3. Lower Band (Red) = Potential support/long entry
Trading Scenarios:
a) Long Position:
- Entry: When price approaches the Lower ATR Band (red line)
- Stop Loss: Below the Lower ATR Band
- Take Profit: At the Upper TP Band (if enabled)
b) Short Position:
- Entry: When price approaches the Upper ATR Band (green line)
- Stop Loss: Above the Upper ATR Band
- Take Profit: At the Lower TP Band (if enabled)
Common Settings:
- For less volatile pairs: Try ATRPeriod = 14, ATRMultiplier = 2.0
- For more volatile pairs: Try ATRPeriod = 3, ATRMultiplier = 2.5
- For aggressive trading: Lower ATRMultiplier (e.g., 1.5)
- For conservative trading: Higher ATRMultiplier (e.g., 3.0)
1. Combine with other indicators:
- Trend indicators (Moving Averages, MACD)
- Momentum indicators (RSI, Stochastic)
- Support/Resistance levels
2. Risk Management:
- Don't rely solely on the bands for entries/exits
- Always use proper position sizing
- Consider market conditions and news events
3. Optimization:
- Use the Strategy Tester to find optimal settings for your trading style
- Test different ATRPeriod and ATRMultiplier combinations
- Keep track of which settings work best for different market conditions
