• 概述
  • 评论
  • 评论
  • 新特性

Stochastics on Prices

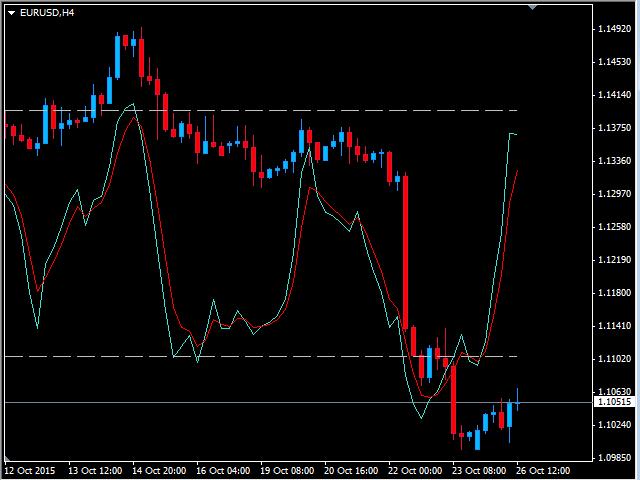
Simple Stochastic displayed over the prices rather than in a separate window.

The parameters are the very same you can find in the normal Stochastics:

  • %K period - K's MA
  • %D period - %K MA
  • Slowing - MA applied to obtain a signal
  • Price Field - High+Low divided by 2 or Close Price
  • MA method - simple, exponential, smoothed or linear weighted
  • OverBoughtLevel - draw the overbought reference line at this level
  • OverSoldLevel - draws the oversold reference line at this level
推荐产品
Signal From Level
Yaroslav Varankin
Binary Options Support Resistance Indicator This indicator is designed for binary options trading and effectively shows retracements from support and resistance levels. Signals appear on the current candle. A red arrow pointing downwards indicates a potential selling opportunity, while a blue arrow pointing upwards suggests buying opportunities. All that needs adjustment is the color of the signal arrows. It is recommended to use it on the M1-M5 timeframes as signals are frequent on these timef
The Th3Eng PipFinite indicator is based on a very excellent analysis of the right trend direction with perfect custom algorithms. It show the true direction and the best point to start trading. With StopLoss point and Three Take Profit points. Also it show the right pivot of the price and small points to order to replace the dynamic support and resistance channel, Which surrounds the price. And Finally it draws a very helpful Box on the left side on the chart includes (take profits and Stop loss
Noize Absorption Index MT4
Ekaterina Saltykova
5 (1)
Noize Absorption Index - is the manual trading system that measures the difference of pressure between bears forces and bulls forces. Green line - is a noize free index that showing curent situation. Zero value of index shows totally choppy/flat market.Values above zero level shows how powerfull bullish wave is and values below zero measures bearish forces.Up arrow appears on bearish market when it's ready to reverse, dn arrow appears on weak bullish market, as a result of reverse expectation. S
Advanced Stochastic Scalper
Evgeny Belyaev
4.36 (11)
Advanced Stochastic Scalper - is a professional indicator based on the popular Stochastic Oscillator. Advanced Stochastic Scalper is an oscillator with dynamic overbought and oversold levels, while in the standard Stochastic Oscillator, these levels are static and do not change. This allows Advanced Stochastic Scalper to adapt to the ever-changing market. When a buy or a sell signal appears, an arrow is drawn on the chart and an alert is triggered allowing you to open a position in a timely mann
Heiken Ashi candle chart is an improved version of The Japanese candle chart, which can effectively filter the market "noise" of the Japanese candle chart. It is favored by many traders for its simplicity and intuition. For trend traders, the HA candle chart is a magic tool. Unlike the traditional Japanese candle chart, Heikenashi does not reflect the opening price, high price, low price and closing price of the market. Instead, Heikenashi calculates the value of a single K line in the dominant
Strong Retracement Points Pro demo edition! SRP (Strong Retracement/Reversal Points) is a powerful and unique support and resistance indicator. It displays the closest important levels which we expect the price retracement/reversal! If all level are broken from one side, it recalculates and draws new support and resistance levels, so the levels might be valid for several days depending on the market! If you are still hesitating to start using this wonderful tool, you can check this link to see h
Pro Magic Signal   indicator is designed for signal trading. This indicator generates trend signals.  It uses many algorithms and indicators to generate this signal. It tries to generate a signal from the points with the highest trend potential. This indicator is a complete trading product. This indicator does not need any additional indicators.  The indicator certainly does not repaint. The point at which the signal is given does not change.  Thanks to the alert features you can get the signals
Binary Option Signal
Yaroslav Varankin
Indicator for binary options arrow is easy to use and does not require configuration works on all currency pairs, cryptocurrencies buy signal blue up arrow sell signal red down arrow tips do not trade during news and 15-30 minutes before their release, as the market is too volatile and there is a lot of noise it is worth entering trades one or two candles from the current period (recommended for 1 candle) timeframe up to m 15 recommended money management fixed lot or fixed percentage of the depo
ZhiBiCCI MT4
Qiuyang Zheng
【ZhiBiCCI】指标适合所有的周期使用,也适合所有的市场品种。 【ZhiBiCCI】绿色实线是逆转看涨背离。绿色虚线是经典的看涨背离。 【ZhiBiCCI】向红色实线是反向看跌背离。红色虚线是古典看跌背离。 【ZhiBiCCI】可以在参数里面设置(Alert、Send mail、Send notification),设置为(true)就可以发送即时信号到警报窗口、电子邮件、即时消息。 参数设置说明: 【displayAlert】:这是警报开关,设置成true,如果出现箭头就会自动警报提示;设置成false,则不会警报提示。 【sendmail_NO_OFF】:这是发送邮件的开关,设置成true,如果出现箭头就会发送邮件到你在MT4设置好的邮箱里面;设置成false,则不会发邮件。 【sendnotification_NO_OFF】:这是发送即时消息的开关,设置成true,如果出现箭头就会发送消息到你的移动设备;设置成false,则不会发消息。 更多好用的指标网址: https://www.mql5.com/en/users/zhengqiuyang/seller
斐波那契折返和扩展画线工具 适用于MT4平台的斐波那契折返和扩展画线工具,适合于使用黄金分割交易的交易者 优点:没有多余的线,没有过长的线,易于观察发现交易的机会 试用版: https://www.mql5.com/zh/market/product/35884 主要功能: 1.可以直接画出多组斐波那契折返,可以看出重要折返点之间的关系; 2.可以画出斐波那契扩展,比率有三种0.618,1,1.618 3.画出的斐波那契折返和扩展均可左右移动,有数值显示,方便观察 4.可通过数字键切换周期 使用指南和功能键: 1.按 [ 或R画折返,按需要画折返,最多云持8组折返; 2.按 ] 或E画扩展; 3.按 \ 删除当前周期下的所有扩展和折返,其余周期的不受影响 4.如何左右移动折返和扩展 (1)点击第一组折返的F5字符,可以左右移动折返; (2)点击COP的字符 ,可以左右移动扩展; 5. (1)点击第一组折返的F5字符,按del 可以删除这组折返; (2)点击COP的字符, 按del 可以删除这组扩展; 6.修改折返和扩展(随着市场的运行
Alpha Trend
Evgeny Belyaev
3.33 (3)
Alpha Trend is a trend indicator for the MetaTrader 4 platform; it has been developed by a group of professional traders. The Alpha Trend indicator finds the most probable tendency reversal points, which allows making trades at the very beginning of a trend. This indicator features notifications, which are generated whenever a new signal appears (alert, email, push-notification). This allows you to open a position in a timely manner. Alpha Trend does not redraw, which makes it possible to evalua
Credible Cross System
Muhammed Emin Ugur
Credible Cross System   indicator is designed for signal trading. This indicator generates trend signals. It uses many algorithms and indicators to generate this signal. It tries to generate a signal from the points with the highest trend potential. The indicator works based on instant price movements. This indicator is a complete trading product. This indicator does not need any additional indicators. The indicator certainly does not repaint. The point at which the signal is given does not
Real Magic Trend
Muhammed Emin Ugur
This   Real Magic Trend   indicator is designed for signal trading. This indicator generates trend signals. It uses many algorithms and indicators to generate this signal. It tries to generate signals from the points with the highest trend potential. This indicator is a complete trading product. This indicator does not need any additional indicators. The indicator is never repainted. The point at which the signal is given does not change.      Features and Recommendations Time Frame
Infinity Trend Pro
Yaroslav Varankin
This is a trend indicator without redrawing Developed instead of the binary options strategy (by the color of the Martingale candlestick) Also works well in forex trading When to open trades (binary options) A signal will appear in the place with a candle signaling the current candle It is recommended to open a deal for one candle of the current timeframe M1 and M5 When a blue dot appears, open a deal up When a red dot appears, open a trade down. How to open trades on Forex. When a signal is rec
Pair Trading Station MT4
Young Ho Seo
3.67 (3)
How to use Pair Trading Station Pair Trading Station is recommended for H1 time frame and you can use it for any currency pairs. To generate buy and sell signal, follow few steps below to apply Pair Trading Station to your MetaTrader terminal. When you load Pair Trading Station on your chart, Pair Trading station will assess available historical data in your MetaTrader platforms for each currency pair. On your chart, the amount of historical data available will be displayed for each currency pai
Gvs Undefeated Trend   indicator is designed for trend and signal trading. This indicator generates trend signals.  It uses many algorithms and indicators to generate this signal. It tries to generate a signal from the points with the highest trend potential. This indicator is a complete trading product. This indicator does not need any additional indicators.  You can only trade with this indicator. The generated signals are displayed on the graphical screen.  Thanks to the alert features you ca
Veles Moment
Gennady Mazur
Индикатор iVeles_Moment представляет собой  обычный  Momentum, с пересчитанными и приведенными к нулю значениями . В отличии от обычного Momentum, наложены уровни сигнала в виде облака, что заметно расширяет области применения данного индикатора. Очень хорошо показывает разворотные моменты и циклы тенденций, может применяться как основной сигнал для входа в позицию. Параметры: period - период Momentum price - применяемая цена level - уровень облака
PZ ABCD Retracement
PZ TRADING SLU
3.75 (4)
该指标找到AB = CD回撤形态。 AB = CD回调模式是一种4点价格结构,其中初始价格区间被部分回调,然后与回调完成后等距移动,这是所有谐波模式的基本基础。 [ 安装指南 | 更新指南 | 故障排除 | 常见问题 | 所有产品 ] 可定制的图案尺寸 可定制的AC和BD比率 可定制的突破时间 可定制的线条,颜色和大小 它根据CD纤维水平显示SL和TP水平 视觉/声音/推送/邮件警报,用于模式和突破 AB = CD Retracements可以扩展和重新绘制很多内容。为了使事情变得更容易,该指标实施了一个转折:它在向交易发出信号之前等待正确方向的Donchian突破。最终结果是带有非常可靠的交易信号的重新粉刷指示器。输入donchian突破时段作为输入。 看涨回撤是蓝色的 空头回撤是红色的 请注意,价格模式(例如AB = CD)可以扩展,指标必须重新绘制以跟随该模式的扩展。如果图案重涂超出了参数中输入的AC / BD / AB = CD比率,则该图案将消失,因为它将不再有效。要交易这些模式,请求助于donchian突破信号。 输入参数 幅度:AB = C
YK Fibo Pivot Indicator
Peechanat Chatsermsak
YK-Fibo Pivot Indicator: Trade Smarter with Fibonacci Pivot Points The YK-Fibo Pivot Indicator is a powerful technical analysis tool that combines the precision of Fibonacci retracements with the insights of Pivot Points. Whether you're a novice or seasoned trader, this indicator empowers you to spot profitable opportunities in the market with ease. Why Choose YK-Fibo Pivot? Pinpoint Support & Resistance: By calculating Fibonacci levels based on the previous day's high, low, and close prices, y
首先,值得强调的是,这个交易工具是非重绘、非重画和非滞后的指标,非常适合专业交易。 在线课程,用户手册和演示。 智能价格行动概念指标是一个非常强大的工具,既适用于新手,也适用于经验丰富的交易者。它将超过20个有用的指标合并到一个指标中,结合了高级交易思想,如内圈交易员分析和智能资金概念交易策略。该指标侧重于智能资金概念,提供有关大型机构交易方式的见解,帮助预测它们的动向。 它在流动性分析方面尤其擅长,有助于理解机构的交易方式。它擅长预测市场趋势,并仔细分析价格波动。通过将您的交易与机构策略对齐,您可以更准确地预测市场走向。该指标多才多艺,擅长分析市场结构,识别重要的订单区块,并识别各种模式。 它擅长识别BOS和CHoCH等模式,理解动量的转变,并突出显示供需强劲的关键区域。它还擅长发现强大的不平衡,并分析价格创造更高高点或更低低点的模式。如果您使用斐波那契回撤工具,该指标可以满足您的需求。它还可以识别相等的高点和低点,分析不同的时间框架,并通过仪表板显示数据。 对于使用更高级策略的交易者,该指标提供了工具,如公平价值差指标和优惠和折扣区域的识别。它特别关注高时间框架订单
Owl smart levels
Sergey Ermolov
4.13 (23)
MT5版本  |  FAQ Owl Smart Levels Indicator   是一個完整的交易系統,包含   Bill Williams   的高級分形、構建正確的市場波浪結構的 Valable ZigZag 以及標記準確入場水平的斐波那契水平等流行的市場分析工具 進入市場和地方獲利。 策略的详细说明 指示灯使用说明 顾问-贸易猫头鹰助手助理 私人用户聊天 ->购买后写信给我,我会将您添加到私人聊天中,您可以在那里下载所有奖金 力量在於簡單! Owl Smart Levels   交易系統非常易於使用,因此適合專業人士和剛開始研究市場並為自己選擇交易策略的人。 策略和指標中沒有隱藏的秘密公式和計算方法,所有策略指標都是公開的。 Owl Smart Levels 允許您快速查看進入交易的信號,突出顯示下訂單的水平並向您發送有關已出現信號的通知。 優點很明顯: 清楚地顯示主要和更高時間框架的趨勢方向。 指示儀器信號的出現。 標記開單、止損設置和固定利潤的水平。 沒有多餘的,只有必要的結構! ZigZag   表示全球趨勢的方向,因此也表示貿易方向。 市場反轉點的短線清楚地表明在
Perfect for one minutes high trading and scalping. This indicator is very effective for trading on one minutes, in the hour. A combination of moving averages and STOCHASTICS calculation to produce a very convincing signal every hour. Blue colour signals a buy opportunity. Follow the X signs for possible buy points. The Blue average line serves as possible trend direction and support. Red colour signals a sell opportunity. Follow the X signs for possible sell points. The Red average line serves a
Lyne
Maksim Kalachev
About the Lyne indicator Lyne is a Metatrader 4 (MT4) indicator, the essence of which is to transform the accumulated historical data. The Lyne indicator makes it possible to detect various features and patterns in price dynamics that are invisible to the naked eye. Based on this information, traders can anticipate further price movement and adjust their strategy accordingly. This indicator has proven itself in the scalping strategy. The indicator works without repainting.
Power Renko MT4
Pierce Vallieres
Power Renko is an indicator which plots Renko bricks underneath the chart using a histogram. You can select the brick size and the timeframe of the Renko bricks as well as whether or not to use the close price or the high/low price of the candles. Renko bricks are based on price alone, not time, therefor the Renko bricks will not be aligned with the chart's time. They are extremely useful for trend trading and many different strategies can be formed from them. Buffers are provided allowing you t
The indicator displays the data of the Stochastic oscillator from a higher timeframe on the chart. The main and signal lines are displayed in a separate window. The stepped response is not smoothed. The indicator is useful for practicing "manual" forex trading strategies, which use the data from several screens with different timeframes of a single symbol. The indicator uses the settings that are identical to the standard ones, and a drop-down list for selecting the timeframe. Indicator Parame
Night ghost
Dmitriy Kashevich
Night Ghost - Arrow indicator for binary options. This is a reliable assistant to you in the future! - No redrawing on the chart -Works great on EUR/USD currency pairs! -Indicator accuracy up to 90% (Especially at night) -No long setup required (Perfectly set up for Binary Options) - Not late signals - The appearance of a signal on the current candle -Perfect for M1 period (No More!) - Eye-friendly candle color (Red and Blue) -Installed Alert Working with it: - Blue arrow
PZ Mean Reversion MT4
PZ TRADING SLU
2.33 (3)
采用专业和量化方法进行均值回归交易的独特指标。它利用了价格以可预测和可衡量的方式转移并返回均值这一事实,这允许明确的进入和退出规则大大优于非量化交易策略。 [ Installation Guide | Update Guide | Troubleshooting | FAQ | All Products ] 清晰的交易信号 非常容易交易 可定制的颜色和尺寸 实现性能统计 优于大多数交易策略 显示合适的止损和止盈水平 它实现了电子邮件/声音/视觉警报 这个怎么运作 该指标从更高的时间范围测量完全可定制的移动平均线的标准偏差,并使用趋势跟踪方法精确地找到交易。交易是通过深入当前图表的价格行为发现的,并在价格返回到平均价格区间时关闭,根据您选择的更高时间范围计算。由于其编码方式,该指标将远离高波动性和强劲趋势市场,并且仅在可预测的情况下进行交易,在可接受的波动性与方向性比率范围内,回归均值是可行的。 指标剖析 绿线是更高时间范围内的移动平均线(也就是平均值) 虚线区域是移动平均线周围的典型价格区间 蓝线是看涨交易的突破价格 红线是看跌交易的突破价格 交易是针对均值进行的,并在
Reliable Step
Gevorg Hakobyan
5 (1)
It would be good to always be aware of the "struggle" between buyers and sellers. Then it would be much easier to determine the best direction to go in order not to lose out. This indicator offers an original solution to this problem: the supply and demand values are compared with the High and Low prices for the selected period, thus trying to determine the market movement towards the stronger side without ignoring the strength of the opposite side. All this is displayed in a separate window usi
Classic Fractals indicator for MT4, with additional Trendlines connecting the latest couples of fractals ( fractals are showing highest high, and lowest low on each period) Rules for trendlines: -if new top fractal is below the last one = new resistance line -if new bot fractal is above the last one = new support line -Trendlines can be hidden -Fractals can be hidden Fractal Period = can be both even or uneven number, as it is setting for half (one side) of the bars sequence
Trend PRO Expert Advisor
Nguyen Tran Ha
1 (1)
Trend PRO Expert Advisor  is developed base on the PipFinite Trend PRO Indicator, the best indicators on the market so far. PipFinite  Trend Pro's smart algorithm detects the trend, filters out market noise and gives entry signals with exit levels.  This EA open order when the indicator has buy/sell signals and set SL/TP follow the indicator rules. You can read more information about PipFinite Trend PRO indicator  here . Important Information   This EA will only work if you purchased  PipFin
该产品的买家也购买
Gann Made Easy
Oleg Rodin
4.84 (57)
Gann Made Easy 是一个专业且易于使用的外汇交易系统,它基于使用先生理论的最佳交易原则。 W.D.江恩。该指标提供准确的买入和卖出信号,包括止损和获利水平。您甚至可以使用推送通知在旅途中进行交易。 购买后请联系我!我将免费与您分享我的交易技巧和丰厚的红利指标! 您可能已经多次听说过江恩交易方法。通常 Gann 的理论不仅对于新手交易者而且对于那些已经有一定交易经验的人来说都是非常复杂的东西。这是因为江恩的交易方法在理论上并不那么容易应用。我花了几年时间来完善这些知识,并将最好的原则应用到我的外汇指标中。 该指标非常易于应用。您所需要的只是将其附加到您的图表并遵循简单的交易建议。该指标不断进行市场分析工作并寻找交易机会。当它检测到一个好的入口点时,它会为您提供一个箭头信号。该指标还显示止损和获利水平。 换句话说,当您像先生一样进行交易时,该指标会为您提供最佳江恩建议。江恩亲自告诉你此时此刻该做什么。但最好的部分是您不需要了解任何有关江恩交易原则的知识,因为该指标会为您完成整个市场分析工作。
Atomic Analyst
Issam Kassas
5 (2)
首先值得强调的是,该交易指标是非重绘、非延迟的指标,这使其成为手动和机器人交易的理想选择。 用户手册:设置、输入和策略。 Atomic Analyst是一种PA价格行动指标,利用价格的力量和动量来寻找市场上更好的机会。配备了高级过滤器,可帮助去除噪音和假信号,并提高交易潜力。使用多层复杂的指标,Atomic Analyst扫描图表,并将复杂的数学计算转化为任何初学者都能理解并用来做出一致交易决策的简单信号和颜色。 “Atomic Analyst”是专为新手和经验丰富的交易者量身定制的综合交易解决方案。它将高级指标和一流功能融合为一体的交易策略,使其成为所有类型交易者的多功能选择。 日内交易和剥头皮策略:专为快速准确的日内交易和短期交易而设计。 日内和摆动交易策略:可用作追求价格大幅波动的日内和摆动交易者的可靠工具。 多货币和市场:凭借其可靠的精度,在不同的工具和市场上运作。 多个时间框架:可在多个时间框架上使用,性能良好。 稳定性:所有指标均不重绘、不重绘和不滞后,确保可靠的信号。 信号清晰度:提供箭头信号,用于清晰的入场和出场点。 实时警报:通过交易入场、SL和TP警报通知交
Gold Stuff
Vasiliy Strukov
4.89 (201)
Gold Stuff 是专为黄金设计的趋势指标,也可用于任何金融工具。 该指标不会重绘,也不会滞后。 推荐时间框架 H1。 在它指标工作全自动专家顾问 EA Gold Stuff。 你可以在我的个人资料中找到它。 重要! 购买后立即与我联系,以获得说明和奖金!   您可以免费收到我们的强力支持和趋势扫描指标的副本,请私信。大部头书! 购买后立即联系我以获得设置和个人奖励!   设置 绘制箭头 - 打开关闭。 在图表上绘制箭头。 警报 - 打开关闭声音警报。 电子邮件通知 - 打开关闭。 电子邮件通知。 Puch-notification - 打开关闭。 推送通知。 接下来,调整色域。 Gold Stuff 是专为黄金设计的趋势指标,也可用于任何金融工具。 该指标不会重绘,也不会滞后。 推荐时间框架 H1。 在它指标工作全自动专家顾问 EA Gold Stuff。 你可以在我的个人资料中找到它。 购买后立即联系我以获得设置和个人奖励!   设置 绘制箭头 - 打开关闭。 在图表上绘制箭头。 警报 - 打开关闭声音警报。 电子邮件通知 - 打开关闭。 电子邮件通
Trend Punch
Mohamed Hassan
5 (12)
This indicator is unstoppable when combined with our other indicator called  Support & Resistance . After purchase, send us a message and you will get it   for  FREE as a BONUS! Introducing Trend Punch , the revolutionary forex trend indicator that will transform the way you trade! Trend Punch is uniquely designed to provide precise buy and sell arrows during strong market trends, making your trading decisions clearer and more confident. Whether you're trading major currency pairs or exotic sym
Scalper Inside PRO
Alexey Minkov
4.69 (49)
An exclusive indicator that utilizes an innovative algorithm to swiftly and accurately determine the market trend. The indicator automatically calculates opening, closing, and profit levels, providing detailed trading statistics. With these features, you can choose the most appropriate trading instrument for the current market conditions. Additionally, you can easily integrate your own arrow indicators into Scalper Inside Pro to quickly evaluate their statistics and profitability. Scalper Inside
FX Power MT4 NG
Daniel Stein
5 (12)
通过 mql5 和 Telegram 上 的晨间简报获取每日市场更新,包括详细信息和屏幕截图 ! FX Power MT4 NG 是我们长期以来非常受欢迎的货币强度计算器 FX Power 的下一代产品。 这款下一代强度计算器能提供什么?您所喜爱的原版 FX Power 的所有功能 附加功能 黄金/XAU 强度分析 更精确的计算结果 可单独配置的分析周期 可自定义计算限制,以获得更好的性能 为希望查看更多信息的用户提供特殊的多实例设置 无尽的图形设置,可在每个图表中设置您最喜欢的颜色 无数的通知选项,让您再也不会错过任何重要信息 采用 Windows 11 和 macOS 风格的全新圆角设计 神奇的移动指标面板 FX Power 主要功能 所有主要货币的完整强势历史 所有时间框架内的货币强弱历史 所有经纪商和图表的计算结果完全相同 100% 可靠的实时计算 -> 无重绘 可通过下拉列表选择分析时段 通过自定义模式单独配置分析时段 可在一个图表中使用多个实例 可移动 FX Power 显示屏(通过拖放) 适用于高分辨率 QHD、UHD 和 4K 显示器 自动终端配置 针对平板电脑
Trend Pulse
Mohamed Hassan
5 (3)
Please contact me after purchase to immediately get your PDF strategy + documentation for Trend Pulse !  Official release price of $89  (1 /50 copies left). Next price is $199 . Introducing Trend Pulse , a unique and robust indicator capable of detecting bullish, bearish, and even ranging trends! Trend Pulse uses a special algorithm to filter out market noise with real precision. If the current symbol is moving sideways, Trend Pulse will send you a ranging signal, letting you know that it'
Apollo Pips PLUS SP
Oleg Rodin
5 (3)
请在购买产品之前阅读下面的信息! Apollo Pips PLUS SP 是一款独特的产品!它适合那些想要获得我的新“APOLLO PIPS”指标以及“超级包”奖金以及访问我所有交易指标的人! 通过购买 Apollo Pips PLUS SP 产品,您实际上购买的是全新版本的 Apollo Pips 指标。此版本的指标具有改进的算法和易于使用的参数,使您有机会在任何市场和任何交易风格中使用该指标。 该产品的购买者还可以免费访问我的所有其他指标,作为我的超级奖励!如果您想获得我所有的交易工具,那么该产品非常适合您!:) 但这还不是全部!:) 该产品的所有购买者也有资格免费获得我的新指标!:) 如果我有一个新的交易指标可用,您将能够在我的特权“SUPER PACK”终身奖金计划中完全免费获得它! 购买后请联系我以获得我的交易提示和超级礼包奖金!
TPSproTREND PrO
Roman Podpora
4.78 (18)
TPSpro TREND PRO 是一个趋势指标,可以自动分析市场并提供有关趋势及其每次变化的信息,并给出进入交易的信号而无需重新绘制! 该指标使用每根蜡烛,分别对其进行分析。指不同的脉冲——向上或向下脉冲。货币、加密货币、金属、股票、指数交易的准确切入点! MT5版本                 指标的完整描述   我们建议将其与 指示器 -   RFI LEVELS 一起使用 主要功能: 准确的输入信号,无需渲染! 如果出现信号,它仍然相关!这是与重提指标的一个重要区别,重提指标可以提供信号然后改变信号,这可能导致存款资金的损失。现在您可以以更高的概率和准确度进入市场。还有一个功能是在箭头出现后为蜡烛着色,直到达到目标(止盈)或出现反转信号。 显示止损/获利区域 为了提高搜索切入点时的视觉清晰度,创建了一个模块,该模块最初显示买入/卖出区域,在该区域中搜索进入市场的最佳点。用于处理止损水平的附加智能逻辑有助于随着时间的推移减小其大小,从而降低进入交易(移动 sl)时的初始风险。 显示较高时间范围内的最小值/最大值(MTF 模式) 添加了一项功能,可以显示较高时间间隔的最小
- Real price is 80$ - 40% Discount ( It is 49$ now ) Contact me for instruction, any questions! Introduction The breakout and retest strategy is traded support and resistance levels. it involves price breaking through a previous level.  The break and retest strategy is designed to help traders do two main things, the first is to avoid false breakouts. Many false breakouts start with a candlestick that breaks out of a level but ends with an immediate candlestick that brings the price back into t
Currency Strength Wizard
Oleg Rodin
4.91 (35)
货币强度向导是一个非常强大的指标,为您提供成功交易的一体化解决方案。该指标使用多个时间范围内所有货币的数据来计算这个或那个外汇对的力量。此数据以易于使用的货币指数和货币电力线的形式表示,您可以使用它们来查看这种或那种货币的力量。 您所需要的只是将指标附加到您要交易的图表上,该指标将向您显示您交易的货币的真实强度。该指标还向您显示买卖量压力的极值,您可以在顺势交易时利用这些压力。该指标还显示了基于斐波那契的可能目标。该指标可用于各种交易时间范围。该指标支持各种货币对的交易。 该指标为您提供所有类型的警报,包括推送通知。 购买后请联系我。我将与您分享我的交易技巧,并免费为您提供丰厚的红利指标! 祝您交易愉快,获利丰厚!
TPSpro RFI Levels
Roman Podpora
4.8 (20)
Advanced Currency IMPULSE with ALERT
Bernhard Schweigert
4.9 (455)
目前31%的折扣!! 对任何新手或专家交易者来说都是最好的解决方案! 这个指标是一个独特的、高质量的、负担得起的交易工具,因为我们已经纳入了一些专有的功能和一个秘密的公式。只需一张图表,它就能给出所有28种货币对的警报。想象一下,你的交易将如何改善,因为你能够准确地确定新趋势或剥头皮机会的触发点 建立在新的基础算法上,它使识别和确认潜在交易变得更加容易。这是因为它以图形方式显示了一种货币的强势或弱势是否正在加速,并测量了这种加速的速度--把它想象成你汽车中的速度表。当你加速时,事情显然会发生得更快,这在外汇市场上也是一样的,即如果你配对的货币正在向相反的方向加速,你就会发现一个潜在的有利可图的交易。 货币动量的垂直线和箭头将指导你的交易! 动态的市场斐波那契23水平被用作警报触发器,将适应市场活动。如果冲动触及黄色触发线,您将在MetaTrader或您的电子邮件或推送警报中收到警报。然后你就知道作为一个交易员应该做什么。货币对和方向已经给出。只要点击警报按钮,就可以切换到该货币对或打开一个新的图表,以便进一步分析。警报级别可以通过用户输入来改变,可以选择3个敏感度级别
RelicusRoad Pro
Relicus LLC
4.54 (80)
现在$ 147(更新后增加到$ 499) - 无限帐户(PC或Mac) RelicusRoad 用户手册 + 培训视频 + 访问 Private Discord Group + VIP 身份 一种看待市场的新方式 RelicusRoad 是世界上最强大的外汇、期货、加密货币、股票和指数交易指标,为交易者提供保持盈利所需的所有信息和工具。我们提供技术分析和交易计划,帮助每一位交易者取得成功,从初学者到高级。它是一个关键的交易指标,可以提供足够的信息来预测未来的市场。我们相信一个完整的解决方案,而不是图表上几个没有意义的不同指标。这是一个多合一指标,显示无与伦比且非常准确的信号、箭头 + 价格行为信息。 RelicusRoad 基于强大的人工智能,提供缺失的信息和工具来教育您并使您成为交易专家,成为成功的交易者。 几乎所有技术指标都滞后,这意味着它们只能报告已经发生的事情。因此,他们只确认您过去可以看到的价格已经在哪里。我们相信领先指标可以预测未来价格,而无需重新绘制,也不要过度依赖可能改变并导致重新绘制的滞后指标。如果您根据滞后指标进行交易并建立头寸,您就知道您已
目前八折优惠! 对任何新手或专家交易者来说都是最好的解决方案! 这个仪表板软件适用于28种货币对。它基于我们的两个主要指标(高级货币强度28和高级货币冲动)。它对整个外汇市场提供了一个伟大的概述。它显示高级货币强度值,货币运动速度和28个外汇对在所有(9)时间段的信号。想象一下,当你可以使用图表上的单一指标观察整个市场,以确定趋势和或剥头皮的机会时,你的交易将得到改善 我们已经在这个指标中建立了一些功能,使你更容易识别强势和弱势货币,同时识别和确认潜在的交易。该指标以图形方式显示货币的强势或弱势是增加还是减少,以及它在所有时间段的表现。 增加的新功能是动态市场斐波那契水平,它适应当前的市场条件变化,这是一个已经在我们的高级货币强度28和高级货币冲动指标中使用的成熟的加分项。 在交易时,总是将弱势货币和强势货币配对,这个新指标将帮助你做到这一点。 用户手册:点击这里  https://www.mql5.com/en/blogs/post/708783 特点  显示每个时间段的ACS28和GAP-speed(冲动)的货币强度值。 列:颜色代码以7种颜色
Advanced Currency Strength28 Indicator
Bernhard Schweigert
4.91 (607)
目前26%的折扣 任何新手或专家交易者的最佳解决方案! 这个指标是一个独特的、高质量的、可负担得起的交易工具,因为我们纳入了一些专有的功能和一个新的公式。只需一个图表,你就可以读出28个外汇对的货币强度!想象一下,你的交易将如何得到改善,因为你的交易是在你的手中进行的。想象一下,你的交易将如何改善,因为你能够准确地确定新趋势或剥头皮机会的触发点? 用户手册:点击这里  https://www.mql5.com/en/blogs/post/697384 这是第一本,原版的! 不要买一个毫无价值的崇拜者的克隆品。 特别的 子窗口中的箭头显示强劲的货币势头GAP将指导你的交易! 当基础货币或报价货币处于超卖/超买区域(外盘斐波那契水平)时,在个人图表的主窗口中出现警告信号。 当货币力量从外围区间回落时,回撤/反转警报。 十字星模式的特别警报 可选择多个时间框架,以快速查看趋势! 货币强度线在所有的时间框架中都非常平稳,当使用较高的时间框架来识别总体趋势,然后使用较短的时间框架来确定精确的入口时,效果非常好。你可以根据自己的意愿选择任何时间框架。每个时间框架都由其自身进
Trend Screener
STE S.S.COMPANY
4.79 (81)
趋势指标,趋势交易和过滤的突破性独特解决方案,所有重要趋势功能都内置在一个工具中! 它是 100% 非重绘多时间框架和多货币指标,可用于所有符号/工具:外汇、商品、加密货币、指数、股票。 趋势筛选器是有效的指标趋势跟踪指标,它在图表中提供带有点的箭头趋势信号。 趋势分析器指标中可用的功能: 1.趋势扫描仪。 2. 具有最大利润分析的趋势线。 3.趋势货币强度计。 4. 带有警报的趋势反转点。 5. 带有警报的强趋势点。 6. 趋势箭头 每日分析示例,每日信号表现...等与我们的趋势筛选指标,可以在这里找到: 点击这里 限时优惠:Trend Screener Indicator 仅售 50 美元且终身可用。原价 125$) 通过访问我们的 MQL5 博客,您可以找到我们所有的高级指标以及分析示例、每日信号表现...等。 : 点击这里 我们的趋势系统由 2 个指标组成: 1. Trend Screener Indicator:显示趋势仪表盘、图表中的趋势线、入场点...等。 2. Trend Line Map Indicator:显示买卖作为仪表板,活动信号盈利/亏损
Clear Breakout
Martin Alejandro Bamonte
"Breakout Buy-Sell" 指标旨在根据不同市场交易时段(东京、伦敦和纽约)的价格突破,识别并突出潜在的买卖机会。该指标帮助交易者清晰地可视化买卖区域,以及止盈(TP)和止损(SL)水平。 使用策略 该指标可以按以下方式使用: 初始设置 :选择交易时段并调整 GMT 偏移。 市场可视化 :观察每个交易时段开始时绘制的突破箱。这些箱子表示该期间的最高点和最低点。 买卖信号 :价格突破箱子的最高点被认为是买入信号。价格突破最低点被认为是卖出信号。 风险管理 :使用 TP1、TP2、TP3 和 SL 水平来管理头寸。TP 水平设计用于不同的利润目标,而 SL 确保对不利走势的保护。 应用策略 为了最大限度地利用此指标,建议采用以下策略: 伦敦时段 :选择伦敦时段,并根据您的经纪商位置调整 GMT 偏移。 目标设置 :根据当前市场波动性定义 TP 和 SL,或允许每个货币对的特定建议。 主动监控 :观察突破箱,等待市场条件下的买入或卖出信号。 警报管理 :设置警报,当价格达到关键水平时通知您,这样就不需要不断监控图表。 外部参数说明 Margin :在突破水平上添加的点数空间,以建
Gold Channel XAUUSD
Paulo Rocha
5 (2)
Gold Channel is a volatility-based indicator, developed with a specific timing algorithm for the XAUUSD pair, which consists of finding possible corrections in the market. This indicator shows two outer lines, an inner line (retracement line) and an arrow sign, where the theory of the channel is to help identify overbought and oversold conditions in the market. The market price will generally fall between the boundaries of the channel. If prices touch or move outside the channel it is a tra
Quantum Trend Sniper Indicator MT4
Bogdan Ion Puscasu
4.58 (31)
介绍   量子趋势狙击指标 ,突破性的 MQL5 指标,正在改变您识别和交易趋势反转的方式!由拥有超过13年交易经验的资深交易员团队开发,     量子趋势狙击指标   旨在通过其创新的方式以极高的准确度识别趋势反转,将您的交易之旅推向新的高度。 ***购买量子趋势狙击指标,即可免费获得量子突破指标!*** 当量子突破指标识别出趋势反转时,它会向您发出警报和信号箭头,并建议您三个止盈水平。 它既适合新手交易者,也适合专业交易者。 量子 EA 通道:       点击这里 MT5版本:       点击这里 建议: 时间范围:  所有时间范围。为了获得最佳结果,我们建议在 M15、M30 和 H1 时间范围内使用它。 货币对:欧元兑美元、英镑兑美元、澳元兑美元、欧元兑英镑, EURAUD, XAUUSD 账户类型:ECN、Raw 或 Razor,点差极低 经纪时间:任意 经纪商:IC Markets、Pepperstone with Raw 和 Razor 的点差最低 建议止损:50 点 建议止盈水平:20 点、50 点和 1
Market Reversal Alerts
LEE SAMSON
4.19 (108)
成為突破者,隨著價格反轉,市場結構會改變利潤。 訂單突破者指示器可以識別趨勢或價格走勢何時接近枯竭並準備好逆轉。它會提醒您市場結構的變化,通常會在發生逆轉或重大回調時發生。 該指標使用專有計算來確定突破和價格動能。每當在可能的耗盡點附近形成新的高點時,指標就會繪製最後一個生成該高點的順序塊。然後,它將隨價格移動隨價格跟隨定單。然後,當價格轉向相反方向並突破該訂單塊時,它會提醒您,從而創建新的市場結構並開始趨勢或重大回調的可能逆轉。 訂單塊是在創建高/低之前的最後一個相反的彩色蠟燭,並且當價格跌破這些關鍵區域以下時,這表明趨勢可能會發生短期或長期反轉。 特徵 提醒您關鍵耗盡點的市場結構變化 價格接近耗盡水平時自動提取訂單塊 在一個方向繼續移動時,在價格後面跟踪定單,以提醒您最佳的反轉輸入 將顏色更改為純色塊,以顯示何時發生市場結構中斷。 適用於所有交易品種和時間範圍 內置集成的彈出窗口和電子郵件警報 策略和如何與定單破壞者指標進行交易 當斷路器塊發生時,您有兩個選擇。 看左邊!我們正在尋求供應/需求或支撐/阻力位嗎?市場結構轉變(逆轉)通常發生在價格重新測試舊水平或
PRO Renko System
Oleg Rodin
5 (23)
PRO Renko Arrow Based System for trading renko charts.  准确的信号交易任何外汇工具. 另外,我将免费提供系统的附加模块! PRO Renko系统是RENKO图表上高度准确的交易系统。该系统是通用的。 该交易系统可应用于各种交易工具。 该系统有效地中和了所谓的市场噪音,打开了获得准确反转信号的通道。 该指标易于使用,只有一个参数负责产生信号。 您可以很容易地使算法适应您感兴趣的交易工具和renko酒吧的大小。 我很乐意通过提供任何咨询支持来帮助所有客户有效地使用该指标。 祝您交易成功!购买后,立即写信给我! 我将与您分享我的建议和我的renko发电机。 另外,我将免费提供系统的附加模块!
`All in One Chart Patterns` 图表形态在交易者之间是一个有争议的话题;有些人认为它们是可靠的信号,而另一些人则不这样认为。我们的“Chart Patterns All-in-One”指标显示了各种图表形态,让您可以自行测试这些理论。这些形态的盈利能力并不反映指标的有效性,而是对形态本身的评估。“Chart Patterns All-in-One”指标是可视化这些形态的绝佳工具,让您能够对它们在您的交易策略中的有效性得出自己的结论。 该指标将多个图表模式组合成一个统一的工具,用于MetaTrader 4 (MT4)。它提供了直接从图表上开启或关闭每个模式的功能,使分析更加高效和可定制。以下是该指标和包含的模式的详细描述: #### 包含的模式: 1. **模式 1-2-3**    - **描述**:该模式用于识别市场中的潜在反转点。它寻找三个点(高点或低点)的序列,标志着趋势的变化。    - **信号**:       - 买入信号:当有两个连续的低点,第二个低点高于第一个低点,随后是一个低于前一个高点的高点时形成。      - 卖出信号:当
ICT, SMC, SMART MONEY CONCEPTS, SMART MONEY, Smart Money Concept, Support and Resistance, Trend Analysis, Price Action, Market Structure, Order Blocks, BOS/CHoCH,   Breaker Blocks ,  Momentum Shift,   Supply&Demand Zone/Order Blocks , Strong Imbalance, HH/LL/HL/LH,    Fair Value Gap, FVG,  Premium  &   Discount   Zones, Fibonacci Retracement, OTE, Buy Side Liquidity, Sell Side Liquidity, BSL/SSL Taken, Equal Highs & Lows, MTF Dashboard, Multiple Time Frame, BigBar, HTF OB, HTF Market Structure, 
NAM Order Blocks
NAM TECH GROUP, CORP.
5 (1)
MT4多時限訂單塊檢測指示器。 特徵 -在圖表控制面板上完全可自定義,提供完整的交互。 -隨時隨地隱藏和顯示控制面板。 -在多個時間範圍內檢測OB。 -選擇要顯示的OB數量。 -不同的OB用戶界面。 -OB上的不同過濾器。 -OB接近警報。 -ADR高低線。 -通知服務(屏幕警報|推送通知)。 概括 訂單塊是一種市場行為,它指示從金融機構和銀行收取訂單。著名的金融機構和中央銀行帶動了外匯市場。因此,交易者必須知道他們在市場上正在做什麼。當市場建立訂單塊時,它會像發生大多數投資決策的範圍一樣移動。 訂單建立完成後,市場將朝著上升和縮小的方向發展。訂單大宗交易策略的關鍵術語是它包括機構交易者正在做的事情。由於它們是主要的價格驅動因素,因此包括機構交易在內的任何策略都可以。 您將在任何時間範圍內實時看到訂單塊,使用我們的控制面板,您將能夠在所選的歷史記錄週期內檢測常規,拒收和未大寫的訂單塊。 現在您可以接收到訂單塊接近警報,我們在MT4上顯示屏幕通知,並將通知推送到您的手機!
Order Block Hunter
Noha Mohamed Fathy Younes Badr
5 (1)
Order block hunter indicator is the best indicator for  hunt the order blocks that area where there has been a large concentration of limit orders waiting to be executed Order blocks are identified on a chart by observing previous price action and looking for areas where the price experienced significant movement or sudden changes in direction .This indicator does that for you by using very complicated codes and helps you to take the best areas To buy and sell because it make marks at the best a
Scalper Vault
Oleg Rodin
5 (22)
Scalper Vault 是一个专业的剥头皮系统,为您提供成功剥头皮所需的一切。该指标是一个完整的交易系统,可供外汇和二元期权交易者使用。推荐的时间范围是 M5。 该系统为您提供趋势方向的准确箭头信号。它还为您提供顶部和底部信号以及江恩市场水平。无论您拥有何种交易经验,该系统都易于使用。您只需要遵循简单的规则并每天重复该过程。 建议将此系统用于主要货币对。感谢您的关注! 请注意,该指标在策略测试器中可能无法正常工作。因此,我建议仅在模拟或真实账户的真实交易条件下使用该系统。 指示器提供所有类型的警报,包括推送通知。 购买指标后请与我联系。我将免费与您分享我的个人交易建议和出色的奖励指标! 祝您交易愉快,盈利!
M1 Arrow
Oleg Rodin
4.67 (12)
M1 Arrow - 基于市场的两个基本原则的盘中策略。 该算法基于使用附加过滤器对交易量和价格波动的分析。该指标的智能算法仅在两个市场因素合二为一时才会发出信号。该指标使用较高时间框架的数据计算 M1 图表上某个范围的波浪。为了确认波浪,该指标使用了成交量分析。 从理论上讲,该指标可以与其他时间框架一起使用,但您需要考虑到该指标最初是为在 M1 上交易而开发的这一事实。 该指标是一个现成的交易系统。交易者所需要的只是跟随信号。此外,该指标可以成为您自己的交易系统的基础。交易仅在分钟图表上进行。 尽管指标使用 MTF 原理,但指标算法尽可能稳定。 购买后,一定要写信给我!我将与您分享我的交易设置和建议!祝您交易成功!感谢您的关注!
Advanced Supply Demand
Bernhard Schweigert
4.9 (271)
现在优惠 33%! 任何新手或专业交易者的最佳解决方案! 该指标是一款独特、高质量、且价格合理的交易工具,因为我们已经整合了许多专有功能和新公式。 依据此更新,您将能够显示双重时间帧区域。 您不仅可以显示一个较高的时间帧,还可以同时显示图表时间帧,加上更高的时间帧:显示嵌套时区。 供需双方所有交易者都会喜欢它。 :) 重要信息披露 高级供需的最大潜力,请访问 https://www.mql5.com/zh/blogs/post/720245   想象您的交易如何得以改善,是因为您能够精准定位入场或目标位吗? 构建于新的底层算法,它可以更轻松地识别出买卖双方之间的潜在失衡。 这是因为它以图形方式展示供需最强劲区域,及其过去的表现(显示旧区域)。 这些功能旨在帮助您更轻松地发现最佳入场区域和价位。 现在您可以针对您的交易品种和时间帧来优化和编辑区域强度! 高级供需指标适用于所有产品和时间帧。 它是一个新的公式,非常新的功能是两个区域强度函数可由用户输入进行调整! 这在交易中是一大优势。 当您学习如何使用专有功能,例如带有价格游离最小 X 因子的区域强度时,您能够判断该区域强劲与否。 供
自动在你的图表上画出支撑位和阻力位以及推动性蜡烛缺口,这样你就可以看到价格接下来可能会走向哪里和/或可能会逆转。 该指标旨在作为我的网站(The Market Structure Trader)上教授的头寸交易方法的一部分,并显示目标和潜在入场的关键信息。 该指标有两个核心功能和四个附加功能: 核心功能1 - 日线、周线和月线的自动支持和阻力线 该指标为你自动绘制过去2天以及6周和数月前的最新支撑和阻力水平。你可以完全自定义这些水平的外观以适合你,并显示多少个。这些关键水平通常作为主要的支持和阻力区,价格将从这里转向并回撤或逆转。它们也是价格将走向的目标,因此你可以迅速看到在价格可能转向之前交易的潜在距离。 核心特征2--推进型蜡烛缺口目标 推进性缺口蜡烛是银行和机构通过在任何市场上执行大额头寸而创造的强劲、快速的移动。这些大阳线一旦形成,有两个关键作用。 1. 1.它们作为一个方向性信号,因为大型市场参与者已经选择了一个方向,一旦发生,价格往往会在一段时间内继续移动。 2. 2.更重要的是,它们作为目标,因为这些区域往往会让其他大玩家的头寸 "越位",价格在绝大
作者的更多信息
Moon Phase
Sergio D. Rocha
5 (1)
Gann and other analyst had found a curious correlations between moon phases and change in trends, this is an excellent indicator to test those relation and use what you find useful. It's very simplistic, can calculate the moon phases using the average moon cycle duration of 29 days 12 hours 44 minutes since the 1970 first full moon registered at January 22nd. You can also place a known full moon's date, to start the count since the daily opening of that date. In its window will plot a vertical l
这是已发布产品 埃洛特波浪工具 7 步骤 的删节演示版。 与埃洛特波浪工具 7 步骤相比的限制如下: 只可能有一个账户,原版工具有一个主账户和四个轮换账户。 只有一级 (首要) 可用,在原版工具里根据您的性格有不同的12 级(微账户里有 6 级)。 由于只有一级可用,则选择的波浪升级和降级功能被禁用。 固定颜色计数, 在原版工具里信可以设置主要和轮换计数的颜色。 每个结构只有第一波可以标记,一旦第一波结构被释放,复选按钮将删除实际结构,开始一个新的。 帮助屏幕提醒您结构的关键点 (脉动,对角线,三角形,横盘等) 被禁用,在原版工具里,当按下 "?" 按钮,将显示实际结构的关键点简介。 所有其余选项保留。 这个视频针对原版工具 https://www.youtube.com/watch?v=0uMhTtUVsmo , 所有功能同样调用。与轻量版中的仅有不同是按钮被限制,无动作或不出现。
FREE
This is a technical indicator that works as a plug-in for "Control adora" - the Expert Advisor that helps you to calculate, place and control positions on the chart. When run on a chart with Control adora EA, this plug-in allows setting entry levels that send orders at contact, while you have StopCloseOnly (OCO in Comments) = 1 settled in Control adora (meaning that without this, the indicator will send the order only when the price Close crosses the arrow level). This indicator only works if yo
FREE
LevelsGrid
Sergio D. Rocha
This is a simple script that places a defined number of lines above and below a given price.  The script lets you set the number of lines, the separation in pips and the color.   Instructions: Drop the script on a chart to draw the level lines  If the last parameter is set to false, the script will delete the lines previously placed by it.  Parameters:  English? Turn it yes to use English language, false will turn language to Spanish  Separation Set the pips distance among lines  From Price
FREE
DollarAndEuroIndex
Sergio D. Rocha
5 (2)
This is an extension of the previous published DollarIndex with the addition of the function for calculating EURO Index under ICE Formula. Note that the broker should provide the following data: For Dollar Index formula, EURUSD, USDJPY, GBPUSD, USDCAD, USDSEK and USDCHF are needed. For Euro Index formula, EURUSD, EURGBP, EURSEK and EURCHF are needed. Now in this version if the SEK (the most uncommon) is not provided, the formula still works, since it adds 0.0001 to its value, but the index will
FREE
This is a system consistent of 2 components: RepliTrades Source: It sends the trades to one or more terminals into the same Computer RepliTrades Trader: It trades the orders sent by RepliTrades Source  Please watch the video to learn how it works and use it. Features: Manage up to 300 trades at same time in each terminal Work with any broker, no matter if uses suffix or prefix in symbols names Replicate pending orders (limits or stops orders) or direct trades (market orders, etc) and its modif
FREE
Trailing Even is a free complement for the Control adora Expert Adviser. It adds a trailing stop function and changes the exit level that works as stop loss if some price is reached, let's review how to make it work: First of all make sure you have the same language selected both in the Control adora Expert and in this indicator.  Change of the exit level that works as stop loss with "BES" and "BEO": This function needs 2 arrows to work: 1 named BES (stands for Break Even Start) place it at the
FREE
Delete All
Sergio D. Rocha
This is a very silly script but perhaps you find it useful. It deletes all objects from the chart. I recommend setting a hot key to call it just by pressing a couple of keys on your keyboard.  To avoid accidental deletion of object, the script will ask you to confirm the action as you won't be available to restore them with "undo" (Ctrl+Z).
FREE
This is a very simple indicator that mixes the Sunday session with the Monday one. This is useful because the Sunday session is a partial session mostly with only Australian and Asian sessions included, so the analysis of the Monday's daily session if mixed with Sunday tends to be more comprehensive. This indicator plots a candle with the following values: Open - the Friday's Close or Sunday's Open (depending on your choice). High - the highest High of Sunday and Monday. Low - the lowest Low of
FREE
AllHere is a plug-in for Control-adora that works as information panel. Its main function is to show you all the Control-adora elements placed in the chart, like the Control-adora's orders or the exit lines. On the lower left corner, AllHere shows a collection of buttons classified by color (you can set them in the indicator's properties) for several elements used in Control-adora system: Stop loss indications (stop loss Arrows) Exit lines Above (Above trend lines) Exit lines Below (Below trend
FREE
Dollar Index
Sergio D. Rocha
4.33 (3)
This indicator calculates directly the value of the dollar index by using the ICE formula to plot the chart, this can help you as reference. You do not need your broker to provide the ICE DX to use this indicator, is a way to have it calculated. Little discrepancies could be found in the exact value of the candles or time due closing time of the trading floor and the use of decimals, but generally will give you good reference.  You need your broker offers the feed for the following pairs in orde
FREE
"TradeALot" is a plug-in for the Expert Advisor Control-adora . It allow you to place programmed orders without the need to write the name of the order in the Arrow (like bs, ss, bl, sl, sl1, sl2, etc). Just drag and drop the button for "Programmed Buys" or "Programmed Sells" over the candles-zone at the place where you want to program the order and TradeALot will compare the bid price with the position where you dropped the button and will decide if the order need to be "Stop" or "Limit". With
FREE
This is a technical indicator that put on strategy tester the buttons of the expert adviser "Control adora". Usually when applied the controladora to the strategy tester, the buttons do not appear and therefore its functions (like directly buy, sell, close orders or place stop loss indicator) can't be used. But now you can if have the Manual Backtest indicator. If you don't have Control adora, you can get it from here . This indicator get on the chart the buttons that can be of use in strategy t
FREE
CorExTi is a tool that will save you literally hours in your daily routine to draw lines and other graphic elements in your charts.   With a temporary panel discreetly displayed on your screen at the touch of a graphic element as trendline:  Changes the object between 4 favorite line styles (with color, line thickness and style)  Cuts trendlines, when are extended, just at the point where you touch them Extends trendlines (active property of Ray) which are not extended  Or deactivates visualizat
RotaGrafico
Sergio D. Rocha
The best way to monitor multiple pairs within little workspace. RotaGrafico sequentially displays up to 6 different pairs. It has buttons to set a pair more time for observation. Normal exposure time adjustable. Broad exposure time adjustable. Combine in a profile, Rotagrafico and use the rest of your workspace to the pair that you want to analyze in detail.
Object Copier
Sergio D. Rocha
5 (2)
Did you have to start again the very same analysis because the original one, from where you want to modify, just have so much information that no longer fits? Have you ever wanted to change some in one of your charts and make this new line, Fibo or channel automatically appear in some or the rest of your set of charts? Object Copier is the solution to replicate any object into one or several charts at your desire. No matter if you changed an object, or made it from the scratch. With Object Copie
Control adora
Sergio D. Rocha
4.2 (5)
Controladora 在西班牙语中意为控制器, 这是一款简单而强大的 EA, 可令您轻松、精确地控制您的交易。 您是否希望在价格穿越趋势线时终止您的交易?不要担忧, Controladora 能够做到。您是否希望在价格到达通道顶端时止盈?Controladora 能够做到。 按照您帐户的确切比例计算开单, 其大小代表亏损时占您余额的百分比, 如果您正在剥头皮, 进行这种计算时间昂贵且几乎不可能对您有帮助。利用 Controladora 则无此问题, 使用标准止损点数或您希望的的一个固定值。 当您希望评价一个交易信号, Controladora 通过显示级别帮助您查看是否风险盈利与您的策略标准相匹配, 在何处您需要离场来兑现风险回报。 您是否希望将一笔交易自动划分为多个止盈价位?利用 Controladora 这没问题, 它可以放置每笔交易作为完整操作或划分为若干笔小交易。 您是否只用收盘价停止 (意即只在蜡烛高于或低于给定的级别时才开、平仓), Controladora 能够做到。 利用 Controladora 您可以通过点击买入和卖出按钮直接开单, 但您也可以将停止程序化并利用
Fibo Pro
Sergio D. Rocha
5 (2)
When you combine short term fibos with the long term, your chart get missed up with a lot of lines that hardly make sense at first view. The best way to improve the clearness and there for the easiness to read your chart is by deleting the fibo levels that you no longer need, for example those levels that the price proved didn’t work as support or resistance. With Fibo Pro, you can activate or deactivate from a set of fibo levels pre-settled by you, without miss with the default fibo configurati
FHDrawer
Sergio D. Rocha
4 (1)
Free Hand Drawer is a small app that runs as technical indicator and the only thing that does is that it draws continuous line. To activate it, after adding the indicator to the chart just press the D on your keyboard and click where you want to start drawing. Then every click you make on your chart will be the next nod in your drawing. Use it to draft Elliott waves, or to illustrate ideas on your chart. If you like to draw manually your Gann line you’ll find it handy as well. Each time you want
BreakEven
Sergio D. Rocha
BreakEven shows the location of the average price level of the orders in the symbol, to which the indicator is attached. This information allows you to find the break-even. The indicator is helpful if you manage several positions, since it allows you to evaluate the performance of your open trades in a glance. If you trade a single order, it allows you to evaluate the effect of your stop loss and the profit or loss during the time your trade is open. Apart from drawing a break-even level line (w
Gann Line
Sergio D. Rocha
Gann Line indicator is usually used in combination with other Gann’s techniques, some say this is a key point in its success. The Gann line is interpreted as trend indicator, a series of higher highs and higher lows in it's trend are considered bullish, and a series of lower lows and lower highs are bearish. As with other technical indicators, for better results Gann Line should be used in combination with other technical concepts as Gann Fan, fibo, swings, supports and resistance, etc. When rev
RepliTrades Trader
Sergio D. Rocha
1 (1)
This is a system consistent of 2 components: RepliTrades Source: It sends the trades to one or more terminals into the same Computer RepliTrades Trader: It trades the orders sent by RepliTrades Source   Please watch the video to learn how it works and use it. Features: Manage up to 300 trades at same time in each terminal. Work with any broker, no matter if uses suffix or prefix in symbols names. Replicate pending orders (limits or stops orders) or direct trades (market orders, etc) and its mo
The indicator that helps you by plotting a reference to easily determine if a scalping trade (or intraday trade) has chances to work out in your favor. One of the most common issues intraday traders have is the lost of reference to know if a movement is big or small due to the scaling of the chart. With this indicator, you have 3 visual aids on your chart that will help you: "Screener" : Please set the normal stop loss size that you usually apply in your strategy. This will plot a rectangle afte
Pointer Sync
Sergio D. Rocha
3.75 (4)
This indicator plots a crosshair pointer in all charts of the terminal in the position relative to the active chart. To activate the Pointer Sync, just press the "+" button that will appear in one of the 4 corners of the chart where the indicator is added. To deactivate the Pointer Sync, just press the "+" button again. Once Pointer Sync is deactivated, the cross lines will disappear in all charts as well. You can adjust the color of the pointers and the button, the corner where the button appea
Boundaries
Sergio D. Rocha
This indicator plots a line that shows the high and low of a higher time frame than the one where you have actually in your chart. For example if you want to see the high and low of the day while you are in 1hour chart, set Boundaries to Daily. Boundaries have predefined Monthly, Weekly, Daily and Hourly time frames, but if you want to use a different timeframe, just choose the option Other_TF and write on the next field the minutes for your desired timeframe. As MT4 only works beyond M1 with 5,
Boundaries Weekly
Sergio D. Rocha
This indicator works exactly the same as the Boundaries indicator, but here as a free demo that only shows the high and low of the week. As the Boundaries indicator does, this indicator can work with any symbol. In the Colors tab you can set the color for the Upper and Lower boundaries. Please review the pics or watch the Boundaries indicator video to better understand how it works.
AntiCursing
Sergio D. Rocha
Having a trade about to reach its take profit and suddenly see that it turns around to go strait ahead to your Stop Loss is one of the few things that makes me curse (a lot). This is why I created AntiCurse. Just add this Expert Advisor to an empty chart, set a "Trigger" and "Lock" in its properties and you'll have one less reason to curse! AntiCursing Settings: "Trigger" is set in percentage terms, it is the distance between the entry price and the Take Profit that needs to be covered in orde
PerfectLine
Sergio D. Rocha
5 (2)
When drawing a trend line or other objects, there is a natural deviation when you place the object from a higher time frame, and then go to watch it in a lower time frame. PerfectLine is a technical indicator that solves this problem. Once you touch a line after drawing it, Perfect Line will find the exact spot in the lower time frame available for it's position and then rectifies where it should be. Perfect Line uses a five pixels pre-established tolerance, if a difference between the line's no
The Polarized Fractal Efficiency (PFE) was introduced by Hans Hannula in 1994. The indicator was intended to quantify the efficiency of price movement and  how trendy or choppy  the recent past price action has been. This is calculated by contrasting the price traveled in the window of study  against the total accumulation of movements during the same period of time. For example: If in 10 days, an active raised from 50 to 100, by increasing it's value 5 points or dollars each session, the effici
CrossAlert
Sergio D. Rocha
Cross Alert is an all-in-one solution for oscillators' cross over and under. Cross Alert manages the levels for the cross under and cross over separately. Thanks to this you can use it to signal zero cross over (by fixing both levels, above to below, and below to above as zero) or over-bought and over-sold levels (like 70 and 30) as well.  With CrossAlert you can also avoid alerts from one kind of crosses (overs or unders), for example if you are in an uptrend perhaps you do not want to have ale
筛选:
无评论
回复评论
版本 1.10 2021.11.22
Recompiled with latest MT4 build, requested by mql5.com