Heiken Ashi Rsi Oscillator MT5
- 指标
- Noiros Tech
- 版本: 1.0
YOU CAN NOW DOWNLOAD FREE VERSIONS OF OUR PAID INDICATORS . IT'S OUR WAY OF GIVING BACK TO THE COMMUNITY !
This system is an Heiken Ashi system based on RSI calculations . The system is a free open source script originally published on TradingView by JayRogers .
We have taken the liberty of converting the pine script to Mq4 indicator . We have also added a new feature which enables to filter signals and reduces noise on the arrow signals.Background
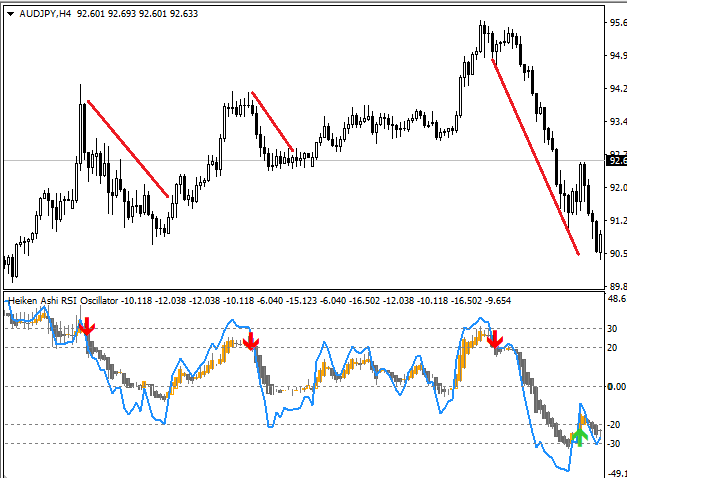
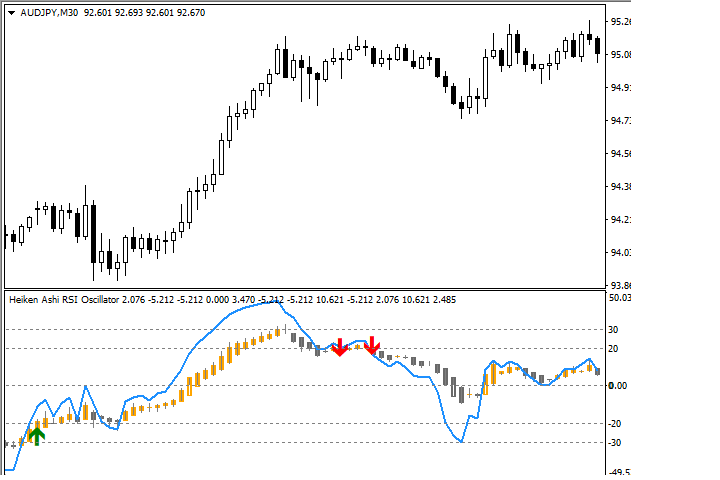
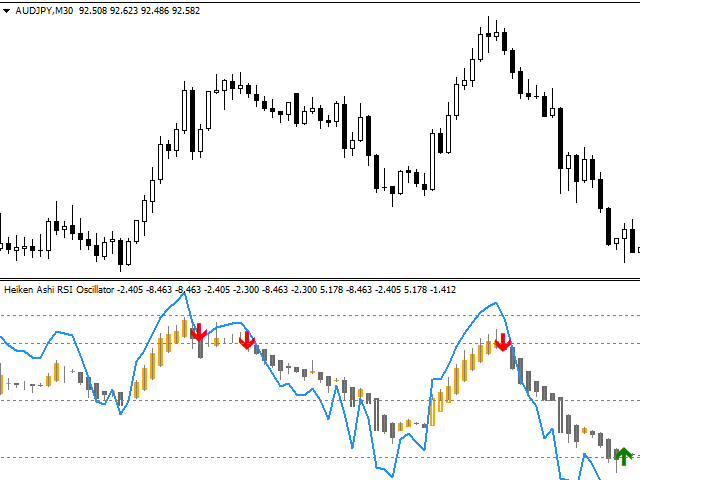
HEIKEN ASHI
The Heikin-Ashi technique is used by technical traders to identify a given trend more easily. Hollow white (or green) candles with no lower shadows are used to signal a strong uptrend, while filled black (or red) candles with no upper shadow are used to identify a strong downtrend. Because the Heikin-Ashi technique smooths price information over two periods, it makes trends, price patterns, and reversal points easier to spot.
RSI
The relative strength index (RSI) is a momentum indicator used in technical analysis. RSI measures the speed and magnitude of a security's recent price changes to evaluate overvalued or undervalued conditions in the price of that security.
---- investopedia.com
Rsi is a momentum indicator which makes it a leading indicator . Heiken Ashi smoothens out price over a period thus reducing noise and false movements in the market . Combining a momentum indicator like Rsi with Heiken Ashi makes it easier to spot leading signals that are more stable and reduces the noise that comes with using traditional Rsi indicator.
How To Use
Just like the traditional RSI ,turning points are spotted with overbought and oversold zones . Recommended overbought zones are 20 to 30 and recommended oversold zones are -20 to -30.
We Are Social
Join our Telegram Channel To get free daily signals and faster support on our products .
Also get daily trading tips , news and advice . Kindly Follow Us : Click Here

用户没有留下任何评级信息