Pivot Points Buy Zones
- 指标
- Nils R M Peleman
- 版本: 1.1
- 更新: 6 十月 2024
Detailed Description:
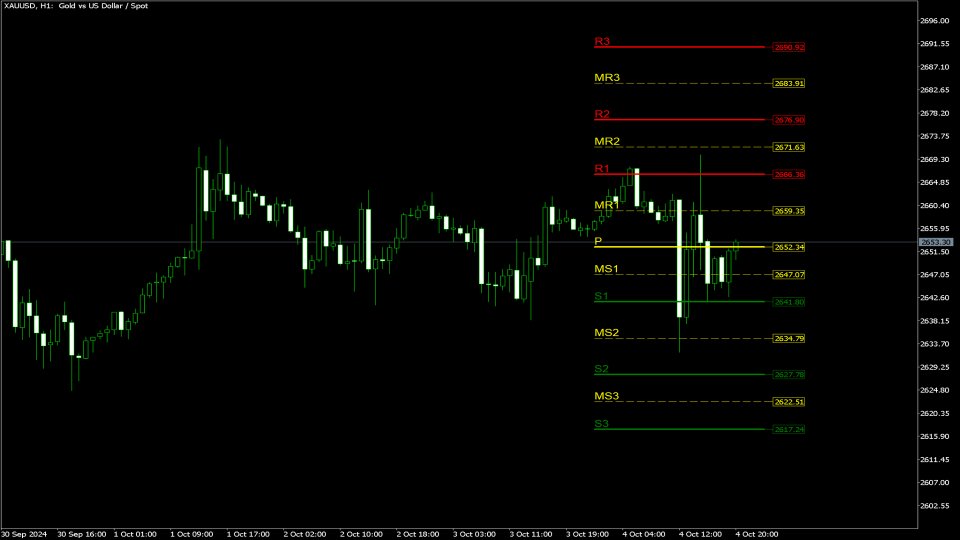
The Pivot Points Indicator is designed for traders who rely on pivot points, midpoints and support/resistance levels for their trading strategies. By automatically calculating and plotting these levels (based on the previous period's high, low, and close prices), the indicator provides a clear, visual representation of critical price areas where the market may reverse or break out.The tool is particularly useful for day traders and swing traders looking to base their trades on price levels derived from the previous day’s high, low, and close. It supports various timeframes, ensuring flexibility across different trading styles.
Key Features:
- Automatic Pivot Point Calculation: Automatically calculates pivot points, three support (S1, S2, S3) and resistance (R1, R2, R3) levels based on the previous period’s price action.
- Midpoints Calculation: Additional midpoints (MR1, MR2, MR3, MS1, MS2, MS3) are calculated for more granular levels, enhancing the trader’s ability to identify tighter buy and sell zones.
- Custom Pivot Timeframes: Users can choose the timeframe they want the pivot points to be based on.
- Visual Indicators: Each pivot point and level is drawn with colors for clear visual distinction, along with price labels on the chart (when graph shift is enabled).
Customizable Input Parameters:
- PivotTimeframe: Allows the trader to select the timeframe for pivot point calculations (default is set to daily).
Benefits:
- Clear Trade Signals: Identifies key price levels for potential reversals, helping traders plan entry and exit points with more confidence.
- Time-Saving: Automates the complex calculation of pivot points and levels, saving traders valuable time in market analysis.
- Adaptable to Any Market: Suitable for Forex, indices, commodities, and stock markets, making it a versatile tool for any trader.
- Multi-Timeframe Analysis: Pivot points and levels can be analyzed over multiple timeframes, allowing traders to adapt to different trading styles.
Recommendations:
- For intraday traders, it’s recommended to use the Daily or Hourly timeframes for pivot point calculations.
- For swing traders, using Weekly or Monthly timeframes may provide a better view of key levels for longer-term trades.
- Use the indicator in combination with other technical tools, such as moving averages or RSI, to confirm buy/sell signals for increased accuracy.
Support:
If you have any recommendations, require assistance, or have questions regarding the Pivot Points Buy Zone Indicator, please feel free to reach out! I am happy to help you make the most out of your trading tool and enhance your trading performance.
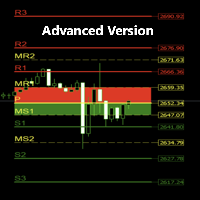
*** Advanced Version available ***
https://www.mql5.com/en/market/product/124421
Extra Advanced Key Features: - Fully Customizable Visual Elements
- Highlighted Potential Buy and Sell Zones
- Alerts and pop-up messages
- Buy set-up or Sell Set-up
- Historical Pivot Point Calculations
https://www.mql5.com/en/market/product/124421
Extra Advanced Key Features:
- Fully Customizable Visual Elements
- Highlighted Potential Buy and Sell Zones
- Alerts and pop-up messages
- Buy set-up or Sell Set-up
- Historical Pivot Point Calculations






Eduard, mil gracias! He revisado todos los indicadores gratuitos de pivot points y este es el mejor. Porque es sencillo y bastante configurable. Buen trabajo, lo recomiendo! Eduard, thank you very much! I have reviewed all the free pivot point indicators and this is the best. Because it is simple and quite configurable. Good job, I recommend it!