• 概述
  • 评论
  • 评论

Ultimate Gold Advisor For MT4

MetaTrader 4 的 Ultimate Gold Advisor

Ultimate Gold Advisor 是一个先进的技术工具,旨在优化 MetaTrader 4 上的交易体验。为了满足经验丰富的交易者的需求,该指标结合了精准度、复杂的分析和多功能性,为做出明智的交易决策提供支持。它不仅适用于黄金交易,还可用于广泛的资产类别,Ultimate Gold Advisor 能帮助你提升市场策略。

Ultimate Gold Advisor 为什么是交易者的好工具?

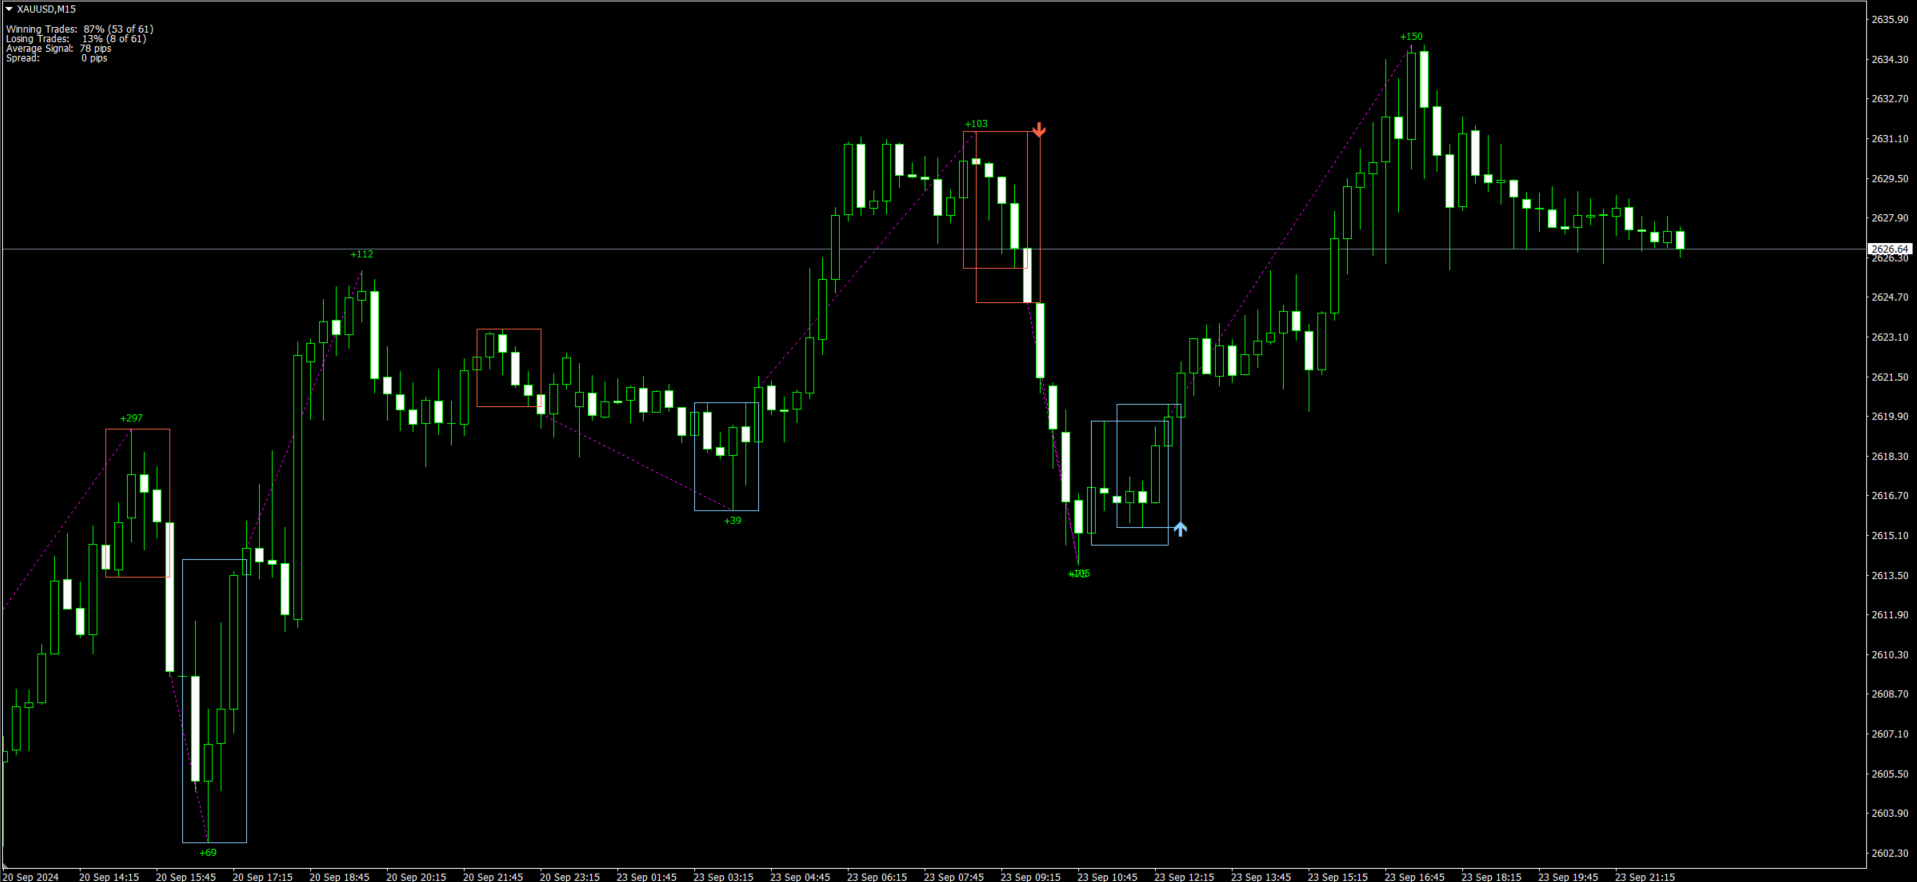
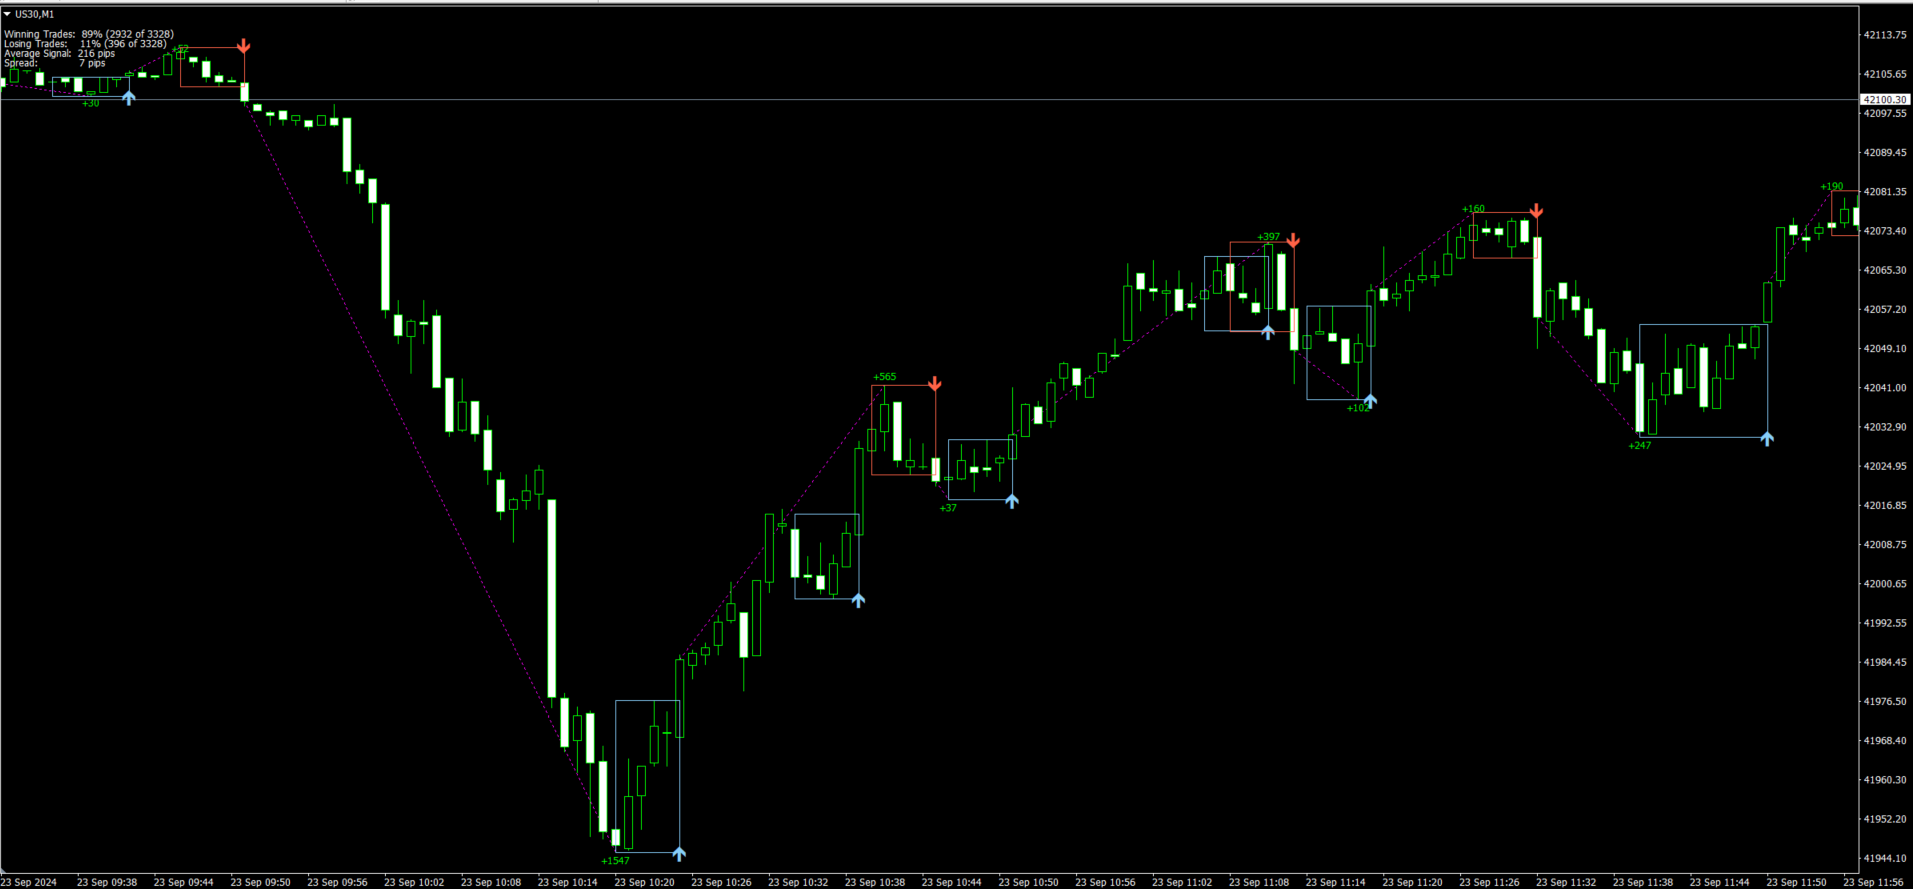
  • 先进的性能: 结合多个指标,清晰显示每笔交易的结果,你可以透明地查看策略的表现。这让你能够优化你的方法,做出更明智的决策。

  • 即时和可视的交易信号: 图表上的红色和蓝色箭头标记了潜在的买入和卖出机会。 这些视觉信号易于理解,能快速帮助你识别关键行动时刻。

  • 实时点差追踪: Ultimate Gold Advisor 以点数(pips)测量价格变动,让你能够实时评估市场变化。这有助于你更准确地计划交易,并跟踪策略的进展。

  • 趋势检测技术: 指标通过图表上的虚线跟踪主要市场趋势。 这使你能更好地理解市场波动和方向变化,基于市场动态做出更明智的决策。

  • 灵活性和适应性: 无论你交易黄金、外汇、指数还是商品,Ultimate Gold Advisor 都能在不同的环境和时间框架中发挥作用。 这种多功能性使其成为不同交易方法的有用工具。

为什么 Ultimate Gold Advisor 是你的交易中不可或缺的工具?

  • 透明分析: 它为每笔交易提供清晰的可视数据和可衡量的结果,让你持续监控策略表现。

  • 易于使用: 即使是经验较少的交易者,视觉信号也非常直观,帮助你轻松做出明智的决策。

  • 易于集成: 无论你使用技术分析还是基本面分析,Ultimate Gold Advisor 都能轻松融入你的交易方法,帮助你提升整体表现。

不要错过市场机会:Ultimate Gold Advisor 为你的 MetaTrader 4 提供了可靠的支持,帮助你优化交易策略。凭借其直观的界面和先进的分析能力,你可以改进策略并更有信心地交易。将其添加到你的 MetaTrader 4 平台,以充分利用市场潜力。


推荐产品
VR Cub
Vladimir Pastushak
VR Cub 这是获得高质量切入点的指标。该指标的开发是为了促进数学计算并简化对仓位入场点的搜索。多年来,该指标所针对的交易策略已被证明其有效性。交易策略的简单性是其巨大的优势,即使是新手交易者也能成功进行交易。 VR Cub 计算开仓点以及获利和止损目标水平,这显着提高了效率和易用性。查看使用以下策略进行交易的屏幕截图,了解简单的交易规则。 设置、设置文件、演示版本、说明、问题解决,可以从以下位置获取 [博客] 您可以在以下位置阅读或撰写评论 [关联] 版本为 [MetaTrader 5] 计算入场点的规则 开仓 要计算入场点,您需要将 VR Cub 工具从最后一个高点拉伸到最后一个低点。 如果第一个点在时间上早于第二个点,交易者等待柱线收于中线上方。 如果第一个点在时间上晚于第二个点,交易者等待柱线收于中线下方。 根据上述条件,严格在 柱线收盘 后建仓。 换句话说,如果我们在小时图上进行交易,那么从最高点到最低点的时间距离必须超过24小时,最高点和最低点之间的点数必须大于或等于平均价格变动每天。 维持和改变市场地位 可以有多个未平仓头寸;每个头寸都可以单独修改。 VR Cu
这是一个预测蜡烛收盘价的指标。 该指标主要用于 D1 图表。 该指标适用于传统外汇交易和二元期权交易。 该指标可以用作独立的交易系统,也可以作为您现有交易系统的补充。 该指标分析当前蜡烛,计算蜡烛本身内部的某些强度因素,以及前一根蜡烛的参数。 因此,该指标预测市场走势的进一步方向和当前蜡烛的收盘价。 由于这种方法,该指标既适用于短期盘中交易,也适用于中长期交易。 该指标允许您设置指标在分析市场情况期间将产生的潜在信号的数量。 在指标设置中有一个特殊的参数。 此外,该指标可以通过图表上的消息、电子邮件以及推送通知的形式通知新信号。感谢您的关注!交易愉快! 购买后一定要写信给我! 我会给你我的交易指标的建议! 还可以获得奖金!
This is a new strategy for SUPPLY DEMAND areas It is based on a calculation using the tick volume to detect the big price action in market for both bear /bull actions this smart volume action candles are used to determine the supply and demand areas prices in between main supply and demand lines indicate sideway market  up arrows will be shown when prices moves above the main supply and the secondary supply lines Down arrows will be shown when prices moves below the main demand and the secondary
Diamond PRO
Fanur Galamov
5 (19)
Diamond PRO is enhanced powerful version of Diamond for advanced traders. Pro version includes optimized cores, new impoved entry points filters, new multistage profit closure algorithm and сontains number of external control parameter that allows build and fine tune own tradind decisions and algorithms. The system provides more accurate market entries, analyzes and filters upcoming economic news, contains spread protection and an advanced position management algorithm. Main goal of Diamond PRO
Vizzion
Joel Protusada
Vizzion is a fully automated scalping Expert Advisor that can be run successfully using GBPJPY currency pair at H1 timeframe. Very Important This Expert Advisor can not run with any EAs in the same account. As part of the money management plan, it calculates and monitors the Margin Level % and assumes that all open trades are created by it. If you want an Expert Advisor that trades in a daily basis, this EA is not for you because using this requires a patience to wait for a few days or weeks o
Indicador Taurus All4
Fabio Oliveira Magalhaes
Taurus All4 Taurus All4 is a high-performance indicator, it will tell you the strength of the trend, and you will be able to observe the strength of the candle. Our indicator has more than 4 trend confirmations. It is very simple and easy to use. Confirmation Modes Candle Trend Confirmations: When the candle switches to light green the trend is high. When the candle switches to light red the trend is reverting down. When the candle changes to dark red the trend is low. Trendline Trend Conf
Royal Dutch Skunk
Sayan Vandenhout
ROYAL DUTCH SKUNK USES THE TREND WAVE INDICATOR AND IT CAN IDENTIFY THE BEGINNING AND THE END OF A NEW WAVE TREND MOVEMENT. AS AN OSCILLATOR, THE INDICATOR IDENTIFIES THE OVERBOUGHT AND OVERSOLD ZONES. IT WORKS GREAT TO CATCH THE SHORT TERM PRICE REVERSALS AND USES A MARTINGALE STRATEGY TO CLOSE ALL TRADES IN PROFIT. USE DEFAULT SETTINGS ON H1 OR HIGHER TIME FRAME ON ANY PAIR FOR MORE ACCURATE TRADES WHY THIS EA : Smart entries calculated by 6 great strategies The EA can be run on even a $20000
5 signal in 1  Product     TimeFrame   Recommend   1m-5m recommend  signal   TF  5m    Banks Pro Binary Option is Indicator for binary option Can Use Manaul Trade or Robot on Platform  Mt2Trading  https://www.mt2trading.com/?ref=104    Time Trading   good work  EU session    Recommend  Curency   EUR  GBP USD        careful   AUD JPY      Recommend  Martingale 2-5 Step   Recommend  set profit  2%-5%/Day Setting Brake  News Event High volatility   recommend  15-30 min Have Problem Contract
This is an arrow indicator without a future function,developed based on the most advanced profit trading algorithms.It has the most innovative and advanced dual trend analysis module, as well as the latest and highly effective market trend prediction algorithm.Trends are your friends, and following larger trends can earn the maximum profit in foreign exchange. This indicator helps traders identify current trends and track them. Someone once made a profit of 10 times in a week by relying on it.No
Trend Bilio
Ivan Simonika
Trend Bilio - an arrow indicator without redrawing shows potential market entry points in the form of arrows of the corresponding color: upward red arrows suggest opening a buy, green down arrows - selling. The entrance is supposed to be at the next bar after the pointer. The arrow indicator Trend Bilio visually "unloads" the price chart and saves time for analysis: no signal - no deal, if an opposite signal appears, then the current deal should be closed. It is Trend Bilio that is considered
Chinetti pip collector XL is a complete turnkey trading system. If a trader does not yet have his own trading system, he can apply Chinetti pip collector XL to trading. Trading with this indicator is very easy. Even a beginner in Forex can handle it. Trading rules: wait for the indicator to start drawing a blue line. This means that the price trend is starting now. Now we are waiting for the indicator to analyze the market and draw an up arrow on the chart. At this point, we open a buy order.
M5 时间框架的机器人黄牛。交易 GBPUSD 货币对。该机器人是由一家专业交易商公司专门开发的,用于英镑交易。机器人每天大约打开 5 到 15 笔交易。最好与英镑兑美元点差低至 10 点的经纪商进行交易。建议的最低存款为 500 美元或更多。 优点: 不使用鞅。 不是网。 每笔交易都有止损。 专门针对 GBPUSD 对的专业机器人。 机器人黄牛,在 M5 时段进行盘中交易。 这个机器人如何交易? 为了分析市场,机器人使用两个指标的价格模型和战略市场模式:抛物线止损和反转系统以及布林带。机器人首先使用价格内插统计分析市场的价格变动。接下来,机器人读取这些指标并比较它们现在和过去的运动趋势。如果存在表明市场反转或回滚的模式巧合,那么机器人将进行交易。机器人将根据余额大小按比例计算每笔交易的手数。交易者可以使用“Percentage_of_lots”参数调整该比例。机器人开始交易后,它开始通过修改追踪止损来伴随它。此外,每笔交易都有自己的止损,设置为限制可能的损失。 机器人规格: 时间范围(期间) M5 货币对 GBPUSD 存款 500 美元起 建议点差高达 10 点。 建
Gold Champions
Maria Julieta Frias Torres
Limited time offer for $59. Launch promotion Price will go up soon.   NO MARTINGALE!!!    LOW DD!!!   GOLD CHAMPIONS is a new EA designed through a new AI system that operates in the Forex market and is designed GOLD/XAUUSD with excellent results. Developed by a team of experienced traders with more than 10 years of trading experience. It uses a powerful algorithm to detect fluctuations in the market and make entries with a high profit ratio and limiting losses. Key Features: Integrated Str
Super Reversal Pattern
Parfait Mujinga Ndalika
Super Reversal Pattern Indicator Unlock the power of advanced pattern recognition with our Super Reversal Pattern Indicator. Designed for traders seeking precision and reliability, this indicator identifies one of the most effective reversal patterns in technical analysis, offering a significant edge in your trading strategy. Key Features: Non-Repainting Accuracy: Enjoy the confidence of non-repainting technology. Once a Super Reversal Pattern is detected, it remains static, providing consis
Diamond Trend
Segundo Calvo Munoz
Indicator which identifies Trend and also buy/sell opportunities. Use for entries aligned to the Trend.  Although Diamond Trend is very accurate identifying entry points, it is always recommended to use a support indicator in order to reconfirm the operation. Remind to look for those Assets and Timeframes which best fit to your trader behavior/need... Valid for Scalping and Long Term operations. Please, set up a Bars Chart to be able to visualize the indicator properly...  ...And remind to give
Red Hawk EA
Profalgo Limited
4.18 (17)
NEW PROMO: Only a few copies copies available at 349$ Next price: 449$ Make sure to check out our " Ultimate EA combo package " in our   promo blog ! Red Hawk is a "mean reversion" trading system, that trades during the quiet times of the market. It runs on 9 pairs currently: EURUSD, GBPUSD, USDCHF, EURCHF, EURGBP, AUCAD, AUDJPY, EURAUD and USDCAD. Recommended timeframe: M5 Since this kind of strategy works best with low spread and fast execution, I advise using an good ECN broker. IMPORTANT
CyberZingFx Volume Plus
Afsal Meerankutty
4.93 (15)
Advanced version of CyberZingFx Volume Plus, the ultimate MT4 indicator for traders seeking highly accurate buy and sell signals. With an additional strategy and price action dot signals that enhances its effectiveness, this indicator offers a superior trading experience for professionals and beginners alike. The CyberZingFx Volume Plus Advanced version combines the power of volume analysis and historical price data with an additional strategy, resulting in even more precise and reliable signals
Infinity Trend Pro
Yaroslav Varankin
1 (1)
This is a trend indicator without redrawing Developed instead of the binary options strategy (by the color of the Martingale candlestick) Also works well in forex trading When to open trades (binary options) A signal will appear in the place with a candle signaling the current candle It is recommended to open a deal for one candle of the current timeframe M1 and M5 When a blue dot appears, open a deal up When a red dot appears, open a trade down. How to open trades on Forex. When a signal is rec
Trend PA
Mikhail Nazarenko
5 (3)
The Trend PA indicator uses   Price Action   and its own filtering algorithm to determine the trend. This approach helps to accurately determine entry points and the current trend on any timeframe. The indicator uses its own algorithm for analyzing price changes and Price Action. Which gives you the advantage of recognizing, without delay, a new nascent trend with fewer false positives. Trend filtering conditions can be selected in the settings individually for your trading style. The indicator
Trendiness Index
Libertas LLC
5 (3)
"The trend is your friend" is one of the best known sayings in investing, because capturing large trendy price movements can be extremely profitable. However, trading with the trend is often easier said than done, because many indicators are based on price reversals not trends. These aren't very effective at identifying trendy periods, or predicting whether trends will continue. We developed the Trendiness Index to help address this problem by indicating the strength and direction of price trend
The principle of this indicator is very simple: detecting the trend with Moving Average, then monitoring the return point of graph by using the crossing of Stochastic Oscillator and finally predicting BUY and SELL signal with arrows, alerts and notifications. The parameters are fixed and automatically calculated on each time frame. Example: If you install indicator on EURUSD, timeframe M5: the indicator will detect the main trend with the Moving Average on this timeframe (for example the Moving
Introducing the "Magic Trades" for MetaTrader 4 – your ultimate tool for precision trading in dynamic markets. This innovative indicator revolutionizes the way you perceive market trends by harnessing the power of advanced analysis to detect subtle changes in character, paving the way for optimal trading opportunities. The Magic Trades Indicator is designed to empower traders with insightful entry points and well-defined risk management levels. Through its sophisticated algorithm, this indica
Mr Forex
Stanislav Frolov
Mr. Forex Mr Forex  EA ️️️️ Mr Forex result of more than 3 year testing strategy in market. All you need is rent VPS with low latency, i.e London base vps Pairs: EURUSD , GBPUSD , USDCHF Use Time Frame M1 - M15 ( v.1.4 and above) Set file download here(coming soon) Easy to use: 1. After installation change Time Frame to M1 ( 1 Minute ) - M15 2. Change MM to TRUE i suggest you test this EA for 1 month with demo account and when see result try Real account. After yo
PZ Penta O MT4
PZ TRADING SLU
The Penta-O is a 6-point retracement harmonacci pattern which usually precedes big market movements. Penta-O patterns can expand and repaint quite a bit. To make things easier this indicator implements a twist: it waits for a donchian breakout in the right direction before signaling the trade. The end result is an otherwise repainting indicator with a very reliable trading signal. The donchian breakout period is entered as an input. [ Installation Guide | Update Guide | Troubleshooting | FAQ | A
Signal From Level
Yaroslav Varankin
Binary Options Support Resistance Indicator This indicator is designed for binary options trading and effectively shows retracements from support and resistance levels. Signals appear on the current candle. A red arrow pointing downwards indicates a potential selling opportunity, while a blue arrow pointing upwards suggests buying opportunities. All that needs adjustment is the color of the signal arrows. It is recommended to use it on the M1-M5 timeframes as signals are frequent on these timef
Gold Phoenix
Yaroslav Varankin
The perfect tool for Scalng in the Forex markets You can trade both from signal to signal and using take profit  The algorithm does not use Zigzag!  No redrawing!  This is a channel instrument that uses a moving average as a filter. Moving Average  There are 2 parameters for the settings Ma Period = 5 period Moving Average  Channel 1.0 distance of channel lines from the chart Price Signal Filter - calculation of signal opening and filter There is a complete set of Alert There is a multi-timefram
Owl smart levels
Sergey Ermolov
4.34 (35)
MT5版本  |  FAQ Owl Smart Levels Indicator   是一個完整的交易系統,包含   Bill Williams   的高級分形、構建正確的市場波浪結構的 Valable ZigZag 以及標記準確入場水平的斐波那契水平等流行的市場分析工具 進入市場和地方獲利。 策略的详细说明 指示灯使用说明 顾问-贸易猫头鹰助手助理 私人用户聊天 ->购买后写信给我,我会将您添加到私人聊天中,您可以在那里下载所有奖金 力量在於簡單! Owl Smart Levels   交易系統非常易於使用,因此適合專業人士和剛開始研究市場並為自己選擇交易策略的人。 策略和指標中沒有隱藏的秘密公式和計算方法,所有策略指標都是公開的。 Owl Smart Levels 允許您快速查看進入交易的信號,突出顯示下訂單的水平並向您發送有關已出現信號的通知。 優點很明顯: 清楚地顯示主要和更高時間框架的趨勢方向。 指示儀器信號的出現。 標記開單、止損設置和固定利潤的水平。 沒有多餘的,只有必要的結構! ZigZag   表示全球趨勢的方向,因此也表示貿易方向。 市場反轉點的短線清楚地表明在
Delta Pairs
Anatolii Zainchkovskii
Delta Pairs is an indicator for pair trading, it displays the divergence of two currency pairs. Does not redraw. A useful tool for the analysis of the behavior of two currency pairs relative to each other. Purpose The Delta Pairs indicator is designed for determining the divergences in the movements of two currency pairs. This indicator is displayed as two line charts and the difference (delta) between these charts in the form of a histogram. The Delta Pairs indicator will be useful for those
To get access to MT5 version please click   here . This is the exact conversion from TradingView: "Schaff Trend Cycle" by "everget". This is a light-load processing indicator. This is a non-repaint indicator. Buffers are available for processing in EAs. All input fields are available except fillings(due to MT4 graphical restrictions). You can message in private chat for further changes you need. Thanks for downloading
Rubdfx OBOS
Namu Makwembo
Upgraded version 1.5 , Arrow added on to indicate Buy and Sell Signal,  The indicator is an ossicaltor that targets  the highest buying and lowest selling levels , the signal indicated by the two lines crossing  above and below zero line 0 HOW IT WORKS? Buying : you want to place your buy Entry when the yellow line is above the blue line ; stop loss just a few pips below the swing low , take profit when the lines cross again  - A Buy arrow will also appear when the crossing appears Selling:   yo
该产品的买家也购买
Atomic Analyst
Issam Kassas
5 (2)
首先值得强调的是,该交易指标是非重绘、非延迟的指标,这使其成为手动和机器人交易的理想选择。 用户手册:设置、输入和策略。 Atomic Analyst是一种PA价格行动指标,利用价格的力量和动量来寻找市场上更好的机会。配备了高级过滤器,可帮助去除噪音和假信号,并提高交易潜力。使用多层复杂的指标,Atomic Analyst扫描图表,并将复杂的数学计算转化为任何初学者都能理解并用来做出一致交易决策的简单信号和颜色。 “Atomic Analyst”是专为新手和经验丰富的交易者量身定制的综合交易解决方案。它将高级指标和一流功能融合为一体的交易策略,使其成为所有类型交易者的多功能选择。 日内交易和剥头皮策略:专为快速准确的日内交易和短期交易而设计。 日内和摆动交易策略:可用作追求价格大幅波动的日内和摆动交易者的可靠工具。 多货币和市场:凭借其可靠的精度,在不同的工具和市场上运作。 多个时间框架:可在多个时间框架上使用,性能良好。 稳定性:所有指标均不重绘、不重绘和不滞后,确保可靠的信号。 信号清晰度:提供箭头信号,用于清晰的入场和出场点。 实时警报:通过交易入场、SL和TP警报通知交
Scalper Inside PRO
Alexey Minkov
4.73 (56)
An exclusive indicator that utilizes an innovative algorithm to swiftly and accurately determine the market trend. The indicator automatically calculates opening, closing, and profit levels, providing detailed trading statistics. With these features, you can choose the most appropriate trading instrument for the current market conditions. Additionally, you can easily integrate your own arrow indicators into Scalper Inside Pro to quickly evaluate their statistics and profitability. Scalper Inside
目前八折优惠! 对任何新手或专家交易者来说都是最好的解决方案! 这个仪表板软件适用于28种货币对。它基于我们的两个主要指标(高级货币强度28和高级货币冲动)。它对整个外汇市场提供了一个伟大的概述。它显示高级货币强度值,货币运动速度和28个外汇对在所有(9)时间段的信号。想象一下,当你可以使用图表上的单一指标观察整个市场,以确定趋势和或剥头皮的机会时,你的交易将得到改善 我们已经在这个指标中建立了一些功能,使你更容易识别强势和弱势货币,同时识别和确认潜在的交易。该指标以图形方式显示货币的强势或弱势是增加还是减少,以及它在所有时间段的表现。 增加的新功能是动态市场斐波那契水平,它适应当前的市场条件变化,这是一个已经在我们的高级货币强度28和高级货币冲动指标中使用的成熟的加分项。 在交易时,总是将弱势货币和强势货币配对,这个新指标将帮助你做到这一点。 用户手册:点击这里  https://www.mql5.com/en/blogs/post/708783 特点  显示每个时间段的ACS28和GAP-speed(冲动)的货币强度值。 列:颜色代码以7种颜色
Enigmera
Ivan Stefanov
5 (3)
ENIGMERA:市场核心 https://www.enigmera.com 简介 该指标和交易系统是金融市场的一种非凡方法。ENIGMERA 利用分形周期精确计算支撑位和阻力位。它能显示真实的累积阶段,并给出方向和目标。 该系统无论在趋势中还是在修正中都能发挥作用。 它是如何运行的? ENIGMERA 由三条线组成:支撑/阻力线、目标线和偏离线。与一般市场指标将过去的数据推断为现在和未来的情况不同,该系统能提供当前的完整情况。如果你处于支撑位,这意味着真正的支撑;如果你处于阻力位,这意味着真正的阻力。如果突破某一水平,则表示趋势发生变化。没有重绘。 由于市场在不断变化,ENIGMERA 不断调整其评估工具,定期修改策略。  这保证了每种情况都能得到全面评估。这一市场指标的独特性显而易见,其能力不言而喻。  ENIGMERA 为金融分析师和咨询师提供服务,他们需要可靠的见解与客户分享,也为投资者提供服务,他们需要最精确和最可靠的保证。 该系统能够达到最佳精度,使交易者能够自信、清晰地评估他们的选择。 ENIGMERA 将 20 年的交易专长和知识整合到一个综合软件
TPSproTREND PrO
Roman Podpora
4.79 (19)
TPSpro TREND PRO 是一个趋势指标,可以自动分析市场并提供有关趋势及其每次变化的信息,并给出进入交易的信号而无需重新绘制! 该指标使用每根蜡烛,分别对其进行分析。指不同的脉冲——向上或向下脉冲。货币、加密货币、金属、股票、指数交易的准确切入点! MT5版本                 指标的完整描述   我们建议将其与 指示器 -   RFI LEVELS 一起使用 主要功能: 准确的输入信号,无需渲染! 如果出现信号,它仍然相关!这是与重提指标的一个重要区别,重提指标可以提供信号然后改变信号,这可能导致存款资金的损失。现在您可以以更高的概率和准确度进入市场。还有一个功能是在箭头出现后为蜡烛着色,直到达到目标(止盈)或出现反转信号。 显示止损/获利区域 为了提高搜索切入点时的视觉清晰度,创建了一个模块,该模块最初显示买入/卖出区域,在该区域中搜索进入市场的最佳点。用于处理止损水平的附加智能逻辑有助于随着时间的推移减小其大小,从而降低进入交易(移动 sl)时的初始风险。 显示较高时间范围内的最小值/最大值(MTF 模式) 添加了一项功能,可以显示较高时间间隔的最小
Dynamic Forex28 Navigator - 下一代外汇交易工具。 当前 49% 折扣。 Dynamic Forex28 Navigator 是我们长期流行的指标的演变,将三种功能合二为一: 高级货币强度 28 指标 (695 条评论)+ 高级货币 IMPULSE 带警报 (520 条评论)+ CS28 组合信号(奖励)。 有关指标的详细信息 https://www.mql5.com/en/blogs/post/758844 下一代强度指标提供什么? 您喜欢的原始指标的一切,现在通过新功能和更高的精度进行了增强。 主要特点: 专有货币强度公式。  所有时间范围内的平滑和准确的强度线。 非常适合识别趋势和精确进入。 动态市场斐波那契水平(市场斐波那契)。  此指标独有的独特功能。 斐波那契应用于货币强度,而不是价格图表。 适应实时市场活动以获得准确的反转区域。 实时市场动量。  第 9 行显示市场是活跃还是被动。 对于定时交易至关重要。 全面的警报和显示。  每种货币最强的买入和卖出动量。 ​​28 对的双重动量买入和卖出。 超买/超卖警告外部范围
FX Volume
Daniel Stein
4.58 (33)
通过 mql5 和 Telegram 上 的 " 晨间简报 "获取每日市场更新,包括详细信息和屏幕截图 ! 外汇交易量(FX Volume)是第一个也是唯一一个从经纪商角度真正洞察市场情绪的交易量指标。 直接在您的图表上看到这些信息是真正改变游戏规则和突破性的交易解决方案。 受益于独特的市场数据洞察,如 比率(Ratios )显示货币多头和空头头寸的比率(百分比 比率变化 显示所选时间段内的多头比率及其百分比变化 总交易量 显示货币的总交易量(多头和空头),以手为单位 多头 交易量显示货币所有多头头寸的交易量 空头 交易量显示所有货币空头头寸的交易量 净多头 显示净多头交易量,即所有多头头寸减去所有空头头寸(以手为单位)。 净多头百分比 显示货币净多头交易量的变化 请阅读我们的基本教程 -> "如何使用外汇交易量进行交易 " 获取更多信息,如常见问题、交易技巧和教程视频,请访问我们的 外汇交易量公共信息频道 请 安装并运行 SI Connect 以建立与我们数据中心的持续连接 背景信息 我们都知道,外汇是一个分散的市场。这就是为什么我们必须打破常规思维,开发一个独
TPSpro RFI Levels
Roman Podpora
4.82 (22)
指示       俄罗斯 -        英语   建议 与指示器一起使用     -       TPSpro 趋势专业版 -   MT4版本       交易中的一个关键要素是做出买卖交易工具决定的区域或水平。尽管主要参与者试图隐藏他们在市场中的存在,但他们不可避免地会留下痕迹。我们的任务是学习如何识别这些痕迹并正确解释它们。 主要功能: 向卖家和买家显示活跃区域! 该指标显示所有正确的初始买入和卖出脉冲水平/区域。激活这些水平/区域后,开始寻找切入点,水平会改变颜色并填充特定阴影。此外,还会显示箭头,以便更直观地了解情况。 显示更高时间范围内的级别/区域(MTF 模式) 添加了使用更高时间间隔显示级别/区域的功能。此外,该指标还具有自动趋势检测功能(   TPSproTREND PRO   )。 用于交易的单独专业的逐步算法。 该算法专为日内交易而设计,既可顺势交易,也可逆势交易。每个活动模板均提供详细说明。 适用于多种时间范围 。 TPSpro RFI 水平指标可用于图表上的任何时间范围,从一分钟(M1)开始一直到每月(MN)。 图形和声音警报。 该指标提供图形和声音指示
M1 Gold
Abdulkarim Karazon
Gold Channel XAUUSD
Paulo Rocha
5 (2)
Gold Channel is a volatility-based indicator, developed with a specific timing algorithm for the XAUUSD pair, which consists of finding possible corrections in the market. This indicator shows two outer lines, an inner line (retracement line) and an arrow sign, where the theory of the channel is to help identify overbought and oversold conditions in the market. The market price will generally fall between the boundaries of the channel. If prices touch or move outside the channel it is a tra
GOLD Impulse with Alert
Bernhard Schweigert
4.56 (9)
这个指标是我们2个产品 Advanced Currency IMPULSE with ALERT  +   Currency Strength Exotics 的一个超级组合。 它适用于所有时间框架,并以图形方式显示8种主要货币和一种符号的强势或弱势冲动! 该指标专门用于显示任何符号的货币强度加速,如黄金、异国货币对、商品、指数或期货。这是它的第一个指标,任何符号都可以被添加到第9行,以显示黄金、白银、石油、DAX、US30、MXN、TRY、CNH等的真实货币强度加速(冲动或速度)。 建立在新的基础算法上,它使识别和确认潜在的交易更加容易。这是因为它以图形方式显示了一种货币的强势或弱势是否正在加速,并测量了这种加速的速度--把它想象成你汽车中的速度表。当你加速时,事情显然会发生得更快,这在外汇市场上也是一样的,即如果你配对的货币正在向相反的方向加速,你就会发现一个潜在的有利可图的交易。 动态市场斐波那契28水平被用作警报触发器,将适应市场活动。如果冲动击中黄色触发线,你将收到警报。然后你就知道作为一个交易员应该做什么。货币对和方向已经给出。只需点击警报按钮,就可以
AW Prime Oscillator
AW Trading Software Limited
5 (1)
两个振荡器的组合。第一个显示入场点,第二个显示当前趋势。该指标可以通过两种模式的箭头显示振荡信号,所有快速振荡信号或仅在当前趋势方向的信号。它具有多时间范围面板和三种类型的信号通知。 好处: 适合当日交易和倒卖交易 趋势过滤 简单而灵敏的设置 多时间框架面板 适合融入顾问。 适用于任何交易品种和任何时间范围 三种类型的通知 MT5 version ->  HERE  / Problem solving ->  HERE 指标策略 该指标由两个不同的振荡器组成: 慢趋势线(粗) - 当指标的最高水平从上到下交叉时,它是下降趋势的指标,当较低的水平水平(指标的低水平)从下到上交叉时,它是下降趋势的指标上升趋势。此外,在较低区域找到一条慢线表明当前趋势是下降趋势,反之亦然,在上方区域找到一条慢线表明当前趋势是上升趋势。这就是该指标确定当前市场趋势的方式。 快速入场线(细):识别从下到上与下线相交处的入场点,这是买入信号,在从上到下穿越上线时,这是卖出信号。除了振荡线之外,调整指标线也很重要,因为这会影响信号的数量和准确性。 本产品使用不同的振荡器来显示慢线和快线,每个振荡器必须单独调整。
Best Currency Strength Indicator
Tumelo Patrick Rakotsoane
4.59 (46)
Advanced Currency Strength Indicator The Advanced Divergence Currency Strength Indicator. Not only it breaks down all 28 forex currency pairs and calculates the strength of individual currencies across all timeframes , but, You'll be analyzing the WHOLE forex market in 1 window (In just 1 minute) . This indicator is very powerful because it reveals the true movements of the market.  It is highly recommended to  analyze charts knowing the performance of individual currencies or the countries ec
Allows multiple indicators to be combined into a single indicator, both visually and in terms of an alert. Indicators can include standard indicators, e.g. RSI, CCI, etc., and also Custom Indicators, even those purchased through Market, or where just have the ex4 file. An early alert is provided, say when 4 out 5 indicators have lined up, and a confirmed alert when all are in agreement. A‌lso features a statistics panel reporting the success of the combined indicator by examining the current cha
TrendfollowerSR
Paul Reymkhe
4.88 (90)
Take Your Trading Experience To the Next Level ! and get the exclusive TFSR-Analyzer for free !    So you have all these outstanding features  on up to 20 symbols and all timeframes in a smart and clear Design. Correct identification of the trends  in stock investments are pivotal and TrendFollowerSR ensures this perspective while displaying the correct trend on multiply timeframes to help you go long way as much as possible. The latest technology of the Indicator enables to track whether if
MetaBands M4
Vahidreza Heidar Gholami
5 (2)
MetaBands使用强大且独特的算法绘制通道并检测趋势,以便为交易者提供进出交易的潜在点。它是一个通道指标和强大的趋势指标。它包括不同类型的通道,可以通过使用输入参数简单地合并以创建新通道。MetaBands使用所有类型的警报通知用户市场事件。 功能 支持大多数通道算法 强大的趋势检测算法 能够合并不同类型的通道 多时间帧和多货币(信号矩阵) 所有类型的警报功能(声音、屏幕闪烁、推送通知、电子邮件、弹出窗口、箭头) 它永远不会重绘 趋势检测 MetaBands使用在通道内振荡的蓝色线来检测趋势。当该线遇到通道的上界时,表明开始下跌趋势,当它遇到下界时,表明开始上涨趋势。如果蓝线接近中线,则市场处于整理期。 该指标使用独特的方法来检测趋势。一开始可能看起来有些复杂,但如果您观看视频教程,您就会意识到它是多么强大且易于使用。 入场和出场信号 当趋势变化或价格穿过上下通道时,MetaBands会立即通过不同的方法提醒交易者,这些方法可以在指标设置中启用。 信号矩阵 要监视来自不同时间框架的多个符号并在一个地方查看信号,请单击右上角按钮或按键盘上的M键以打开信号矩阵。该矩阵可以
Royal Scalping Indicator M4
Vahidreza Heidar Gholami
4.17 (6)
Royal Scalping Indicator is an advanced price adaptive indicator designed to generate high-quality trading signals. Built-in multi-timeframe and multi-currency capabilities make it even more powerful to have configurations based on different symbols and timeframes. This indicator is perfect for scalp trades as well as swing trades. Royal Scalping is not just an indicator, but a trading strategy itself. Features Price Adaptive Trend Detector Algorithm Multi-Timeframe and Multi-Currency Trend Low
Currency Strength Exotics
Bernhard Schweigert
4.87 (30)
目前8折优惠! 对任何新手或专家交易者来说都是最好的解决方案! 这个指标是专门用来显示任何符号的货币强度,如异国货币对、商品、指数或期货。它是同类产品中的第一个,任何符号都可以添加到第9行,以显示黄金、白银、石油、DAX、US30、MXN、TRY、CNH等的真实货币强度。这是一个独特的、高质量的、负担得起的交易工具,因为我们已经纳入了一些专有的功能和一个新的公式。想象一下,你的交易将如何改善,因为你能够准确地确定新趋势或剥头皮机会的触发点? 用户手册:点击这里   https://www.mql5.com/en/blogs/post/708876 它适用于所有时间框架。你将很快能够看到TREND! 根据新的基础算法设计,它使识别和确认潜在交易变得更加容易。这是因为它以图形方式显示了8种主要货币和一种符号的强弱。 该指标显示了8种主要货币(澳元加元瑞士法郎欧元英镑日元新西兰美元)的强弱线,再加上一个符号! 该指标显示了符号的真实价值。例如:对于XAUUSD(黄金):价格以美元报价。如果黄金在上涨,你怎么能知道是黄金的强势还是美元的弱势?只有当黄金走强时,我们才会进行
Harmonic Papallons
Ramon Sobrevals Arce
3.33 (3)
Automatically scans the chart to find Harmonic Patterns, and give you the chance to enter early in good operations. Also if selected, it will alert you in advance when future patterns appears, showing you a projection of a posible future pattern. The main goal  for this algorithm is to determine with high precision the moment when a trend ends and a new one begins. Giving  you the best price within a reversal.   We have added the "Golden Trade", we define it as the perfect order: For those orde
All in One Trade
Alexey Minkov
4.48 (27)
The All-in-One Trade Indicator (AOTI) determines daily targets for EURUSD, EURJPY, GBPUSD, USDCHF, EURGBP, EURCAD, EURAUD, AUDJPY, GBPAUD, GBPCAD, GBPCHF, GBPJPY, AUDUSD, and USDJPY. All other modules work with any trading instruments. The indicator includes various features, such as Double Channel trend direction, Price channel, MA Bands, Fibo levels, Climax Bar detection, and others. The AOTI indicator is based on several trading strategies, and created to simplify market analysis. All-in-One
MetaTrend M4
Vahidreza Heidar Gholami
Meta Trend Indicator is an efficient way to forecast and detect the trend in any market. It reveals the trend, support and resistance levels, volatility and the maximum potential target, all in one indicator. To adapt to the price and to decrease consecutive trend failures, the internal trend detector algorithm studies the market and dynamically chooses the right values for the internal parameters. This indicator is a perfect trend filter for any strategy or expert advisor. Features Super Adapti
TrendMaestro
Stefano Frisetti
5 (3)
note: this indicator is for METATRADER4, if you want the version for METATRADER5 this is the link:  https://www.mql5.com/it/market/product/108106 TRENDMAESTRO ver 2.4 TRENDMAESTRO recognizes a new TREND in the bud, he never makes mistakes. The certainty of identifying a new TREND is priceless. DESCRIPTION TRENDMAESTRO identifies a new TREND in the bud, this indicator examines the volatility, volumes and momentum to identify the moment in which there is an explosion of one or more of these data a
Beast Indicator V7
Mohamed Ahmed Sh Muhumed
Step into the future of automated trading with the Beast Indicator V7, The indicator allows you to trade binary options. T his indicator give high winning ratio with over 20 years of backtesting  an unparalleled tool that seamlessly transforms your trading journey into an effortless and lucrative venture. Designed to simplify and optimize the trading process, the Beast Indicator is the ultimate game-changer, offering a hassle-free experience that allows you to set your buy and sell options effo
Supply and Demand Dashboard PRO
Bernhard Schweigert
4.8 (20)
目前八折优惠! 这个仪表板是一个非常强大的软件,可用于多个符号和多达9个时间段。 它是基于我们的主要指标(最佳评论:高级供应需求)。 Advanced Supply Demand 该仪表板提供了一个伟大的概述。它显示。   筛选后的供需值,包括区域强度评级。 区间内和区间外的点位距离。 它突出了嵌套的区域。 在所有(9个)时间段内,它对所选符号发出4种警报。 它是高度可配置的,以满足您的个人需求! 您的利益! 对每个交易者来说,最重要的问题是。 什么是入市的最佳水平? 在强大的供应/需求区域内或附近进入你的交易,以获得最佳的成功机会和风险/回报。 我的止损的最佳位置是哪里? 把你的止损放在强势供应/需求区的下方/上方是最安全的。 我的最佳盈利目标是什么? 你的退出策略和你的进入策略一样重要,了解更高的时间框架图可以帮助你。对于买入,使用下一个供应区作为目标,对于卖出,使用下一个需求区作为目标。在回撤到供应区或需求区时进场,以确保有足够的利润空间,达到更高的时间框架的供应和需求,将增加你的利润。 为什么我们要过滤强区和
Entry Points Pro
Yury Orlov
4.62 (175)
这是一款 MT4 的趋势指标,可提供准确的入场交易信号,且无重绘或延迟。 它可应用在任何金融资产:外汇、加密货币、贵金属、股票、指数。 最好的结果出现在 M15+ 的时间帧内。 指标的 MT5 版本 重要! 购买后请联系我,以便获取详细指南和奖励。 视频 (6:22) - 一个信号赢取的利润等于指标价格的三倍。 视频 (4:44) - 它如何在测试器中工作,我的提示和技巧。 视频 (1:44) - 有关它如何处理加密货币和指数的几句话。 大多数交易者在 Entry Points Pro 指标的帮助下,在第一个交易周内就改善了他们的交易结果。 Entry Points Pro 指标的益处 入场信号无重绘或延迟 如果信号出现,并得到确认(如果信号所在烛条已收盘),则它不会再消失;不像是重绘指标,它会导致重大的财产损失,因为它们可以在显示信号后再将其删除。 无差错开仓 指标算法可令您找到入场交易(买入或卖出资产)的理想时机,从而提高每位交易者的成功率。 Entry Points Pro 可操作任何资产 它允许您在 MT4 平台上交易任何经纪商提供的加密货币、股票、
Gann Signal Scaner
Kirill Borovskii
This indicator is based on the Gann Signal indicator and acts as a market scanner. All you need to do is fill in the selected currency pairs in the settings and that’s it. Next, the indicator itself will view all these currency pairs and time frames from M5 to D1 simultaneously. When a new signal appears, the indicator will give you an Alert and also draw the letter N where this new signal will be.
PTS Precision Index Oscillator V2
PrecisionTradingSystems
5 (1)
精密指数振荡器(Pi-Osc)由Precision Trading Systems的Roger Medcalf开发 版本2经过精心重新编码,以在您的图表上加载速度非常快,还加入了一些其他技术改进,以提高体验。 Pi-Osc旨在提供准确的交易定时信号,旨在找到极端的耗尽点,这些点是市场被迫去触及,以清理每个人的止损单。 该产品解决了一个古老的问题,即知道极端点在哪里,这使得交易员的生活变得更加简单。 这是一个高度复杂的共识指标,与行业标准的振荡器相比,具有一些强大的区别。 它使用的一些特征包括需求指数、资金流动、RSI、随机指标、模式识别、成交量分析、标准偏差极端点以及不同长度上述各种变化的分歧。 乍一看,对于未经培训的人来说,它似乎与任何其他振荡器没有什么不同,但当与其他振荡器(如RSI或动量等)相对比时,这个指标的真正威力开始显现。 据我所知,没有其他振荡器可以频繁地精确指出顶部和底部,具有相同的定期效率。 精密指数振荡器由许多不同的数学方程组成,用于测量多个时间框架采样中的价格和成交量变动,从而高度准确地预测趋势可能发生转折的位置。 PTS P
Quantum Breakout Indicator PRO
Bogdan Ion Puscasu
4.96 (25)
介绍     Quantum Breakout PRO   ,突破性的 MQL5 指标,正在改变您交易突破区域的方式!   Quantum Breakout PRO 由拥有超过 13 年交易经验的经验丰富的交易者团队开发,旨在通过其创新和动态的突破区域策略将您的交易之旅推向新的高度。 量子突破指标将为您提供带有 5 个利润目标区域的突破区域的信号箭头,以及基于突破框的止损建议。 它既适合新手交易者,也适合专业交易者。 量子 EA 通道:       点击这里 MT5版本:   点击这里 重要的!购买后请私信我领取安装手册。 建议: 时间范围:M15 货币对:GBPJPY、EURJPY、USDJPY、NZDUSD、XAUUSD 账户类型:ECN、Raw 或 Razor,点差极低 经纪商时间:GMT +3 经纪商:IC Markets、Pepperstone with Raw 和 Razor 的点差最低 规格: 不重漆! 最多 5 个建议利润目标区域 建议止损水平 可定制的盒子。您可以设置自己的 Box Time Start 和 Box Time E
Bomb Bank Signal
Igor Pereira Calil
5 (1)
炸彈銀行訊號:您對 MetaTrader 4 的信心指標 Bomb Bank Signal 是 MetaTrader 4 的一個強大指標,旨在識別金融市場中最相關的趨勢。如果您正在尋找一種能夠準確預測運動的工具,那麼炸彈庫就是您需要的盟友。 運作原理: 該指標結合了三種不同的方法——成交量分析、蠟燭收盤價和對稱趨勢——來偵測和發出買賣機會訊號。當炸彈銀行識別出買入機會時,它就像一顆「炸彈」;當它偵測到賣出訊號時,它就像一個「頭骨」。 為什麼炸彈銀行不一樣? 完全可靠性:炸彈庫訊號不會刪除訊號。訊號一旦發出,就會一直存在,確保您不會錯過任何機會。 極為準確:炸彈庫不會發出錯誤訊號。它會即時更新您的訊息,隨著市場的變化進行調整,但保持先前訊號的透明度。 即時更新:訊號被即時識別並在必要時更新,使您能夠快速響應市場變化。 最大化您的結果: 炸彈銀行訊號是識別趨勢持續走勢的理想選擇。例如,如果您已經做空並且指標在 M15 發出買入訊號,那麼現在就是平倉或部分下單的最佳時機,反之亦然。 此外,經過仔細分析,我們建議您遵循M30、H1和H4上的訊號,停損僅50點。這使
PZ Day Trading
PZ TRADING SLU
3.67 (3)
该指标仅使用价格行为分析和donchian渠道以锯齿形检测价格反转。它是专门为短期交易而设计的,根本不需要重新粉刷或补漆。对于精明的交易者来说,这是一个绝佳的工具,旨在增加他们的运作时间。 [ 安装指南 | 更新指南 | 故障排除 | 常见问题 | 所有产品 ] 极易交易 它在每个时间段都提供价值 实施自我分析统计 它实现了电子邮件/声音/视觉警报 基于可变长度的突破和拥挤区域,该指标仅使用价格行为来选择交易并对市场快速做出反应。 显示过去信号的潜在利润 该指标分析其自身的质量和性能 突围的损失突出显示并解决 该指标是不可重涂和不可重涂的 该指标将帮助盘中交易者不要错过单个价格反转。但是,并非所有价格反转都是一样的,也不是具有相同的可行质量。决定要突破哪些突破而忽略哪些取决于交易者的良好判断。 如何解释统计数据 该指标研究其自身信号的质量,并在图表上绘制相关信息。将分析每笔交易,并在图表的左上角显示总体历史结果,这使您可以针对任何给定的工具和时间范围自行优化指标参数。每个乐器和时间表都有其自己的最佳设置,您可以自己找到它们。 最大优惠交易:对于任何给定的交易,MFE都是
作者的更多信息
MetaTrader 5 免费点差指标 该指标提供了对MetaTrader 5上点差的详细分析,点差是交易者最重要的参数之一,因为它代表了资产的买价(Ask)和卖价(Bid)之间的差额。 该指标包括: 平均点差 :计算为当天观察到的最高点差和最低点差之间的平均值。 当前点差 :显示当前的市场点差。 最低点差 :显示当天达到的最低点差值。 最大点差 :显示当天达到的最大点差值。 该指标旨在提供对市场状况的清晰而即时的视图,帮助交易者更好地评估交易成本并识别任何可能影响其策略的点差变化。 如果您对我的产品感兴趣,建议您访问我的页面,您可以在那里找到: 专家顾问 : https://www.mql5.com/it/market/product/119456?source=Site+Profile 指标 : https://www.mql5.com/it/market/product/121443?source=Site+Market+MT5+Search+Rating006%3amarket+profile 希望点差指标对您有用。 您可以访问我的个人资料: https://www.mql5.
FREE
Follow Line 指标是交易者用于准确识别和跟随市场趋势的重要工具。该指标动态适应价格变化,绘制一条平滑、连续的线来跟踪价格走势。凭借其视觉上的简洁性和有效性,能够提示趋势变化,Follow Line 是任何交易者策略中的绝佳补充。 主要特点: 趋势跟踪: Follow Line 紧随价格变化,使交易者能够轻松识别当前的市场趋势。 视觉简洁: 通过清晰明确的线条,即使是经验不足的交易者也能快速理解市场方向。 适应性强: 适用于各种时间框架和工具,适合从日内交易到波段交易的多种交易策略。 如何使用: 安装: 将 Follow Line 指标添加到您希望分析的金融工具的图表上。 设置: 根据您的交易策略调整指标参数。 趋势分析: 观察 Follow Line 线条以确定当前趋势方向。 交易机会: Follow Line 在趋势市场中特别有用。例如,在突破情境中,当价格超过重要的阻力或支撑位时,Follow Line 可以确认走势的有效性。这使交易者能够更加自信地把握价格波动的机会。
FREE Spread indicator for MetaTrader 4 this indicator includes: -average spread -current spread -minimum spread -maximum spread If you are interested in my products I recommend you visit my page where you can find: Experts Advisors:  https://www.mql5.com/it/market/product/119456?source=Site+Profile indicators:  https://www.mql5.com/it/market/product/120038?source=Site+Profile I hope the spread indicator will be useful to you. https://www.mql5.com/it/users/kappa05
FREE
Enhance Your Trading Strategies with the "Order Block" Indicator for MT4 Discover the "Order Block" Indicator: The "Order Block" Indicator for MT4 is designed to help you precisely identify order blocks in the market by marking the highs and lows of the order block candles. This powerful tool enables you to understand where large institutions place their orders, improving your ability to predict market movements. Key Features: Precise Order Block Detection: Automatically highlights the highs and
IMPORTANT: The indicator will remain at the price of $34.90 until the release of the update scheduled for July 16, 2024. The New Price will be $49.90 (taxes excluded) FVG indicator. If you are an SMC trader this indicator will be very useful to you, it automatically identifies the FVGs on the graph distinguishing them into 2 types: bearish FVGs and bullish FVGs (see the photos to understand better). This indicator works on any Timeframe and on any market you want to use it. If you are interested
Volume Profile Indicator for MT4 Gain a trading edge with the "Volume Profile" indicator for MetaTrader 4 (MT4). This advanced technical analysis tool allows you to precisely identify key support and resistance levels based on transaction volume. Easily visualize market areas of high interest, where trading volumes are highest, and use this information to make more informed trading decisions. Key Features: Clear and detailed visualization : The indicator displays volume histograms directly on th
Presentation of the "Color Range Indicator" The "Color Range Indicator" is a powerful technical analysis tool designed for the MT4 platform, perfect for traders who want a clear and immediate view of market trends. This indicator draws a colored line based on the current trend, making it easier to interpret price movements. Indicator Description: Green line : Indicates an uptrend. Use this signal to consider buying opportunities. Red line : Indicates a downtrend. Use this signal to consider sell
什么是"实时多指标"? "实时多指标" 是一款先进的交易工具,旨在简化和优化您的技术分析。这款革命性指标收集多个时间框架和技术指标的信号,并将它们显示在一个清晰易读的表格中。如果您希望在不必不断切换图表或手动分析每个指标的情况下获得完整和详细的市场视图,"实时多指标" 是您的理想解决方案。 为什么选择"实时多指标"? 多时间框架分析: "实时多指标" 允许您同时监控多个时间框架的市场。从M15到H4,这个指标清楚地显示了每个时间框架的趋势是上升还是下降,帮助您根据市场的整体视图做出明智的决策。 多个指标的集成: 该工具结合了多个关键技术指标的信号,如Parabolic SAR, MACD, SMA, ADX 和 CCI。无需分别分析每个指标,"实时多指标" 为您提供了全面而详细的概览,清晰地显示了多个时间框架中的趋势和买卖信号。 清晰的汇总表: "实时多指标" 的一个突出特点是其汇总表。此表清晰显示了每个时间框架中每个指标的买入或卖出信号,使市场状况一目了然,并使您能够迅速应对机会。 易于使用: 无论您的交易经验水平如何,"实时多指标" 都被设计为用户友好型。直观的界面和信息的有序呈现
从77.90美元降至37.90美元的折扣,优惠截止至9月1日星期日 什么是“Forex Scanner”? “Forex Scanner”是一个强大的交易工具,旨在为您提供实时的外汇市场全面概览。这个先进的指标从多个技术指标和时间框架中收集关键数据,让您能够快速识别交易机会。如果您希望在不切换图表的情况下监控众多资产和参数,“Forex Scanner”是您的完美解决方案。 为什么选择“Forex Scanner”? 多时间框架扫描: “Forex Scanner”允许您在不同的时间框架内监控市场,从分钟到小时不等。这个工具帮助您在多个时间层次上立即识别趋势和交易信号,让您基于完整和详细的市场视图采取行动。 **集成多个指标:**该指标集成了多种技术工具,如ATR、RSI、随机指标、ADX、枢轴点和移动平均线,为您提供每个资产的市场条件清晰而准确的视图。通过这种集成,“Forex Scanner”让您能够以更大的信心和精确度进行交易。 清晰而有信息量的显示: “Forex Scanner”的一大特色是其能够在一个有组织的屏幕上显示所有相关信息。无论您是在寻找支撑和阻力位信息,还是想评估
增强型RSI:更深入的技术分析混合指标 增强型RSI是一种多功能且可定制的技术指标,旨在为交易者提供更全面和准确的市场分析。通过结合移动平均线、RSI和MACD的最佳特性,该指标提供了动量和趋势强度的多维视角。 主要特点: 完美融合: 增强型RSI融合了移动平均线、RSI和MACD的功能,提供了更完整的价格走势视图。 最大灵活性: 通过可定制的周期,指标适应任何交易风格和时间框架。 多功能性: 它适用于任何金融资产,从外汇到加密货币、股票和指数。 分析支持: 增强型RSI不是自动交易系统,而是一个提供有用信号和确认的工具,以增强您的技术分析。 工作原理: 增强型RSI计算RSI的指数移动平均线,并将其与MACD的信号相结合。结果是一个振荡器,识别超买和超卖条件,发出背离信号并确认趋势。 优点: 更可靠的信号: 多指标的结合减少了错误信号的风险。 趋势反转的提前预测: 增强型RSI可以帮助比其他指标更早识别趋势反转。 自定义: 通过调整移动平均线周期、RSI水平和MACD参数,将指标定制为满足您的特定需求。 用途: 趋势识别: 增强型RSI帮助确认趋势方向并识别累积和分配阶段。 入场和出
MetaTrader 5的Dynamic Cycle Indicator——您在周期交易中的优势! Dynamic Cycle Indicator 是准确识别市场周期并优化您在 MetaTrader 5 上交易策略的终极工具。基于先进的周期分析算法,该指标为您提供了前所未有的优势,可以检测市场拐点并预测未来价格走势。 Dynamic Cycle Indicator 的独特之处是什么? 完美的周期识别 :通过对市场波动的准确分析,该指标自动检测周期,并在图表上用清晰的符号突出转折点。这些点对于确定最佳进出场时机至关重要。 即时可见的信号 :图表上的红色和蓝色箭头清楚地显示了峰值和低谷信号。这些视觉信号使您能够更自信地预测方向变化,从而提高时机判断的准确性。 简单易懂 :图表的下半部分配有周期振荡器,显示当前周期阶段,线条流畅易于理解。彩色曲线与波动带相结合,提供了清晰的市场走势视图,减少噪音,帮助决策。 适合不同时间框架和资产 :该指标在外汇、股票、大宗商品等任何金融工具上都能完美运行,并能轻松适应不同的时间框架。无论是短期还是长期操作, Dynamic Cycle Indicator
外汇剥头皮指标 – 您在金融市场中赚钱的精确工具 MT4的外汇剥头皮指标是所有希望以最高精度进行市场剥头皮交易的交易者的完美助手。借助于对精确数据的分析,该指标为您提供及时且准确的信号,非常适合快速做出交易决策。 量身定制的精确度 图表上显示的每一个箭头都基于缜密的计算,提供最佳的进出机会。这些不是随机信号,而是基于实时市场分析的精确指示。 精准识别反转点 该指标能够高精度地识别价格潜在的反转点,使其成为您交易的必备工具。依靠可靠数据生成的信号,即使在市场最动荡的时期,您也能最大化利润。 简洁易读的界面 正如您在截图中所见,外汇剥头皮指标在图表上清晰地显示箭头,使得信号的读取和解释更加容易。无论您是捕捉微小波动还是等待更明确的信号,该指标都能保证您获得精确且即时的见解。 为什么选择外汇剥头皮指标? 基于精确数据的准确和可靠的信号 适合低时间框架的剥头皮策略 易于安装和配置到MT4上 适合各级交易者 立即获取外汇剥头皮指标,提高您的交易精确度!不要错过基于精确数据进行更明智操作的机会。
OB Indicator
Nicola Capatti
Order Block indicator, highs and lows; the indicator focuses mainly on OBs, on the chart they are represented with a horizontal line on the minimum and maximum of that candle. While for the maximums and minimums only one line is marked (see the images to understand better). The indicator is for MT5, it works on all Timeframes, on any Forex Pair, on any index and on crypto markets. (For any information on the indicator do not hesitate to contact me). Limited time discount (50%) 74.90$ -> 38.60$
ScalpingMarketEA
Nicola Capatti
Expert Advisor for scalping; This EA was built for monthly profitability. Works on any asset: Forex, Indices, Crypto and Stocks. Perfectly usable in MT5 tester and usable on any TimeFrame. The EA has various inputs available to customize operations: -Lots -Risk% (0 = Fix) -OrderDist (the distance between one order and another, the distance is calculated in points not pips) -TP (in points) -Sl (in points) -TrailingStopTrigger(the trailing stop trigger point in points) -TrailingStop(distance from
Highs, Lows and Bos Indicator for MT5; The indicator works on any type of market and on all TimeFrames. It also works on the MetaTrader5 Tester. the main function of the indicator is to identify the highs and lows by marking them with a point above/below the candle, then with a horizontal line it marks the Bos. It is very simple and intuitive, there are only 2 inputs: -the color of the maximums -the color of the minima For any other information do not hesitate to contact me.
Panel Info Trade For MT5; The indicator has 2 main objects: -An icon chart that you can change Timeframe, zoom, Forex Pair, crypto....the position of the graph can be modified via the (x;y) inputs. The chart is perfectly usable in the MT5 tester. If the graph isn't for you and doesn't help you with anything, you can press the button on the top right to make it smaller. -the second object is a dynamic control panel where you can change plots, place sl and tp, BE, close partial... (if you watch th
货币强度指数 (Currency Strength Index - CSI) 指标 在激活指标之前,请记得将"TRUE"设置为显示货币对 货币强度指数 (Currency Strength Index - CSI) 指标是外汇交易中用于衡量主要货币相对强度的强大工具。该指标帮助交易者识别在特定时间内最强和最弱的货币,从而使他们能够做出更明智的交易决策。 主要特点: 比较分析: 根据历史和当前数据比较不同货币的强度。 交易信号: 帮助识别基于相对强度的最佳货币对进行交易。 自定义: 用户可以配置计算周期和其他参数,以适应其交易策略。 直观显示: 以清晰和可视化的方式呈现信息,便于数据解释。 如何使用: 安装: 将CSI指标添加到所需货币对的图表中。 设置: 配置所需的参数,如计算周期。 分析: 观察货币强度线,识别那些强度增加或减少的货币。 交易: 使用这些信息做出交易决策,选择买入强势货币,卖出弱势货币。
In the world of trading, the key to success lies in having the right tools at the right time. Our innovative Volume Profile indicator was developed with one goal in mind: to provide traders with unprecedented access to vital market activity information. This cutting-edge tool allows you to not only see where and when volumes are traded but also to understand market depth with clarity never seen before. Main Features: Temporal Flexibility: Set the analysis range up to 1800 minutes to perfectly ma
Maximize Your Trading Opportunities with the "Auto Trendlines" Indicator Discover the "Auto Trendlines" Indicator: "Auto Trendlines" is the essential tool for every technical trader. This indicator automatically plots trend lines, pinpointing support and resistance levels with surgical precision. It's ideal for those looking to capitalize on market breakouts and reversals. Key Features: Automatic Trendline Plotting: Identifies and draws crucial trend lines without manual intervention. Advanced C
AutoFibo for MT5
Nicola Capatti
Optimize Your Trading Decisions with the "autoFibo" Indicator Discover the "autoFibo" Indicator: "autoFibo" is the essential analysis tool for traders who want to fully leverage Fibonacci levels without the hassle of manual plotting. This indicator automates the Fibonacci retracement process, providing instant visual access to key support and resistance zones. Key Features: Automatic Fibonacci Retracement: Automatically plots Fibonacci levels, making it easy to identify support and resistance zo
Enhance Your Trading Performance with the "Better Volume" Indicator Discover the "Better Volume" Indicator: The "Better Volume" is the essential market volume analysis tool for traders aiming to stand out. It analyzes tick volumes with unprecedented accuracy, featuring an advanced moving average function (PERIOD_MA) and customizable buy and sell alerts. Key Features: Advanced Volume Analysis: Recognize volume peaks signaling crucial price movements. Intuitive Buy and Sell Alerts: Stay one step a
SuperTrend 是交易中最有效且广泛使用的技术指标之一,非常适合识别趋势方向并生成进场和出场信号。基于波动性和趋势,该指标会动态适应市场条件,为交易者提供清晰的视觉参考。 主要特点: 趋势检测: SuperTrend 跟随市场趋势,在下跌趋势中绘制一条位于价格上方的线,在上涨趋势中绘制一条位于价格下方的线。 易于使用: 由于其直观的图形表示,即使是经验较少的交易者也可以轻松解读。 进场/出场信号: 当价格向上穿越 SuperTrend 线时生成买入信号,向下穿越时生成卖出信号。 适应性: 可在不同时间框架和工具上工作,使其成为从日内交易到波段交易的各种交易风格的多功能工具。 如何使用: 安装: 将 SuperTrend 添加到您要分析的金融工具图表中。 设置: 配置指标参数,如周期和倍数,以适应您的交易策略。 趋势分析: 观察 SuperTrend 线以确定当前趋势方向。 交易执行: 使用 SuperTrend 生成的信号做出交易决策。当 SuperTrend 位于价格下方时做多,当其位于上方时做空。 交易机会: SuperTrend 在趋势市场中特别有效。例如,在突破情境中,当
新的组合指标 - 3合1 你是否在寻找可以提升市场分析和投资策略的交易工具?我们将三个最好的指标组合在一个强大且便捷的解决方案中,使你在交易中获得最大的价值。 1. 订单块指标 (原价32.90$) 订单块指标是识别市场中机构兴趣区域的关键工具。该指标标记了订单块蜡烛的高点和低点,这通常代表了价格可能发生反转或趋势延续的关键区域。单独使用时,订单块指标帮助你识别潜在的支撑和阻力区域,从而提高你的交易决策能力。 链接: https://www.mql5.com/it/market/product/121633?source=Site+Market+MT5+Search+Rating006%3aorderblock+indicator 2. FVG指标 (原价34.90$) FVG指标旨在识别公平价值缺口(FVG),这些价格空隙可能表明供需不平衡。这些缺口通常被视为交易机会,因为价格通常会回到这些区域填补空白。FVG指标是希望精准把握这些价格波动的交易者必不可少的工具。 链接: https://www.mql5.com/it/market/product/119368?source=Sit
FVG for MT5
Nicola Capatti
“Fair Value Gap” (FVG) 指标 - 探索市场不平衡的力量 交易的世界充满了隐藏的机会,但只有拥有正确工具的人才能有效识别和利用这些机会。我们的 FVG 指标 旨在帮助您做到这一点。如果您是一位寻求提升市场分析能力并找到最佳进场和出场点的交易员,FVG 指标将是您完美的助手。 什么是 Fair Value Gap (FVG)? Fair Value Gap 的概念指的是供需之间的差异,这种差异在价格图表上形成了一个“缺口”。这个缺口代表了价格可能回调以填补这一不平衡的区域,使这些区域成为潜在的交易机会。这些缺口是在价格快速波动时形成的,可能是理解未来市场行为的关键。 为什么 FVG 指标必不可少? FVG 指标可以轻松帮助您在图表上识别这些不平衡区域,并突出显示价格可能回调以填补缺口的地方。这一信息对于任何交易策略都至关重要,因为它为交易员提供了识别可能发生回调或加速的关键价格水平的能力。 FVG 指标的主要特点 自动缺口识别: FVG 指标自动扫描图表以识别 Fair Value Gap,节省您的时间并减少人为错误的可能性。 清晰的视觉信号: 缺口区域在图表上被清晰
什么是“Schaff RSX”? “Schaff RSX”将相对强弱指数(RSX)的有效性与Schaff周期的精确性相结合,创造出一种独特的指标,帮助您轻松识别最佳的市场进出时机。这就像拥有一个能够检测隐藏交易机会的雷达,让您在竞争中脱颖而出,其他交易者根本无法忽视这一优势。 为什么选择“Schaff RSX”? 清晰直观的视觉简洁性 :“Schaff RSX”的颜色和线条会清楚地显示市场何时处于超买或超卖状态。不再依赖直觉或运气;您将拥有准确可靠的信息,尽在眼前。 完全可定制化 :每个交易者都有自己的策略,而“Schaff RSX”完美适应您的策略。您可以根据自己的喜好配置参数,准确获取您所需要的结果。 适用于每种交易风格 :无论您是日间交易者,还是偏好较长时间段的交易,“Schaff RSX”都能适应各种时间框架,从M1图表到日线图。 完整的交易工具 :通过结合Schaff周期和RSX,您将拥有一个更灵敏和反应迅速的指标,能够比其他工具更精确地捕捉市场动向。 “Schaff RSX”如何改善您的交易? 想象一下,您可以提前识别趋势反转,准确知道市场何时处于极端状态,并通过额外的确定
MetaTrader 5 的"Positions Manager" 是一个必不可少的工具,适用于那些希望高效自动化管理头寸的交易者。这个高级工具旨在帮助交易者控制他们的操作,改善风险管理,并通过 Break Even 和 Trailing Stop 等功能最大化潜在利润。 主要功能: 自动 Break Even: 通过激活 Break Even 的选项,"Positions Manager" 允许您在市场对您有利时保护利润。您可以配置激活所需的点数,并添加额外的点数以覆盖佣金。 动态 Trailing Stop: 激活 Trailing Stop 以跟随市场动向并保护您的收益。该功能会自动根据价格波动进行调整,使交易者能够在市场有利时保持头寸开启,并在趋势逆转时自动关闭。 完全自定义: Break Even 和 Trailing Stop 设置完全可自定义。交易者可以设置激活所需的点数,并根据他们的特定交易策略调整参数。 直观界面: 用户界面简单易用,选项清晰,布局方便快速访问所有功能。"Positions Manager" 无缝集成到 MT5 环境中,提供流畅、无缝的交易体验。 为什
Smart Fractals 指标 - 一个强化的 Fractal 用于您的 MT5 交易 Smart Fractals 是您熟悉并在图表中使用的经典 Fractal 指标的进化版。专为 MetaTrader 5 设计,此指标不仅仅是识别市场的经典反转点,它更进一步,使您的交易更加高效和盈利。我们采用了基本的 Fractal 概念,并将其转变为更智能、更功能化的工具。 主要特点: 买入和卖出信号:除了传统的 Fractal 指标外,Smart Fractals 包含明确的买入和卖出信号,这些信号通过图表上的黄色和紫色箭头可视化展示。这些信号使您更有信心进入交易。 改善的可视化:每个 Fractal 都以清晰直观的方式显示,通过可定制的颜色区分 "向上" 和 "向下" Fractal。此外,市场结构突破 (BOS) 实时显示,以确认方向的有效性。 可定制的颜色和风格:您可以通过各种颜色和样式选项将指标调整为符合您的视觉偏好。正如图片中所示,指标可配置,使图表分析更加清晰和快速。 多功能性和精确性:可在任何时间框架和所有主要资产(外汇、指数、加密货币等)上使用,为您提供精确和更新的信号。
筛选:
无评论
回复评论