• 概述
  • 评论
  • 评论

Dynamic Cycle Indicator for MT4

MetaTrader 5的Dynamic Cycle Indicator——您在周期交易中的优势!

Dynamic Cycle Indicator 是准确识别市场周期并优化您在 MetaTrader 5 上交易策略的终极工具。基于先进的周期分析算法,该指标为您提供了前所未有的优势,可以检测市场拐点并预测未来价格走势。

Dynamic Cycle Indicator 的独特之处是什么?

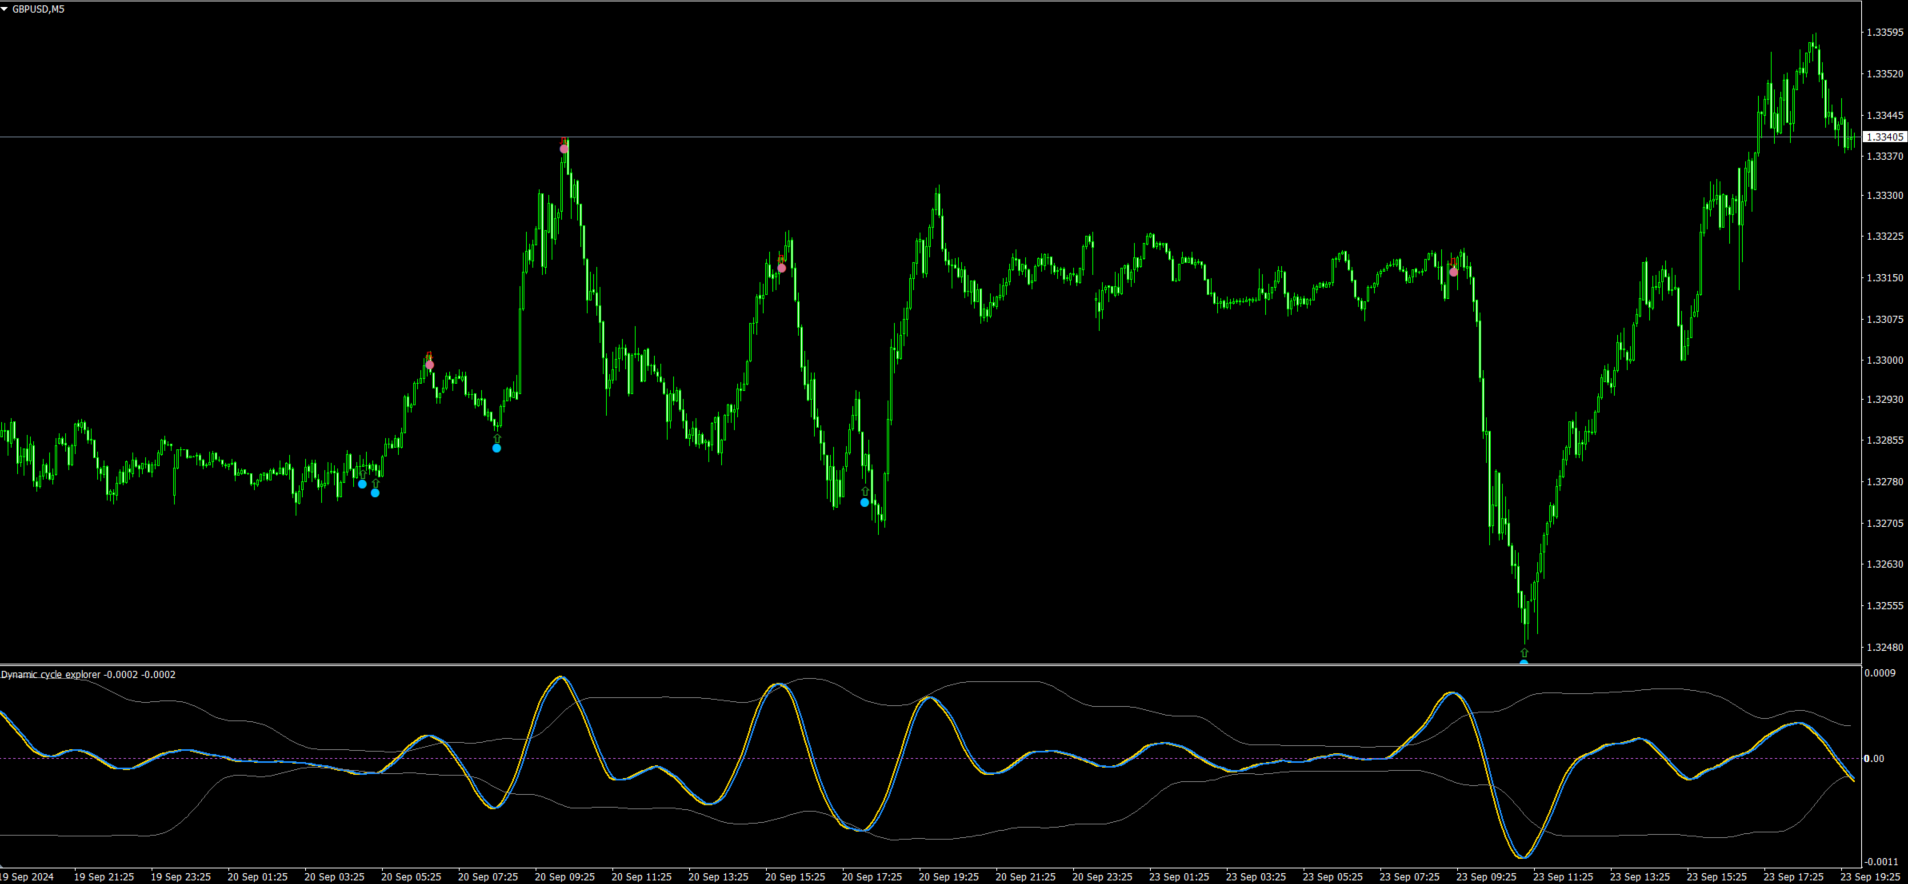
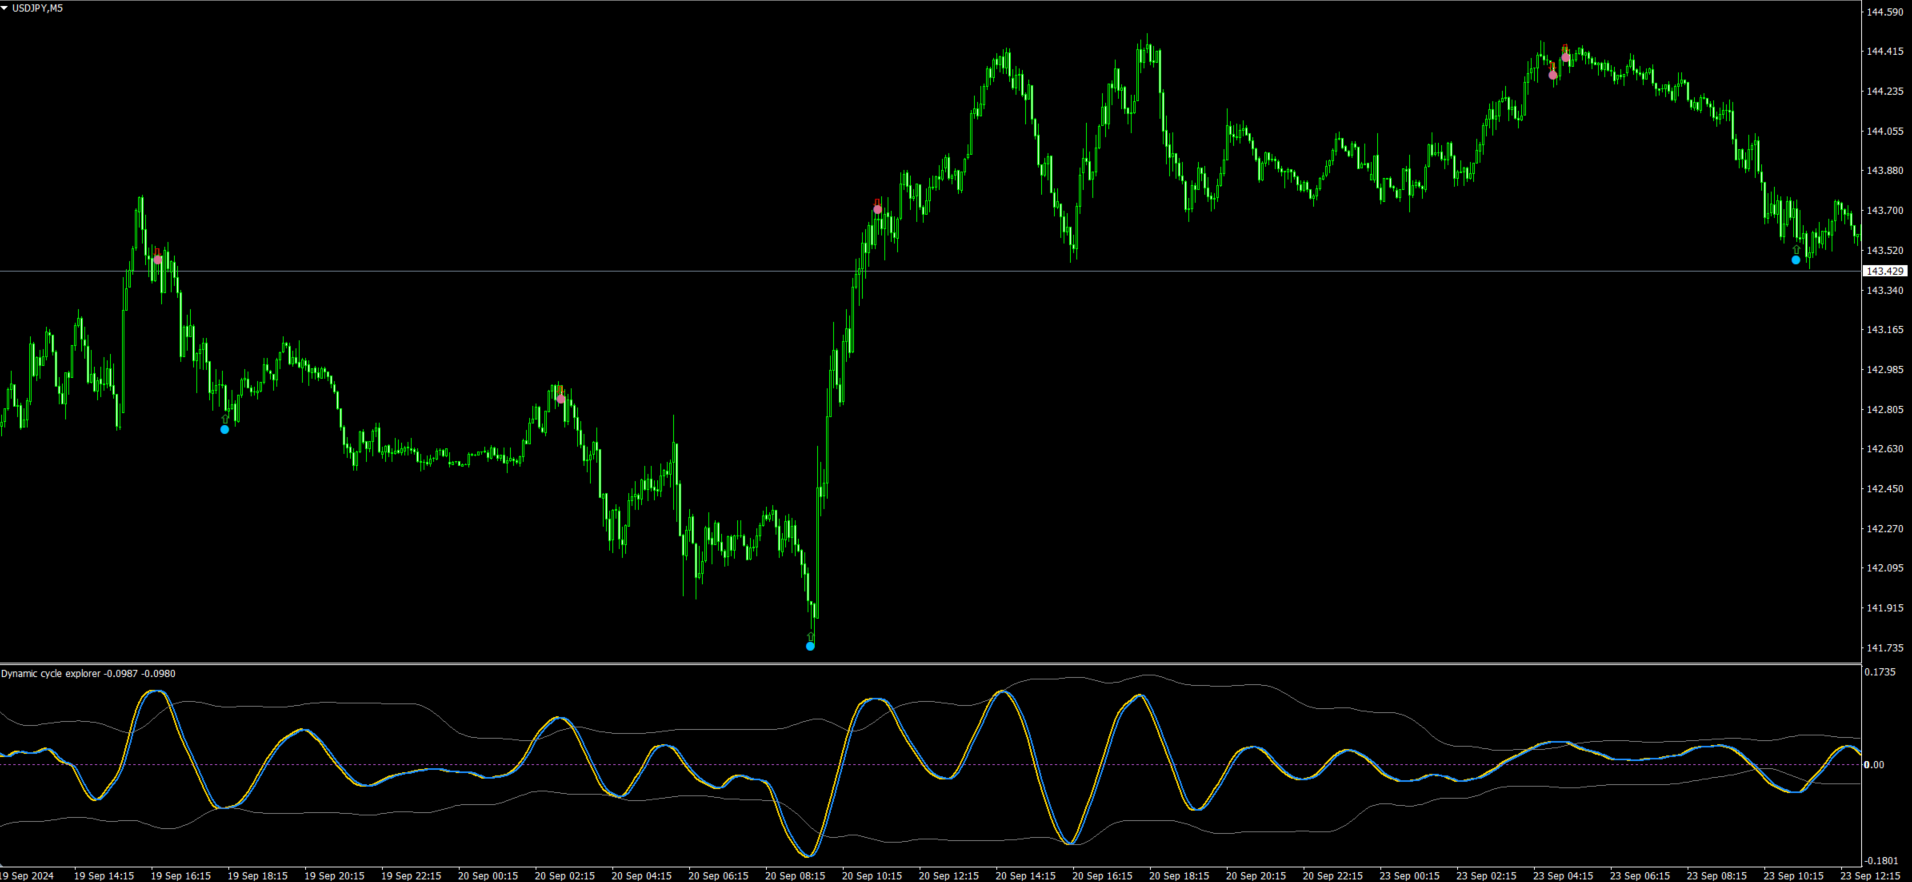
  1. 完美的周期识别:通过对市场波动的准确分析,该指标自动检测周期,并在图表上用清晰的符号突出转折点。这些点对于确定最佳进出场时机至关重要。

  2. 即时可见的信号:图表上的红色和蓝色箭头清楚地显示了峰值和低谷信号。这些视觉信号使您能够更自信地预测方向变化,从而提高时机判断的准确性。

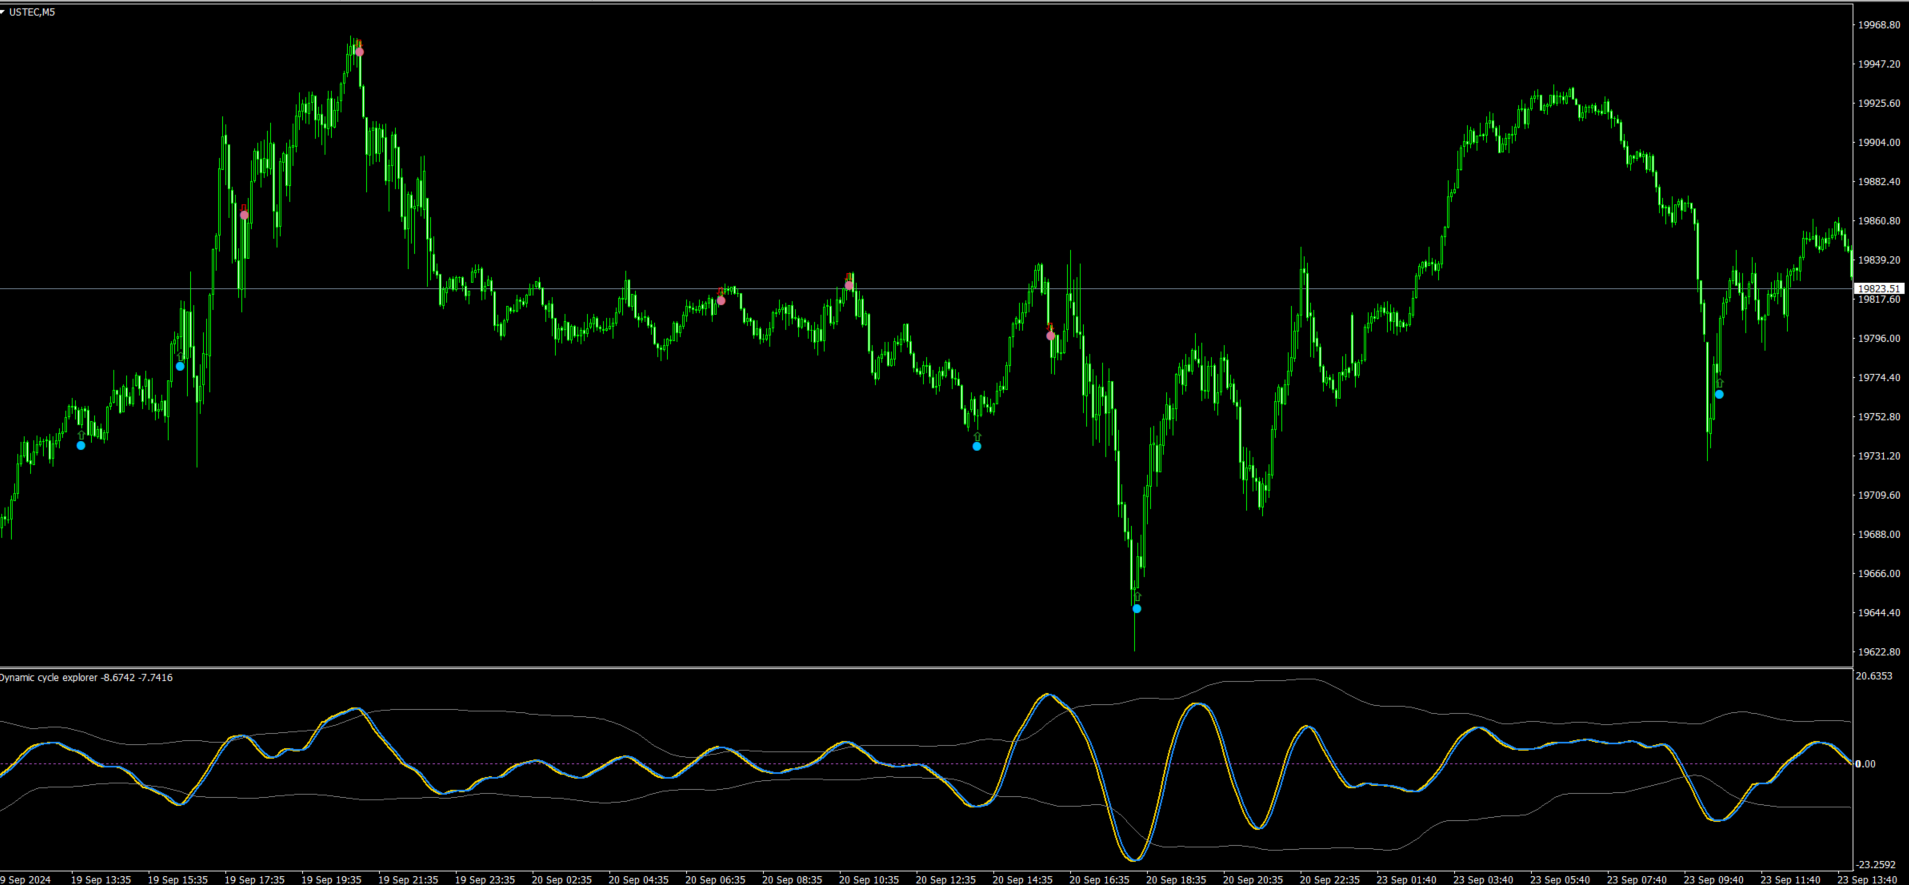
  3. 简单易懂:图表的下半部分配有周期振荡器,显示当前周期阶段,线条流畅易于理解。彩色曲线与波动带相结合,提供了清晰的市场走势视图,减少噪音,帮助决策。

  4. 适合不同时间框架和资产:该指标在外汇、股票、大宗商品等任何金融工具上都能完美运行,并能轻松适应不同的时间框架。无论是短期还是长期操作,Dynamic Cycle Indicator 都能为您提供准确的分析。

  5. 为高级交易优化:它是技术交易者的理想工具,能够增强基于市场周期的策略。非常适合想要结合技术分析和周期分析的交易者,从而提高操作精度。

为什么选择它?

  • 显著的结果:通过清晰可靠的信号,帮助提高风险/回报比。
  • 简单易用:即使是新手交易者也可以通过视觉信号和振荡器快速做出明智的决策。
  • 多功能性:它可以集成到不同的交易策略中,在任何市场条件下提高您的交易结果。


推荐产品
VR Cub
Vladimir Pastushak
VR Cub 这是获得高质量切入点的指标。该指标的开发是为了促进数学计算并简化对仓位入场点的搜索。多年来,该指标所针对的交易策略已被证明其有效性。交易策略的简单性是其巨大的优势,即使是新手交易者也能成功进行交易。 VR Cub 计算开仓点以及获利和止损目标水平,这显着提高了效率和易用性。查看使用以下策略进行交易的屏幕截图,了解简单的交易规则。 设置、设置文件、演示版本、说明、问题解决,可以从以下位置获取 [博客] 您可以在以下位置阅读或撰写评论 [关联] 版本为 [MetaTrader 5] 计算入场点的规则 开仓 要计算入场点,您需要将 VR Cub 工具从最后一个高点拉伸到最后一个低点。 如果第一个点在时间上早于第二个点,交易者等待柱线收于中线上方。 如果第一个点在时间上晚于第二个点,交易者等待柱线收于中线下方。 根据上述条件,严格在 柱线收盘 后建仓。 换句话说,如果我们在小时图上进行交易,那么从最高点到最低点的时间距离必须超过24小时,最高点和最低点之间的点数必须大于或等于平均价格变动每天。 维持和改变市场地位 可以有多个未平仓头寸;每个头寸都可以单独修改。 VR Cu
Infinity Trend Pro
Yaroslav Varankin
1 (1)
This is a trend indicator without redrawing Developed instead of the binary options strategy (by the color of the Martingale candlestick) Also works well in forex trading When to open trades (binary options) A signal will appear in the place with a candle signaling the current candle It is recommended to open a deal for one candle of the current timeframe M1 and M5 When a blue dot appears, open a deal up When a red dot appears, open a trade down. How to open trades on Forex. When a signal is rec
Master scalping M1
Nataliia Marchuk
Master Scalping M1 is an innovative indicator that uses an algorithm to quickly and accurately determine the trend.The indicator calculates the time of opening and closing positions, the indicator's algorithms allow you to find the ideal moments to enter a deal (buy or sell an asset), which increase the success of transactions for most traders. Benefits of the indicator: Easy to assemble, does not overload the chart with unnecessary information. Can be used as a filter for any strategy. Works on
PipFinite Trend PRO
Karlo Wilson Vendiola
4.89 (2359)
Breakthrough Solution For Trend Trading And Filtering With All Important Features Built Inside One Tool! Trend PRO's smart algorithm detects the trend, filters out market noise and gives entry signals with exit levels. The new features with enhanced rules for statistical calculation improved the overall performance of this indicator. Important Information Revealed Maximize the potential of Trend Pro, please visit www.mql5.com/en/blogs/post/713938 The Powerful Expert Advisor Version Automa
Trendiness Index
Libertas LLC
5 (3)
"The trend is your friend" is one of the best known sayings in investing, because capturing large trendy price movements can be extremely profitable. However, trading with the trend is often easier said than done, because many indicators are based on price reversals not trends. These aren't very effective at identifying trendy periods, or predicting whether trends will continue. We developed the Trendiness Index to help address this problem by indicating the strength and direction of price trend
ZhiBiCCI MT4
Qiuyang Zheng
【ZhiBiCCI】指标适合所有的周期使用,也适合所有的市场品种。 【ZhiBiCCI】绿色实线是逆转看涨背离。绿色虚线是经典的看涨背离。 【ZhiBiCCI】向红色实线是反向看跌背离。红色虚线是古典看跌背离。 【ZhiBiCCI】可以在参数里面设置(Alert、Send mail、Send notification),设置为(true)就可以发送即时信号到警报窗口、电子邮件、即时消息。 参数设置说明: 【displayAlert】:这是警报开关,设置成true,如果出现箭头就会自动警报提示;设置成false,则不会警报提示。 【sendmail_NO_OFF】:这是发送邮件的开关,设置成true,如果出现箭头就会发送邮件到你在MT4设置好的邮箱里面;设置成false,则不会发邮件。 【sendnotification_NO_OFF】:这是发送即时消息的开关,设置成true,如果出现箭头就会发送消息到你的移动设备;设置成false,则不会发消息。 更多好用的指标网址: https://www.mql5.com/en/users/zhengqiuyang/seller
Stepping Trend
Mpendulo Chiliza
The Stepping Trend Indicator     The Steppi ng Trend indicator uses the  average true range  (ATR indicator) in its calculation. This gives you control to set your own average true range period, I set the Default as 10.   Indicator Details. Green Arrow Up: This means you are at the starting point of a new bullish trend, it’s time to buy.   Red  Arrow  Down : This means you are at the starting point of a new  bearish  trend, it’ s time to sell .   What if you miss the Arrow Signal?   No
Distinctive
Tatiana Savkevych
Distinctive is a forex trending arrow indicator for identifying potential entry points. I like it, first of all, because it has a simple mechanism of work, adaptation to all time periods and trading tactics. Created on the basis of a regression channel with filters. Plotting the Lawrence indicator signals on a price function chart using a mathematical approach. How it works - when the price breaks out in the overbought / oversold zone (channel levels), a buy or sell signal is generated. Every
Trade with Gann on your side!! MASTER CIRCLE 360 CIRCLE CHART, originally created by Gann admitted that this is “The Mother of all charts”. It is one of the last studies that this great trader left for us. The numeric tab le is apparently quite simple like all the tables and is based on square numbers, the SQUARE OF 12 and is by evolution, one of the most important square numbers. Here we can find CYCLE, PRICE AND TIME thanks to angles and grades, to show past and future support and resistance.
Owl smart levels
Sergey Ermolov
4.34 (35)
MT5版本  |  FAQ Owl Smart Levels Indicator   是一個完整的交易系統,包含   Bill Williams   的高級分形、構建正確的市場波浪結構的 Valable ZigZag 以及標記準確入場水平的斐波那契水平等流行的市場分析工具 進入市場和地方獲利。 策略的详细说明 指示灯使用说明 顾问-贸易猫头鹰助手助理 私人用户聊天 ->购买后写信给我,我会将您添加到私人聊天中,您可以在那里下载所有奖金 力量在於簡單! Owl Smart Levels   交易系統非常易於使用,因此適合專業人士和剛開始研究市場並為自己選擇交易策略的人。 策略和指標中沒有隱藏的秘密公式和計算方法,所有策略指標都是公開的。 Owl Smart Levels 允許您快速查看進入交易的信號,突出顯示下訂單的水平並向您發送有關已出現信號的通知。 優點很明顯: 清楚地顯示主要和更高時間框架的趨勢方向。 指示儀器信號的出現。 標記開單、止損設置和固定利潤的水平。 沒有多餘的,只有必要的結構! ZigZag   表示全球趨勢的方向,因此也表示貿易方向。 市場反轉點的短線清楚地表明在
Gann Square of 144
Taras Slobodyanik
5 (5)
江恩箱(或江恩方)是一种基于 W.D. Gann 的“市场预测的数学公式”文章的市场分析方法。 该指标可以绘制三种正方形模型:90、52(104)、144。有六种网格变体和两种弧形变体。 您可以在一张图表上同时绘制多个方块。 参数 Square — 选择方形模型: 90 — 90 的平方(或 9 的平方); 52 (104) — 52(或 104)的平方; 144 — 144的万能平方; 144 (full) — 正方形的“完整”版本,结合了其他正方形的线条。 据我们所知,W.D.江恩并没有这样的加价; for Arcs — 圆弧的简化正方形; Grid — 网格的变体: 4x4 (52) — 4 x 4 网格,52 个标记; 5x5 (40); 8x8 (90); 8x8 (104); 8x8 (144); 16x16 (144); 36x36 (144); disable — 禁用网格; Arcs — 弧线的变体: 4x4; 5x5; disable — 禁用弧; 开始时的方形参数: Length of Square, Bars (X-axis) — 正方形的长度(以条
Laser Trend
Nicolas Zouein
The trend is your friend! This is what this indicator is all about. Follow this famous saying and be safe. Characteristics: Buy/Sell signals fixed on the close of a bar. Works on all symbols and all timeframes. Clear visual market trend laser line, Buy/Sell signal arrows, market strength meter, TP1 & TP2 boxes. Visual signals when to enter, when to exit the market. No repainting. Compatible with Flexible EA for trading automation. (Ask for a free set file optimized to perform 2010-2018) Para
RaysFX Supertrend Bar RaysFX Supertrend Bar è un indicatore personalizzato per MetaTrader 4. Utilizza l'indice di canale delle materie prime (CCI) per generare segnali di trading. L'indicatore mostra dei puntini in una finestra separata sotto il grafico principale per indicare i segnali di trading. Caratteristiche principali: Calcola il CCI per diversi periodi temporali. Visualizza puntini per indicare i segnali di trading. Permette all'utente di modificare i periodi temporali e la distanza tra
Chart Patterns Detect 15 patterns (Ascending Triangle, Descending Triangle, Rising Wedge, Falling Wedge, Bullish Flag, Bearish Flag, Bullish Rectangle, Bearish Rectangle Symmetrical triangle, Head and Shoulders, Inverted Head and Shoulders, Triple top, Triple Bottom, Double Top, Double Bottom) Use historical data to calculate the probability of each pattern to succeed (possibility to filter notification according to the chance of success) gives graphic indication about the invalidation level and
Signal trend indicator. Detects the direction of the trend and is coloured accordingly.  Has built in audible and visual alerts when trends change. Can send notifications to your phone or email. Allows Trend and Counter-Trend trading. Works on all timeframes, all currency pairs, metals, indices and cryptocurrencies. Can be used with binary options. Distinctive features No re-drawing; Simple and clear settings; Four types of alerts; Works on all timeframes and all trading tools; Su
Point61 Indicator
Evgeniy Machok
5 (1)
The Point61 indicator is the result of many years of monitoring of price behavior of currency pairs and metals. It is not a secret, that in times of uncertainty, traders are looking for possible levels of support and resistance - the point, where price should stop its movement. There are 2 possible scenarios at these points: 1. Reverse (correction) to the opposite direction; 2. Breakthrough to continue movement. Very often these points are used to set stop orders - TakeProfit or
Trend Monitor
Pavel Zamoshnikov
4 (4)
The indicator generates early signals basing on ADX reading data combined with elements of price patterns. Works on all symbols and timeframes. The indicator does not redraw its signals. You see the same things on history and in real time. For better visual perception signals are displayed as arrows (in order not to overload the chart). Features Easy to use. Filter configuration only requires selection of sensitivity in the " Sensitivity of the indicator " input. Signals can be filtered usin
Insider Scalper Binary This tool is designed to trade binary options. for short temporary spends. to make a deal is worth the moment of receiving the signal and only 1 candle if it is m1 then only for a minute and so in accordance with the timeframe. for better results, you need to select well-volatile charts.... recommended currency pairs eur | usd, usd | jpy .... the indicator is already configured, you just have to add it to the chart and trade .... The indicator signals the next can
Atomic Analyst
Issam Kassas
5 (2)
首先值得强调的是,该交易指标是非重绘、非延迟的指标,这使其成为手动和机器人交易的理想选择。 用户手册:设置、输入和策略。 Atomic Analyst是一种PA价格行动指标,利用价格的力量和动量来寻找市场上更好的机会。配备了高级过滤器,可帮助去除噪音和假信号,并提高交易潜力。使用多层复杂的指标,Atomic Analyst扫描图表,并将复杂的数学计算转化为任何初学者都能理解并用来做出一致交易决策的简单信号和颜色。 “Atomic Analyst”是专为新手和经验丰富的交易者量身定制的综合交易解决方案。它将高级指标和一流功能融合为一体的交易策略,使其成为所有类型交易者的多功能选择。 日内交易和剥头皮策略:专为快速准确的日内交易和短期交易而设计。 日内和摆动交易策略:可用作追求价格大幅波动的日内和摆动交易者的可靠工具。 多货币和市场:凭借其可靠的精度,在不同的工具和市场上运作。 多个时间框架:可在多个时间框架上使用,性能良好。 稳定性:所有指标均不重绘、不重绘和不滞后,确保可靠的信号。 信号清晰度:提供箭头信号,用于清晰的入场和出场点。 实时警报:通过交易入场、SL和TP警报通知交
The Th3Eng PipFinite indicator is based on a very excellent analysis of the right trend direction with perfect custom algorithms. It show the true direction and the best point to start trading. With StopLoss point and Three Take Profit points. Also it show the right pivot of the price and small points to order to replace the dynamic support and resistance channel, Which surrounds the price. And Finally it draws a very helpful Box on the left side on the chart includes (take profits and Stop loss
Fourteen plus nine TD Sequential
MOHAMMED IMAD HUSSEIN BASSEE
Fourteen plus nine What is it for? Applying Tom DeMark’s TD Sequential serves the purpose of identifying a price point where an uptrend or a downtrend exhausts itself and reverses. . What are the main components of TD Sequential? TD Sequential has two parts – TD Setup and TD Countdown. The first phase of TD Sequential starts with a TD Setup and is completed with a 9 count. When the 9 count is completed, it is at that point, a price pause, price pullback, or reversal is likely. It is also at tha
Renko, Heiken Ashi, Ticks Bar, Range Bar.    Easy switching, easy setup, all in one window.        Place the Custom Chart indicator and view Renko, Heiken Ashi, Tick bar, Range bar charts in real time at real chart.    Position the offline chart window so that the indicator control panel is visible.    Switch the chart mode by click of a button.    Connect to the output chart any indicator, expert advisor without any restrictions.    No, it doesn't work in the tester.    Yes, you can use an
Kangaroo Tailz
Brenden Caleb Luebeck
Looking for an indicator that identifies high-probability price action patterns? Love counter-trend trading? The Kangaroo Tailz indicator might be just for you. This indicator is meant to be used as a reversal detector. I personally would rather enter a position at the beginning of a trend rather than catch the last couple of moves. This indicator does a good job of alerting when price may reverse by identifying price action patterns that occur frequently in markets. Even though this indicator i
Cosmic Diviner X Planet
Olena Kondratenko
4 (2)
This unique multi-currency strategy simultaneously determines the strength of trends and market entry points, visualizing this using histograms on the chart. The indicator is optimally adapted for trading on the timeframes М5, М15, М30, Н1. For the convenience of users, the indicator renders the entry point (in the form of an arrow), recommended take profit levels (TP1, TP2 with text labels) and the recommended Stop Loss level. The take profit levels (TP1, TP2) are automatically calculated for
RTSPattern
Tomas Belak
The indicator provides a superior alternative to price action analysis. It enables the identification of normalized patterns, which are then transformed into a graphical representation to forecast future steps within a time series. In the top-left corner, you'll find information regarding the expected prediction accuracy, determined through a complex MSQE calculation. You have the flexibility to adjust the time window, making it easy to validate the indicator's performance. Additionally, you can
Moving Average Bands
Philip Pankaj Suthagar
MOVING AVERAGE BANDS / MA BANDS: This is an very simple Indicator but very powerful in identifying trend reversal.The calculation of moving Average bands consist of defining the range of bars and the multiplier we use. -To find range of n bars we used the values of moving average high and low values of n bars. -Then we used individual multiplier for individual bands. -The multiplier we defining can be based on your style say for example some needs moving average fibonacci bands or dynamic fibona
Advanced Trend Regime
Shellard Securities (Pty) Ltd
The indicator has been designed to function on any time-frame and any pair.   This regime filter will help the trader better evaluate whether the current market is trending, and in which direction. It quickly reacts to changes in market dynamics using a series of advanced calculations. The user is able to select whether the calculation remains standard, or if a further filter constraint is added to the calculation.   A Yellow moving average of the signal has been included for the trader to smoot
Indicador Taurus All4
Fabio Oliveira Magalhaes
Taurus All4 Taurus All4 is a high-performance indicator, it will tell you the strength of the trend, and you will be able to observe the strength of the candle. Our indicator has more than 4 trend confirmations. It is very simple and easy to use. Confirmation Modes Candle Trend Confirmations: When the candle switches to light green the trend is high. When the candle switches to light red the trend is reverting down. When the candle changes to dark red the trend is low. Trendline Trend Conf
Support and Resistance is a very important reference for trading.  This indicator provides customized support and resistance levels, automatic draw line and play music functions.  In addition to the custom RS, the default RS includes Pivot Point, Fibonacci, integer Price, MA, Bollinger Bands. Pivot Point is a resistance and support system. It has been widely used at froex,stocks, futures, treasury bonds and indexes. It is an effective support resistance analysis system. Fibonacci also known as t
Matrixs
Andriy Sydoruk
Matrix is a Forex arrow indicator. Displays signals simply and clearly! The arrows show the direction of the transaction, and are colored accordingly, which can be seen in the screenshots. As you can see, trading with such an indicator is easy. I waited for an arrow to appear in the desired direction - I opened a deal. An arrow formed in the opposite direction - closed the deal. The indicator also displays the lines with the help of which the arrow signals are formed, taking into account the int
该产品的买家也购买
Gann Made Easy
Oleg Rodin
4.85 (82)
Gann Made Easy 是一个专业且易于使用的外汇交易系统,它基于使用先生理论的最佳交易原则。 W.D.江恩。该指标提供准确的买入和卖出信号,包括止损和获利水平。您甚至可以使用推送通知在旅途中进行交易。 购买后请联系我!我将免费与您分享我的交易技巧和丰厚的红利指标! 您可能已经多次听说过江恩交易方法。通常 Gann 的理论不仅对于新手交易者而且对于那些已经有一定交易经验的人来说都是非常复杂的东西。这是因为江恩的交易方法在理论上并不那么容易应用。我花了几年时间来完善这些知识,并将最好的原则应用到我的外汇指标中。 该指标非常易于应用。您所需要的只是将其附加到您的图表并遵循简单的交易建议。该指标不断进行市场分析工作并寻找交易机会。当它检测到一个好的入口点时,它会为您提供一个箭头信号。该指标还显示止损和获利水平。 换句话说,当您像先生一样进行交易时,该指标会为您提供最佳江恩建议。江恩亲自告诉你此时此刻该做什么。但最好的部分是您不需要了解任何有关江恩交易原则的知识,因为该指标会为您完成整个市场分析工作。
Enigmera
Ivan Stefanov
5 (3)
ENIGMERA:市场核心 https://www.enigmera.com 简介 该指标和交易系统是金融市场的一种非凡方法。ENIGMERA 利用分形周期精确计算支撑位和阻力位。它能显示真实的累积阶段,并给出方向和目标。 该系统无论在趋势中还是在修正中都能发挥作用。 它是如何运行的? ENIGMERA 由三条线组成:支撑/阻力线、目标线和偏离线。与一般市场指标将过去的数据推断为现在和未来的情况不同,该系统能提供当前的完整情况。如果你处于支撑位,这意味着真正的支撑;如果你处于阻力位,这意味着真正的阻力。如果突破某一水平,则表示趋势发生变化。没有重绘。 由于市场在不断变化,ENIGMERA 不断调整其评估工具,定期修改策略。  这保证了每种情况都能得到全面评估。这一市场指标的独特性显而易见,其能力不言而喻。  ENIGMERA 为金融分析师和咨询师提供服务,他们需要可靠的见解与客户分享,也为投资者提供服务,他们需要最精确和最可靠的保证。 该系统能够达到最佳精度,使交易者能够自信、清晰地评估他们的选择。 ENIGMERA 将 20 年的交易专长和知识整合到一个综合软件
Scalper Inside PRO
Alexey Minkov
4.73 (56)
An exclusive indicator that utilizes an innovative algorithm to swiftly and accurately determine the market trend. The indicator automatically calculates opening, closing, and profit levels, providing detailed trading statistics. With these features, you can choose the most appropriate trading instrument for the current market conditions. Additionally, you can easily integrate your own arrow indicators into Scalper Inside Pro to quickly evaluate their statistics and profitability. Scalper Inside
TPSpro RFI Levels
Roman Podpora
4.82 (22)
指示       俄罗斯 -        英语   建议 与指示器一起使用     -       TPSpro 趋势专业版 -   MT4版本       交易中的一个关键要素是做出买卖交易工具决定的区域或水平。尽管主要参与者试图隐藏他们在市场中的存在,但他们不可避免地会留下痕迹。我们的任务是学习如何识别这些痕迹并正确解释它们。 主要功能: 向卖家和买家显示活跃区域! 该指标显示所有正确的初始买入和卖出脉冲水平/区域。激活这些水平/区域后,开始寻找切入点,水平会改变颜色并填充特定阴影。此外,还会显示箭头,以便更直观地了解情况。 显示更高时间范围内的级别/区域(MTF 模式) 添加了使用更高时间间隔显示级别/区域的功能。此外,该指标还具有自动趋势检测功能(   TPSproTREND PRO   )。 用于交易的单独专业的逐步算法。 该算法专为日内交易而设计,既可顺势交易,也可逆势交易。每个活动模板均提供详细说明。 适用于多种时间范围 。 TPSpro RFI 水平指标可用于图表上的任何时间范围,从一分钟(M1)开始一直到每月(MN)。 图形和声音警报。 该指标提供图形和声音指示
Dynamic Forex28 Navigator - 下一代外汇交易工具。 当前 49% 折扣。 Dynamic Forex28 Navigator 是我们长期流行的指标的演变,将三种功能合二为一: 高级货币强度 28 指标 (695 条评论)+ 高级货币 IMPULSE 带警报 (520 条评论)+ CS28 组合信号(奖励)。 有关指标的详细信息 https://www.mql5.com/en/blogs/post/758844 下一代强度指标提供什么? 您喜欢的原始指标的一切,现在通过新功能和更高的精度进行了增强。 主要特点: 专有货币强度公式。  所有时间范围内的平滑和准确的强度线。 非常适合识别趋势和精确进入。 动态市场斐波那契水平(市场斐波那契)。  此指标独有的独特功能。 斐波那契应用于货币强度,而不是价格图表。 适应实时市场活动以获得准确的反转区域。 实时市场动量。  第 9 行显示市场是活跃还是被动。 对于定时交易至关重要。 全面的警报和显示。  每种货币最强的买入和卖出动量。 ​​28 对的双重动量买入和卖出。 超买/超卖警告外部范围
TPSproTREND PrO
Roman Podpora
4.79 (19)
TPSpro TREND PRO 是一个趋势指标,可以自动分析市场并提供有关趋势及其每次变化的信息,并给出进入交易的信号而无需重新绘制! 该指标使用每根蜡烛,分别对其进行分析。指不同的脉冲——向上或向下脉冲。货币、加密货币、金属、股票、指数交易的准确切入点! MT5版本                 指标的完整描述   我们建议将其与 指示器 -   RFI LEVELS 一起使用 主要功能: 准确的输入信号,无需渲染! 如果出现信号,它仍然相关!这是与重提指标的一个重要区别,重提指标可以提供信号然后改变信号,这可能导致存款资金的损失。现在您可以以更高的概率和准确度进入市场。还有一个功能是在箭头出现后为蜡烛着色,直到达到目标(止盈)或出现反转信号。 显示止损/获利区域 为了提高搜索切入点时的视觉清晰度,创建了一个模块,该模块最初显示买入/卖出区域,在该区域中搜索进入市场的最佳点。用于处理止损水平的附加智能逻辑有助于随着时间的推移减小其大小,从而降低进入交易(移动 sl)时的初始风险。 显示较高时间范围内的最小值/最大值(MTF 模式) 添加了一项功能,可以显示较高时间间隔的最小
FX Power MT4 NG
Daniel Stein
5 (13)
通过 mql5 和 Telegram 上 的晨间简报获取每日市场更新,包括详细信息和屏幕截图 ! FX Power MT4 NG 是我们长期以来非常受欢迎的货币强度计算器 FX Power 的下一代产品。 这款下一代强度计算器能提供什么?您所喜爱的原版 FX Power 的所有功能 附加功能 黄金/XAU 强度分析 更精确的计算结果 可单独配置的分析周期 可自定义计算限制,以获得更好的性能 为希望查看更多信息的用户提供特殊的多实例设置 无尽的图形设置,可在每个图表中设置您最喜欢的颜色 无数的通知选项,让您再也不会错过任何重要信息 采用 Windows 11 和 macOS 风格的全新圆角设计 神奇的移动指标面板 FX Power 主要功能 所有主要货币的完整强势历史 所有时间框架内的货币强弱历史 所有经纪商和图表的计算结果完全相同 100% 可靠的实时计算 -> 无重绘 可通过下拉列表选择分析时段 通过自定义模式单独配置分析时段 可在一个图表中使用多个实例 可移动 FX Power 显示屏(通过拖放) 适用于高分辨率 QHD、UHD 和 4K 显示器 自动终端配置 针对平板电脑
目前八折优惠! 对任何新手或专家交易者来说都是最好的解决方案! 这个仪表板软件适用于28种货币对。它基于我们的两个主要指标(高级货币强度28和高级货币冲动)。它对整个外汇市场提供了一个伟大的概述。它显示高级货币强度值,货币运动速度和28个外汇对在所有(9)时间段的信号。想象一下,当你可以使用图表上的单一指标观察整个市场,以确定趋势和或剥头皮的机会时,你的交易将得到改善 我们已经在这个指标中建立了一些功能,使你更容易识别强势和弱势货币,同时识别和确认潜在的交易。该指标以图形方式显示货币的强势或弱势是增加还是减少,以及它在所有时间段的表现。 增加的新功能是动态市场斐波那契水平,它适应当前的市场条件变化,这是一个已经在我们的高级货币强度28和高级货币冲动指标中使用的成熟的加分项。 在交易时,总是将弱势货币和强势货币配对,这个新指标将帮助你做到这一点。 用户手册:点击这里  https://www.mql5.com/en/blogs/post/708783 特点  显示每个时间段的ACS28和GAP-speed(冲动)的货币强度值。 列:颜色代码以7种颜色
MetaBands M4
Vahidreza Heidar Gholami
5 (2)
MetaBands使用强大且独特的算法绘制通道并检测趋势,以便为交易者提供进出交易的潜在点。它是一个通道指标和强大的趋势指标。它包括不同类型的通道,可以通过使用输入参数简单地合并以创建新通道。MetaBands使用所有类型的警报通知用户市场事件。 功能 支持大多数通道算法 强大的趋势检测算法 能够合并不同类型的通道 多时间帧和多货币(信号矩阵) 所有类型的警报功能(声音、屏幕闪烁、推送通知、电子邮件、弹出窗口、箭头) 它永远不会重绘 趋势检测 MetaBands使用在通道内振荡的蓝色线来检测趋势。当该线遇到通道的上界时,表明开始下跌趋势,当它遇到下界时,表明开始上涨趋势。如果蓝线接近中线,则市场处于整理期。 该指标使用独特的方法来检测趋势。一开始可能看起来有些复杂,但如果您观看视频教程,您就会意识到它是多么强大且易于使用。 入场和出场信号 当趋势变化或价格穿过上下通道时,MetaBands会立即通过不同的方法提醒交易者,这些方法可以在指标设置中启用。 信号矩阵 要监视来自不同时间框架的多个符号并在一个地方查看信号,请单击右上角按钮或按键盘上的M键以打开信号矩阵。该矩阵可以
TrendMaestro
Stefano Frisetti
5 (3)
note: this indicator is for METATRADER4, if you want the version for METATRADER5 this is the link:  https://www.mql5.com/it/market/product/108106 TRENDMAESTRO ver 2.4 TRENDMAESTRO recognizes a new TREND in the bud, he never makes mistakes. The certainty of identifying a new TREND is priceless. DESCRIPTION TRENDMAESTRO identifies a new TREND in the bud, this indicator examines the volatility, volumes and momentum to identify the moment in which there is an explosion of one or more of these data a
Scalper Vault
Oleg Rodin
5 (27)
Scalper Vault 是一个专业的剥头皮系统,为您提供成功剥头皮所需的一切。该指标是一个完整的交易系统,可供外汇和二元期权交易者使用。推荐的时间范围是 M5。 该系统为您提供趋势方向的准确箭头信号。它还为您提供顶部和底部信号以及江恩市场水平。无论您拥有何种交易经验,该系统都易于使用。您只需要遵循简单的规则并每天重复该过程。 建议将此系统用于主要货币对。感谢您的关注! 请注意,该指标在策略测试器中可能无法正常工作。因此,我建议仅在模拟或真实账户的真实交易条件下使用该系统。 指示器提供所有类型的警报,包括推送通知。 购买指标后请与我联系。我将免费与您分享我的个人交易建议和出色的奖励指标! 祝您交易愉快,盈利!
Advanced Currency IMPULSE with ALERT
Bernhard Schweigert
4.9 (481)
目前31%的折扣!! 对任何新手或专家交易者来说都是最好的解决方案! 这个指标是一个独特的、高质量的、负担得起的交易工具,因为我们已经纳入了一些专有的功能和一个秘密的公式。只需一张图表,它就能给出所有28种货币对的警报。想象一下,你的交易将如何改善,因为你能够准确地确定新趋势或剥头皮机会的触发点 建立在新的基础算法上,它使识别和确认潜在交易变得更加容易。这是因为它以图形方式显示了一种货币的强势或弱势是否正在加速,并测量了这种加速的速度--把它想象成你汽车中的速度表。当你加速时,事情显然会发生得更快,这在外汇市场上也是一样的,即如果你配对的货币正在向相反的方向加速,你就会发现一个潜在的有利可图的交易。 货币动量的垂直线和箭头将指导你的交易! 动态的市场斐波那契23水平被用作警报触发器,将适应市场活动。如果冲动触及黄色触发线,您将在MetaTrader或您的电子邮件或推送警报中收到警报。然后你就知道作为一个交易员应该做什么。货币对和方向已经给出。只要点击警报按钮,就可以切换到该货币对或打开一个新的图表,以便进一步分析。警报级别可以通过用户输入来改变,可以选择3个敏感度级别
Matrix Arrow Indicator MT4
Juvenille Emperor Limited
5 (3)
矩阵箭头指标 MT4 是一种独特的 10 合 1 趋势,遵循 100% 非重绘多时间框架指标 ,可用于所有符号/工具:外汇、商品、加密货币、指数、股票。  Matrix Arrow Indicator MT4 将在其早期阶段确定当前趋势,从多达 10 个标准指标中收集信息和数据,它们是: 平均定向运动指数 (ADX) 商品渠道指数 (CCI) 经典 Heiken Ashi 蜡烛 移动平均线 移动平均收敛散度 (MACD) 相对活力指数 (RVI) 相对强弱指数 (RSI) 抛物线SAR 随机振荡器 威廉姆斯的百分比范围 当所有指标给出有效的买入或卖出信号时,相应的箭头将打印在图表上,在下一根蜡烛/柱线开盘时,指示强劲的上升趋势/下降趋势。用户可以选择使用哪些指标,并可以单独调整每个指标的参数。 Matrix Arrow Indicator MT4 仅从选定的指标中收集信息,并仅根据其数据打印箭头。 Matrix Arrow Indicator MT4 还可以为所有新信号发送终端、推送通知或电子邮件警报。无论您是黄牛、日内交易者还是波段交易者, Matrix Arrow Indicat
MetaTrader 4 终极黄金顾问 – 您通向成功的尖端交易工具! Ultimate Gold Advisor 不仅仅是一个简单的指标:它是将彻底改变您在 MetaTrader 4 上交易方式的 技术瑰宝 。专为满足最苛刻的交易者需求而设计,这款先进的指标结合了精准度、复杂分析和强大的功能,为您提供无与伦比的市场竞争优势。 Ultimate Gold Advisor 是交易黄金的理想选择,同时也适用于各种资产类别,它是 解锁您盈利潜力 的关键。 为什么 Ultimate Gold Advisor 是每个交易者的必备工具? 顶级性能 :该指标的胜率高达 89%,不仅可靠,而且极其有效。每笔盈利和亏损交易都清晰地显示在图表上,让您可以实时评估您的策略潜力,并根据此优化操作策略,以 数学般的精准度 最大化您的利润。 清晰即时的交易信号 :红色和蓝色的箭头精确标记交易信号,帮助您把握每一个市场机会,提供您所需的 及时性 。 实时点差监控 : Ultimate Gold Advisor 对价格的 每个波动 进行点差测量,帮助您以 精确度 计划交易。 先进的趋势检测技术 :该指标通过虚线标记关
Currency Strength Wizard
Oleg Rodin
4.93 (44)
货币强度向导是一个非常强大的指标,为您提供成功交易的一体化解决方案。该指标使用多个时间范围内所有货币的数据来计算这个或那个外汇对的力量。此数据以易于使用的货币指数和货币电力线的形式表示,您可以使用它们来查看这种或那种货币的力量。 您所需要的只是将指标附加到您要交易的图表上,该指标将向您显示您交易的货币的真实强度。该指标还向您显示买卖量压力的极值,您可以在顺势交易时利用这些压力。该指标还显示了基于斐波那契的可能目标。该指标可用于各种交易时间范围。该指标支持各种货币对的交易。 该指标为您提供所有类型的警报,包括推送通知。 购买后请联系我。我将与您分享我的交易技巧,并免费为您提供丰厚的红利指标! 祝您交易愉快,获利丰厚!
FX Volume
Daniel Stein
4.58 (33)
通过 mql5 和 Telegram 上 的 " 晨间简报 "获取每日市场更新,包括详细信息和屏幕截图 ! 外汇交易量(FX Volume)是第一个也是唯一一个从经纪商角度真正洞察市场情绪的交易量指标。 直接在您的图表上看到这些信息是真正改变游戏规则和突破性的交易解决方案。 受益于独特的市场数据洞察,如 比率(Ratios )显示货币多头和空头头寸的比率(百分比 比率变化 显示所选时间段内的多头比率及其百分比变化 总交易量 显示货币的总交易量(多头和空头),以手为单位 多头 交易量显示货币所有多头头寸的交易量 空头 交易量显示所有货币空头头寸的交易量 净多头 显示净多头交易量,即所有多头头寸减去所有空头头寸(以手为单位)。 净多头百分比 显示货币净多头交易量的变化 请阅读我们的基本教程 -> "如何使用外汇交易量进行交易 " 获取更多信息,如常见问题、交易技巧和教程视频,请访问我们的 外汇交易量公共信息频道 请 安装并运行 SI Connect 以建立与我们数据中心的持续连接 背景信息 我们都知道,外汇是一个分散的市场。这就是为什么我们必须打破常规思维,开发一个独
Entry Points Pro
Yury Orlov
4.62 (175)
这是一款 MT4 的趋势指标,可提供准确的入场交易信号,且无重绘或延迟。 它可应用在任何金融资产:外汇、加密货币、贵金属、股票、指数。 最好的结果出现在 M15+ 的时间帧内。 指标的 MT5 版本 重要! 购买后请联系我,以便获取详细指南和奖励。 视频 (6:22) - 一个信号赢取的利润等于指标价格的三倍。 视频 (4:44) - 它如何在测试器中工作,我的提示和技巧。 视频 (1:44) - 有关它如何处理加密货币和指数的几句话。 大多数交易者在 Entry Points Pro 指标的帮助下,在第一个交易周内就改善了他们的交易结果。 Entry Points Pro 指标的益处 入场信号无重绘或延迟 如果信号出现,并得到确认(如果信号所在烛条已收盘),则它不会再消失;不像是重绘指标,它会导致重大的财产损失,因为它们可以在显示信号后再将其删除。 无差错开仓 指标算法可令您找到入场交易(买入或卖出资产)的理想时机,从而提高每位交易者的成功率。 Entry Points Pro 可操作任何资产 它允许您在 MT4 平台上交易任何经纪商提供的加密货币、股票、
Quantum Breakout Indicator PRO
Bogdan Ion Puscasu
4.96 (25)
介绍     Quantum Breakout PRO   ,突破性的 MQL5 指标,正在改变您交易突破区域的方式!   Quantum Breakout PRO 由拥有超过 13 年交易经验的经验丰富的交易者团队开发,旨在通过其创新和动态的突破区域策略将您的交易之旅推向新的高度。 量子突破指标将为您提供带有 5 个利润目标区域的突破区域的信号箭头,以及基于突破框的止损建议。 它既适合新手交易者,也适合专业交易者。 量子 EA 通道:       点击这里 MT5版本:   点击这里 重要的!购买后请私信我领取安装手册。 建议: 时间范围:M15 货币对:GBPJPY、EURJPY、USDJPY、NZDUSD、XAUUSD 账户类型:ECN、Raw 或 Razor,点差极低 经纪商时间:GMT +3 经纪商:IC Markets、Pepperstone with Raw 和 Razor 的点差最低 规格: 不重漆! 最多 5 个建议利润目标区域 建议止损水平 可定制的盒子。您可以设置自己的 Box Time Start 和 Box Time E
Advanced Currency Strength28 Indicator
Bernhard Schweigert
4.9 (650)
目前26%的折扣 任何新手或专家交易者的最佳解决方案! 这个指标是一个独特的、高质量的、可负担得起的交易工具,因为我们纳入了一些专有的功能和一个新的公式。只需一个图表,你就可以读出28个外汇对的货币强度!想象一下,你的交易将如何得到改善,因为你的交易是在你的手中进行的。想象一下,你的交易将如何改善,因为你能够准确地确定新趋势或剥头皮机会的触发点? 用户手册:点击这里  https://www.mql5.com/en/blogs/post/697384 这是第一本,原版的! 不要买一个毫无价值的崇拜者的克隆品。 特别的 子窗口中的箭头显示强劲的货币势头GAP将指导你的交易! 当基础货币或报价货币处于超卖/超买区域(外盘斐波那契水平)时,在个人图表的主窗口中出现警告信号。 当货币力量从外围区间回落时,回撤/反转警报。 十字星模式的特别警报 可选择多个时间框架,以快速查看趋势! 货币强度线在所有的时间框架中都非常平稳,当使用较高的时间框架来识别总体趋势,然后使用较短的时间框架来确定精确的入口时,效果非常好。你可以根据自己的意愿选择任何时间框架。每个时间框架都由其自身进
Blahtech Supply Demand
Blahtech Limited
4.61 (33)
Was: $299  Now: $99   Supply Demand uses previous price action to identify potential imbalances between buyers and sellers. The key is to identify the better odds zones, not just the untouched ones. Blahtech Supply Demand indicator delivers functionality previously unavailable on any trading platform. This 4-in-1 indicator not only highlights the higher probability zones using a multi-criteria strength engine, but also combines it with multi-timeframe trend analysis, previously confirmed swings
Advanced Supply Demand
Bernhard Schweigert
4.91 (294)
现在优惠 33%! 任何新手或专业交易者的最佳解决方案! 该指标是一款独特、高质量、且价格合理的交易工具,因为我们已经整合了许多专有功能和新公式。 依据此更新,您将能够显示双重时间帧区域。 您不仅可以显示一个较高的时间帧,还可以同时显示图表时间帧,加上更高的时间帧:显示嵌套时区。 供需双方所有交易者都会喜欢它。 :) 重要信息披露 高级供需的最大潜力,请访问 https://www.mql5.com/zh/blogs/post/720245   想象您的交易如何得以改善,是因为您能够精准定位入场或目标位吗? 构建于新的底层算法,它可以更轻松地识别出买卖双方之间的潜在失衡。 这是因为它以图形方式展示供需最强劲区域,及其过去的表现(显示旧区域)。 这些功能旨在帮助您更轻松地发现最佳入场区域和价位。 现在您可以针对您的交易品种和时间帧来优化和编辑区域强度! 高级供需指标适用于所有产品和时间帧。 它是一个新的公式,非常新的功能是两个区域强度函数可由用户输入进行调整! 这在交易中是一大优势。 当您学习如何使用专有功能,例如带有价格游离最小 X 因子的区域强度时,您能够判断该区域强劲与否。 供
Automated Trendlines
Georgios Kalomoiropoulos
5 (16)
趋势线是外汇交易中最重要的技术分析工具。不幸的是,大多数交易者没有正确绘制它们。自动趋势线指标是专业交易者的专业工具,可帮助您可视化市场的趋势运动。 有两种类型的趋势线看涨趋势线和看跌趋势线。 在上升趋势中,外汇趋势线是通过价格变动的最低摆动点绘制的。 连接至少两个“最低点”将创建一条趋势线。 在下跌趋势中,趋势线是通过价格走势的最高摆动点绘制的。 连接至少两个“最高点”将创建一条趋势线。 趋势线何时突破? 当看跌蜡烛收于看涨​​趋势线下方并且蜡烛的高点在趋势线上方时,看涨趋势线会被打破。 当看涨蜡烛收于看跌趋势线上方并且蜡烛的低点低于趋势线时,看跌趋势线会被打破。 趋势线何时删除? 当一根完整的蜡烛在看涨趋势线下方形成时,看涨趋势线将被删除。 当完整的蜡烛在看跌趋势线上方形成时,看跌趋势线将被删除。 您可以从输入参数更改看涨和看跌趋势线的颜色和宽度。
Order Block Hunter
Noha Mohamed Fathy Younes Badr
5 (6)
Order block hunter indicator is the best indicator for  hunt the order blocks that area where there has been a large concentration of limit orders waiting to be executed Order blocks are identified on a chart by observing previous price action and looking for areas where the price experienced significant movement or sudden changes in direction .This indicator does that for you by using very complicated codes and helps you to take the best areas To buy and sell because it make marks at the best a
TakePropips Donchian Trend Pro
Eric John Pajarillaga Aldana
4.44 (16)
TakePropips Donchian Trend Pro   (MT4) 是一款功能强大且有效的工具,可使用 Donchian 通道自动检测趋势方向,并为您提供进场和退场交易信号! 这个多功能指标包括趋势扫描器、交易信号、统计面板、筛选器、交易时段和警报历史仪表板。它旨在为您提供交易信号并节省您分析图表的时间! 您可以在我们的博文中下载用户手册和安装指南:   https   :// www.mql5.com/en/blogs/post/751368 今天立减 50%!价格从 98 美元降到 49 美元! 您可以在 Strategy Tester 上测试该指标(启用可视模式) 视频教程也可在说明下方获得更多详细信息。 如果您有任何问题或需要任何帮助,请与我联系。 TakePropips Donchian Trend Pro 指标适用于所有外汇对、金属、商品、指数和加密货币。 主要特点 交易信号 - 检测多个时间范围内所有货币对的买卖机会。它将为您提供警报并在图表上绘制交易信号,最多 3 个止盈价和一个止损价。 Trend Scanner   - 用于快速扫描和识别跨多个时间
Best Currency Strength Indicator
Tumelo Patrick Rakotsoane
4.59 (46)
Advanced Currency Strength Indicator The Advanced Divergence Currency Strength Indicator. Not only it breaks down all 28 forex currency pairs and calculates the strength of individual currencies across all timeframes , but, You'll be analyzing the WHOLE forex market in 1 window (In just 1 minute) . This indicator is very powerful because it reveals the true movements of the market.  It is highly recommended to  analyze charts knowing the performance of individual currencies or the countries ec
Allows multiple indicators to be combined into a single indicator, both visually and in terms of an alert. Indicators can include standard indicators, e.g. RSI, CCI, etc., and also Custom Indicators, even those purchased through Market, or where just have the ex4 file. An early alert is provided, say when 4 out 5 indicators have lined up, and a confirmed alert when all are in agreement. A‌lso features a statistics panel reporting the success of the combined indicator by examining the current cha
Currency Strength Exotics
Bernhard Schweigert
4.87 (30)
目前8折优惠! 对任何新手或专家交易者来说都是最好的解决方案! 这个指标是专门用来显示任何符号的货币强度,如异国货币对、商品、指数或期货。它是同类产品中的第一个,任何符号都可以添加到第9行,以显示黄金、白银、石油、DAX、US30、MXN、TRY、CNH等的真实货币强度。这是一个独特的、高质量的、负担得起的交易工具,因为我们已经纳入了一些专有的功能和一个新的公式。想象一下,你的交易将如何改善,因为你能够准确地确定新趋势或剥头皮机会的触发点? 用户手册:点击这里   https://www.mql5.com/en/blogs/post/708876 它适用于所有时间框架。你将很快能够看到TREND! 根据新的基础算法设计,它使识别和确认潜在交易变得更加容易。这是因为它以图形方式显示了8种主要货币和一种符号的强弱。 该指标显示了8种主要货币(澳元加元瑞士法郎欧元英镑日元新西兰美元)的强弱线,再加上一个符号! 该指标显示了符号的真实价值。例如:对于XAUUSD(黄金):价格以美元报价。如果黄金在上涨,你怎么能知道是黄金的强势还是美元的弱势?只有当黄金走强时,我们才会进行
GANN Master
Ivan Stefanov
基于甘氏久经考验的方法,甘氏的精确目标呈现在您面前。该工具旨在使交易更加顺畅和直观。通过向上拖动白线或向下拖动绿线,您将立即明白为什么甘氏的技术在交易世界中仍然具有影响力。 甘氏策略围绕着高度准确地预测市场走势,而该工具将这种力量带到了您的指尖。无论您是经验丰富的交易员还是新手,操作这些线条将为您提供深入的见解,了解为什么他的方法经得起时间的考验。 基于甘氏久经考验的方法,甘氏的精确目标呈现在您面前。该工具旨在使交易更加顺畅和直观。通过向上拖动白线或向下拖动绿线,您将立即明白为什么甘氏的技术在交易世界中仍然具有影响力。 甘氏策略围绕着高度准确地预测市场走势,而该工具将这种力量带到了您的指尖。无论您是经验丰富的交易员还是新手,操作这些线条将为您提供深入的见解,了解为什么他的方法经得起时间的考验。
訂閱指標注意事項 此信號只支援電腦版MT4 不支援MT5、手機、平板 指標只顯示當日進場箭頭 非直播指標顯示歷史箭頭 (直播為展示用) 指標為交易輔助性質 非EA自動交易 無跟單功能 指標只標示進場位置 無出場(止盈)指示 進場止損點位設定30-50 PIPS 或是前高前低做為防守 止損不需拉太遠 紅色箭頭為多方進場訊號 綠色箭頭為空方進場訊號 撐阻力強度用箭頭大小表示 此指標適用於波段策略 不適合當沖策略盤整 多空反轉時不適用 指標載入後 右下角都會預設顯示盤整 載入指標一小時後 才會顯示多空 加入Youtube頻道會員 可參加每個月一次實體抽獎活動(台灣以外地區,獎品折現金用Paypal匯出) 每月抽獎時間為非農數據公布當週的週末盤勢分析(2100) 得獎者必須抽獎時在線上,逾期不候
NAM Order Blocks
NAM TECH GROUP, CORP.
5 (1)
MT4多時限訂單塊檢測指示器。 特徵 -在圖表控制面板上完全可自定義,提供完整的交互。 -隨時隨地隱藏和顯示控制面板。 -在多個時間範圍內檢測OB。 -選擇要顯示的OB數量。 -不同的OB用戶界面。 -OB上的不同過濾器。 -OB接近警報。 -ADR高低線。 -通知服務(屏幕警報|推送通知)。 概括 訂單塊是一種市場行為,它指示從金融機構和銀行收取訂單。著名的金融機構和中央銀行帶動了外匯市場。因此,交易者必須知道他們在市場上正在做什麼。當市場建立訂單塊時,它會像發生大多數投資決策的範圍一樣移動。 訂單建立完成後,市場將朝著上升和縮小的方向發展。訂單大宗交易策略的關鍵術語是它包括機構交易者正在做的事情。由於它們是主要的價格驅動因素,因此包括機構交易在內的任何策略都可以。 您將在任何時間範圍內實時看到訂單塊,使用我們的控制面板,您將能夠在所選的歷史記錄週期內檢測常規,拒收和未大寫的訂單塊。 現在您可以接收到訂單塊接近警報,我們在MT4上顯示屏幕通知,並將通知推送到您的手機!
作者的更多信息
MetaTrader 4 终极黄金顾问 – 您通向成功的尖端交易工具! Ultimate Gold Advisor 不仅仅是一个简单的指标:它是将彻底改变您在 MetaTrader 4 上交易方式的 技术瑰宝 。专为满足最苛刻的交易者需求而设计,这款先进的指标结合了精准度、复杂分析和强大的功能,为您提供无与伦比的市场竞争优势。 Ultimate Gold Advisor 是交易黄金的理想选择,同时也适用于各种资产类别,它是 解锁您盈利潜力 的关键。 为什么 Ultimate Gold Advisor 是每个交易者的必备工具? 顶级性能 :该指标的胜率高达 89%,不仅可靠,而且极其有效。每笔盈利和亏损交易都清晰地显示在图表上,让您可以实时评估您的策略潜力,并根据此优化操作策略,以 数学般的精准度 最大化您的利润。 清晰即时的交易信号 :红色和蓝色的箭头精确标记交易信号,帮助您把握每一个市场机会,提供您所需的 及时性 。 实时点差监控 : Ultimate Gold Advisor 对价格的 每个波动 进行点差测量,帮助您以 精确度 计划交易。 先进的趋势检测技术 :该指标通过虚线标记关
Follow Line 指标是交易者用于准确识别和跟随市场趋势的重要工具。该指标动态适应价格变化,绘制一条平滑、连续的线来跟踪价格走势。凭借其视觉上的简洁性和有效性,能够提示趋势变化,Follow Line 是任何交易者策略中的绝佳补充。 主要特点: 趋势跟踪: Follow Line 紧随价格变化,使交易者能够轻松识别当前的市场趋势。 视觉简洁: 通过清晰明确的线条,即使是经验不足的交易者也能快速理解市场方向。 适应性强: 适用于各种时间框架和工具,适合从日内交易到波段交易的多种交易策略。 如何使用: 安装: 将 Follow Line 指标添加到您希望分析的金融工具的图表上。 设置: 根据您的交易策略调整指标参数。 趋势分析: 观察 Follow Line 线条以确定当前趋势方向。 交易机会: Follow Line 在趋势市场中特别有用。例如,在突破情境中,当价格超过重要的阻力或支撑位时,Follow Line 可以确认走势的有效性。这使交易者能够更加自信地把握价格波动的机会。
MetaTrader 5 免费点差指标 该指标提供了对MetaTrader 5上点差的详细分析,点差是交易者最重要的参数之一,因为它代表了资产的买价(Ask)和卖价(Bid)之间的差额。 该指标包括: 平均点差 :计算为当天观察到的最高点差和最低点差之间的平均值。 当前点差 :显示当前的市场点差。 最低点差 :显示当天达到的最低点差值。 最大点差 :显示当天达到的最大点差值。 该指标旨在提供对市场状况的清晰而即时的视图,帮助交易者更好地评估交易成本并识别任何可能影响其策略的点差变化。 如果您对我的产品感兴趣,建议您访问我的页面,您可以在那里找到: 专家顾问 : https://www.mql5.com/it/market/product/119456?source=Site+Profile 指标 : https://www.mql5.com/it/market/product/121443?source=Site+Market+MT5+Search+Rating006%3amarket+profile 希望点差指标对您有用。 您可以访问我的个人资料: https://www.mql5.
FREE
FREE Spread indicator for MetaTrader 4 this indicator includes: -average spread -current spread -minimum spread -maximum spread If you are interested in my products I recommend you visit my page where you can find: Experts Advisors:  https://www.mql5.com/it/market/product/119456?source=Site+Profile indicators:  https://www.mql5.com/it/market/product/120038?source=Site+Profile I hope the spread indicator will be useful to you. https://www.mql5.com/it/users/kappa05
FREE
Enhance Your Trading Strategies with the "Order Block" Indicator for MT4 Discover the "Order Block" Indicator: The "Order Block" Indicator for MT4 is designed to help you precisely identify order blocks in the market by marking the highs and lows of the order block candles. This powerful tool enables you to understand where large institutions place their orders, improving your ability to predict market movements. Key Features: Precise Order Block Detection: Automatically highlights the highs and
IMPORTANT: The indicator will remain at the price of $34.90 until the release of the update scheduled for July 16, 2024. The New Price will be $49.90 (taxes excluded) FVG indicator. If you are an SMC trader this indicator will be very useful to you, it automatically identifies the FVGs on the graph distinguishing them into 2 types: bearish FVGs and bullish FVGs (see the photos to understand better). This indicator works on any Timeframe and on any market you want to use it. If you are interested
Volume Profile Indicator for MT4 Gain a trading edge with the "Volume Profile" indicator for MetaTrader 4 (MT4). This advanced technical analysis tool allows you to precisely identify key support and resistance levels based on transaction volume. Easily visualize market areas of high interest, where trading volumes are highest, and use this information to make more informed trading decisions. Key Features: Clear and detailed visualization : The indicator displays volume histograms directly on th
Presentation of the "Color Range Indicator" The "Color Range Indicator" is a powerful technical analysis tool designed for the MT4 platform, perfect for traders who want a clear and immediate view of market trends. This indicator draws a colored line based on the current trend, making it easier to interpret price movements. Indicator Description: Green line : Indicates an uptrend. Use this signal to consider buying opportunities. Red line : Indicates a downtrend. Use this signal to consider sell
什么是"实时多指标"? "实时多指标" 是一款先进的交易工具,旨在简化和优化您的技术分析。这款革命性指标收集多个时间框架和技术指标的信号,并将它们显示在一个清晰易读的表格中。如果您希望在不必不断切换图表或手动分析每个指标的情况下获得完整和详细的市场视图,"实时多指标" 是您的理想解决方案。 为什么选择"实时多指标"? 多时间框架分析: "实时多指标" 允许您同时监控多个时间框架的市场。从M15到H4,这个指标清楚地显示了每个时间框架的趋势是上升还是下降,帮助您根据市场的整体视图做出明智的决策。 多个指标的集成: 该工具结合了多个关键技术指标的信号,如Parabolic SAR, MACD, SMA, ADX 和 CCI。无需分别分析每个指标,"实时多指标" 为您提供了全面而详细的概览,清晰地显示了多个时间框架中的趋势和买卖信号。 清晰的汇总表: "实时多指标" 的一个突出特点是其汇总表。此表清晰显示了每个时间框架中每个指标的买入或卖出信号,使市场状况一目了然,并使您能够迅速应对机会。 易于使用: 无论您的交易经验水平如何,"实时多指标" 都被设计为用户友好型。直观的界面和信息的有序呈现
从77.90美元降至37.90美元的折扣,优惠截止至9月1日星期日 什么是“Forex Scanner”? “Forex Scanner”是一个强大的交易工具,旨在为您提供实时的外汇市场全面概览。这个先进的指标从多个技术指标和时间框架中收集关键数据,让您能够快速识别交易机会。如果您希望在不切换图表的情况下监控众多资产和参数,“Forex Scanner”是您的完美解决方案。 为什么选择“Forex Scanner”? 多时间框架扫描: “Forex Scanner”允许您在不同的时间框架内监控市场,从分钟到小时不等。这个工具帮助您在多个时间层次上立即识别趋势和交易信号,让您基于完整和详细的市场视图采取行动。 **集成多个指标:**该指标集成了多种技术工具,如ATR、RSI、随机指标、ADX、枢轴点和移动平均线,为您提供每个资产的市场条件清晰而准确的视图。通过这种集成,“Forex Scanner”让您能够以更大的信心和精确度进行交易。 清晰而有信息量的显示: “Forex Scanner”的一大特色是其能够在一个有组织的屏幕上显示所有相关信息。无论您是在寻找支撑和阻力位信息,还是想评估
增强型RSI:更深入的技术分析混合指标 增强型RSI是一种多功能且可定制的技术指标,旨在为交易者提供更全面和准确的市场分析。通过结合移动平均线、RSI和MACD的最佳特性,该指标提供了动量和趋势强度的多维视角。 主要特点: 完美融合: 增强型RSI融合了移动平均线、RSI和MACD的功能,提供了更完整的价格走势视图。 最大灵活性: 通过可定制的周期,指标适应任何交易风格和时间框架。 多功能性: 它适用于任何金融资产,从外汇到加密货币、股票和指数。 分析支持: 增强型RSI不是自动交易系统,而是一个提供有用信号和确认的工具,以增强您的技术分析。 工作原理: 增强型RSI计算RSI的指数移动平均线,并将其与MACD的信号相结合。结果是一个振荡器,识别超买和超卖条件,发出背离信号并确认趋势。 优点: 更可靠的信号: 多指标的结合减少了错误信号的风险。 趋势反转的提前预测: 增强型RSI可以帮助比其他指标更早识别趋势反转。 自定义: 通过调整移动平均线周期、RSI水平和MACD参数,将指标定制为满足您的特定需求。 用途: 趋势识别: 增强型RSI帮助确认趋势方向并识别累积和分配阶段。 入场和出
外汇剥头皮指标 – 您在金融市场中赚钱的精确工具 MT4的外汇剥头皮指标是所有希望以最高精度进行市场剥头皮交易的交易者的完美助手。借助于对精确数据的分析,该指标为您提供及时且准确的信号,非常适合快速做出交易决策。 量身定制的精确度 图表上显示的每一个箭头都基于缜密的计算,提供最佳的进出机会。这些不是随机信号,而是基于实时市场分析的精确指示。 精准识别反转点 该指标能够高精度地识别价格潜在的反转点,使其成为您交易的必备工具。依靠可靠数据生成的信号,即使在市场最动荡的时期,您也能最大化利润。 简洁易读的界面 正如您在截图中所见,外汇剥头皮指标在图表上清晰地显示箭头,使得信号的读取和解释更加容易。无论您是捕捉微小波动还是等待更明确的信号,该指标都能保证您获得精确且即时的见解。 为什么选择外汇剥头皮指标? 基于精确数据的准确和可靠的信号 适合低时间框架的剥头皮策略 易于安装和配置到MT4上 适合各级交易者 立即获取外汇剥头皮指标,提高您的交易精确度!不要错过基于精确数据进行更明智操作的机会。
OB Indicator
Nicola Capatti
Order Block indicator, highs and lows; the indicator focuses mainly on OBs, on the chart they are represented with a horizontal line on the minimum and maximum of that candle. While for the maximums and minimums only one line is marked (see the images to understand better). The indicator is for MT5, it works on all Timeframes, on any Forex Pair, on any index and on crypto markets. (For any information on the indicator do not hesitate to contact me). Limited time discount (50%) 74.90$ -> 38.60$
ScalpingMarketEA
Nicola Capatti
Expert Advisor for scalping; This EA was built for monthly profitability. Works on any asset: Forex, Indices, Crypto and Stocks. Perfectly usable in MT5 tester and usable on any TimeFrame. The EA has various inputs available to customize operations: -Lots -Risk% (0 = Fix) -OrderDist (the distance between one order and another, the distance is calculated in points not pips) -TP (in points) -Sl (in points) -TrailingStopTrigger(the trailing stop trigger point in points) -TrailingStop(distance from
Highs, Lows and Bos Indicator for MT5; The indicator works on any type of market and on all TimeFrames. It also works on the MetaTrader5 Tester. the main function of the indicator is to identify the highs and lows by marking them with a point above/below the candle, then with a horizontal line it marks the Bos. It is very simple and intuitive, there are only 2 inputs: -the color of the maximums -the color of the minima For any other information do not hesitate to contact me.
Panel Info Trade For MT5; The indicator has 2 main objects: -An icon chart that you can change Timeframe, zoom, Forex Pair, crypto....the position of the graph can be modified via the (x;y) inputs. The chart is perfectly usable in the MT5 tester. If the graph isn't for you and doesn't help you with anything, you can press the button on the top right to make it smaller. -the second object is a dynamic control panel where you can change plots, place sl and tp, BE, close partial... (if you watch th
货币强度指数 (Currency Strength Index - CSI) 指标 在激活指标之前,请记得将"TRUE"设置为显示货币对 货币强度指数 (Currency Strength Index - CSI) 指标是外汇交易中用于衡量主要货币相对强度的强大工具。该指标帮助交易者识别在特定时间内最强和最弱的货币,从而使他们能够做出更明智的交易决策。 主要特点: 比较分析: 根据历史和当前数据比较不同货币的强度。 交易信号: 帮助识别基于相对强度的最佳货币对进行交易。 自定义: 用户可以配置计算周期和其他参数,以适应其交易策略。 直观显示: 以清晰和可视化的方式呈现信息,便于数据解释。 如何使用: 安装: 将CSI指标添加到所需货币对的图表中。 设置: 配置所需的参数,如计算周期。 分析: 观察货币强度线,识别那些强度增加或减少的货币。 交易: 使用这些信息做出交易决策,选择买入强势货币,卖出弱势货币。
In the world of trading, the key to success lies in having the right tools at the right time. Our innovative Volume Profile indicator was developed with one goal in mind: to provide traders with unprecedented access to vital market activity information. This cutting-edge tool allows you to not only see where and when volumes are traded but also to understand market depth with clarity never seen before. Main Features: Temporal Flexibility: Set the analysis range up to 1800 minutes to perfectly ma
Maximize Your Trading Opportunities with the "Auto Trendlines" Indicator Discover the "Auto Trendlines" Indicator: "Auto Trendlines" is the essential tool for every technical trader. This indicator automatically plots trend lines, pinpointing support and resistance levels with surgical precision. It's ideal for those looking to capitalize on market breakouts and reversals. Key Features: Automatic Trendline Plotting: Identifies and draws crucial trend lines without manual intervention. Advanced C
AutoFibo for MT5
Nicola Capatti
Optimize Your Trading Decisions with the "autoFibo" Indicator Discover the "autoFibo" Indicator: "autoFibo" is the essential analysis tool for traders who want to fully leverage Fibonacci levels without the hassle of manual plotting. This indicator automates the Fibonacci retracement process, providing instant visual access to key support and resistance zones. Key Features: Automatic Fibonacci Retracement: Automatically plots Fibonacci levels, making it easy to identify support and resistance zo
Enhance Your Trading Performance with the "Better Volume" Indicator Discover the "Better Volume" Indicator: The "Better Volume" is the essential market volume analysis tool for traders aiming to stand out. It analyzes tick volumes with unprecedented accuracy, featuring an advanced moving average function (PERIOD_MA) and customizable buy and sell alerts. Key Features: Advanced Volume Analysis: Recognize volume peaks signaling crucial price movements. Intuitive Buy and Sell Alerts: Stay one step a
SuperTrend 是交易中最有效且广泛使用的技术指标之一,非常适合识别趋势方向并生成进场和出场信号。基于波动性和趋势,该指标会动态适应市场条件,为交易者提供清晰的视觉参考。 主要特点: 趋势检测: SuperTrend 跟随市场趋势,在下跌趋势中绘制一条位于价格上方的线,在上涨趋势中绘制一条位于价格下方的线。 易于使用: 由于其直观的图形表示,即使是经验较少的交易者也可以轻松解读。 进场/出场信号: 当价格向上穿越 SuperTrend 线时生成买入信号,向下穿越时生成卖出信号。 适应性: 可在不同时间框架和工具上工作,使其成为从日内交易到波段交易的各种交易风格的多功能工具。 如何使用: 安装: 将 SuperTrend 添加到您要分析的金融工具图表中。 设置: 配置指标参数,如周期和倍数,以适应您的交易策略。 趋势分析: 观察 SuperTrend 线以确定当前趋势方向。 交易执行: 使用 SuperTrend 生成的信号做出交易决策。当 SuperTrend 位于价格下方时做多,当其位于上方时做空。 交易机会: SuperTrend 在趋势市场中特别有效。例如,在突破情境中,当
新的组合指标 - 3合1 你是否在寻找可以提升市场分析和投资策略的交易工具?我们将三个最好的指标组合在一个强大且便捷的解决方案中,使你在交易中获得最大的价值。 1. 订单块指标 (原价32.90$) 订单块指标是识别市场中机构兴趣区域的关键工具。该指标标记了订单块蜡烛的高点和低点,这通常代表了价格可能发生反转或趋势延续的关键区域。单独使用时,订单块指标帮助你识别潜在的支撑和阻力区域,从而提高你的交易决策能力。 链接: https://www.mql5.com/it/market/product/121633?source=Site+Market+MT5+Search+Rating006%3aorderblock+indicator 2. FVG指标 (原价34.90$) FVG指标旨在识别公平价值缺口(FVG),这些价格空隙可能表明供需不平衡。这些缺口通常被视为交易机会,因为价格通常会回到这些区域填补空白。FVG指标是希望精准把握这些价格波动的交易者必不可少的工具。 链接: https://www.mql5.com/it/market/product/119368?source=Sit
FVG for MT5
Nicola Capatti
“Fair Value Gap” (FVG) 指标 - 探索市场不平衡的力量 交易的世界充满了隐藏的机会,但只有拥有正确工具的人才能有效识别和利用这些机会。我们的 FVG 指标 旨在帮助您做到这一点。如果您是一位寻求提升市场分析能力并找到最佳进场和出场点的交易员,FVG 指标将是您完美的助手。 什么是 Fair Value Gap (FVG)? Fair Value Gap 的概念指的是供需之间的差异,这种差异在价格图表上形成了一个“缺口”。这个缺口代表了价格可能回调以填补这一不平衡的区域,使这些区域成为潜在的交易机会。这些缺口是在价格快速波动时形成的,可能是理解未来市场行为的关键。 为什么 FVG 指标必不可少? FVG 指标可以轻松帮助您在图表上识别这些不平衡区域,并突出显示价格可能回调以填补缺口的地方。这一信息对于任何交易策略都至关重要,因为它为交易员提供了识别可能发生回调或加速的关键价格水平的能力。 FVG 指标的主要特点 自动缺口识别: FVG 指标自动扫描图表以识别 Fair Value Gap,节省您的时间并减少人为错误的可能性。 清晰的视觉信号: 缺口区域在图表上被清晰
什么是“Schaff RSX”? “Schaff RSX”将相对强弱指数(RSX)的有效性与Schaff周期的精确性相结合,创造出一种独特的指标,帮助您轻松识别最佳的市场进出时机。这就像拥有一个能够检测隐藏交易机会的雷达,让您在竞争中脱颖而出,其他交易者根本无法忽视这一优势。 为什么选择“Schaff RSX”? 清晰直观的视觉简洁性 :“Schaff RSX”的颜色和线条会清楚地显示市场何时处于超买或超卖状态。不再依赖直觉或运气;您将拥有准确可靠的信息,尽在眼前。 完全可定制化 :每个交易者都有自己的策略,而“Schaff RSX”完美适应您的策略。您可以根据自己的喜好配置参数,准确获取您所需要的结果。 适用于每种交易风格 :无论您是日间交易者,还是偏好较长时间段的交易,“Schaff RSX”都能适应各种时间框架,从M1图表到日线图。 完整的交易工具 :通过结合Schaff周期和RSX,您将拥有一个更灵敏和反应迅速的指标,能够比其他工具更精确地捕捉市场动向。 “Schaff RSX”如何改善您的交易? 想象一下,您可以提前识别趋势反转,准确知道市场何时处于极端状态,并通过额外的确定
MetaTrader 5 的"Positions Manager" 是一个必不可少的工具,适用于那些希望高效自动化管理头寸的交易者。这个高级工具旨在帮助交易者控制他们的操作,改善风险管理,并通过 Break Even 和 Trailing Stop 等功能最大化潜在利润。 主要功能: 自动 Break Even: 通过激活 Break Even 的选项,"Positions Manager" 允许您在市场对您有利时保护利润。您可以配置激活所需的点数,并添加额外的点数以覆盖佣金。 动态 Trailing Stop: 激活 Trailing Stop 以跟随市场动向并保护您的收益。该功能会自动根据价格波动进行调整,使交易者能够在市场有利时保持头寸开启,并在趋势逆转时自动关闭。 完全自定义: Break Even 和 Trailing Stop 设置完全可自定义。交易者可以设置激活所需的点数,并根据他们的特定交易策略调整参数。 直观界面: 用户界面简单易用,选项清晰,布局方便快速访问所有功能。"Positions Manager" 无缝集成到 MT5 环境中,提供流畅、无缝的交易体验。 为什
Smart Fractals 指标 - 一个强化的 Fractal 用于您的 MT5 交易 Smart Fractals 是您熟悉并在图表中使用的经典 Fractal 指标的进化版。专为 MetaTrader 5 设计,此指标不仅仅是识别市场的经典反转点,它更进一步,使您的交易更加高效和盈利。我们采用了基本的 Fractal 概念,并将其转变为更智能、更功能化的工具。 主要特点: 买入和卖出信号:除了传统的 Fractal 指标外,Smart Fractals 包含明确的买入和卖出信号,这些信号通过图表上的黄色和紫色箭头可视化展示。这些信号使您更有信心进入交易。 改善的可视化:每个 Fractal 都以清晰直观的方式显示,通过可定制的颜色区分 "向上" 和 "向下" Fractal。此外,市场结构突破 (BOS) 实时显示,以确认方向的有效性。 可定制的颜色和风格:您可以通过各种颜色和样式选项将指标调整为符合您的视觉偏好。正如图片中所示,指标可配置,使图表分析更加清晰和快速。 多功能性和精确性:可在任何时间框架和所有主要资产(外汇、指数、加密货币等)上使用,为您提供精确和更新的信号。
筛选:
无评论
回复评论