• 概述
  • 评论 (1)
  • 评论 (14)
  • 新特性

Dynamic Zigzag Levels

5

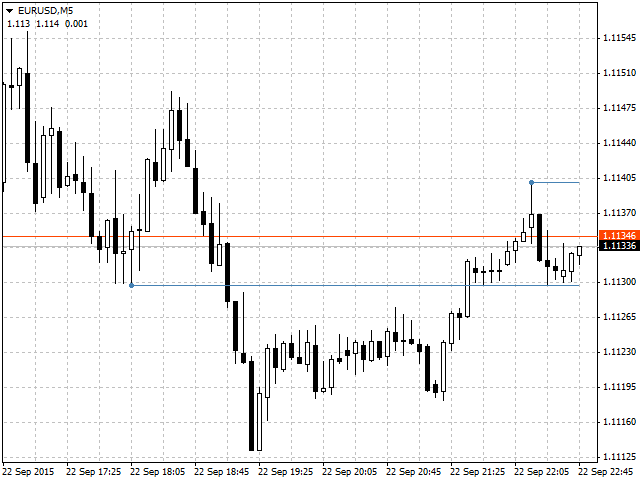
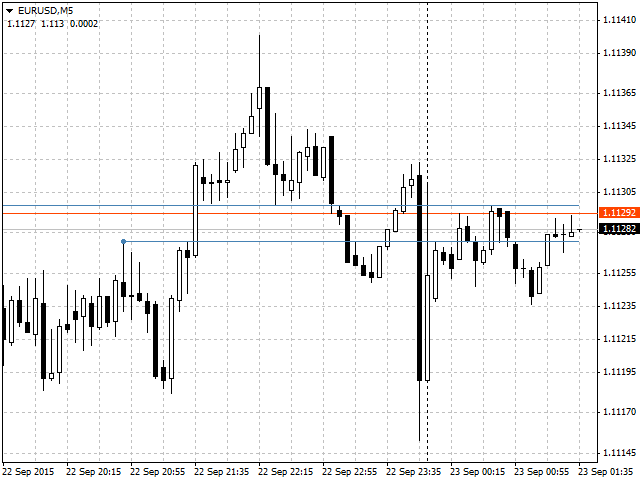
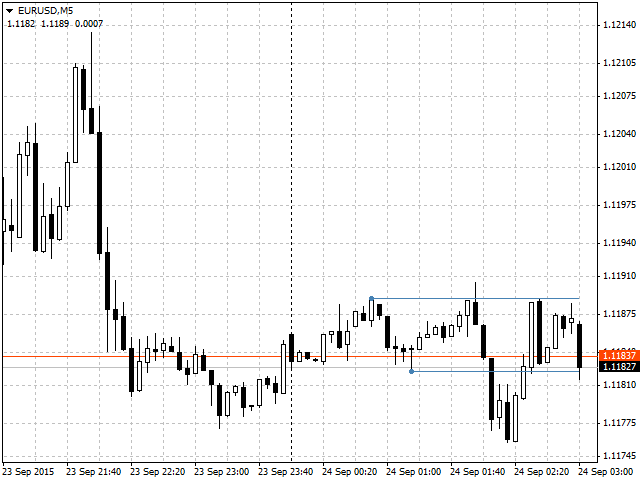
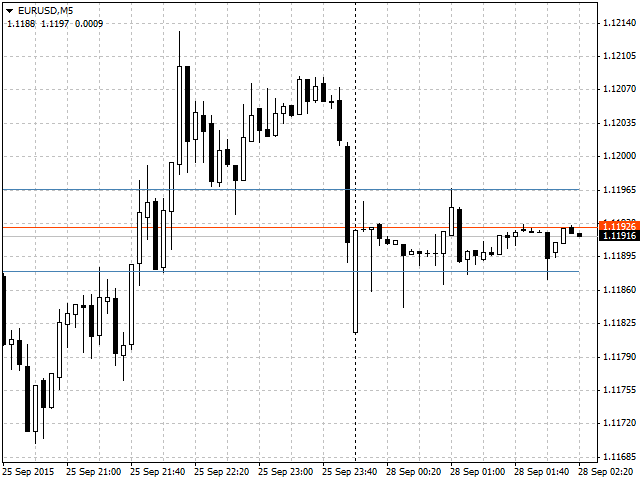
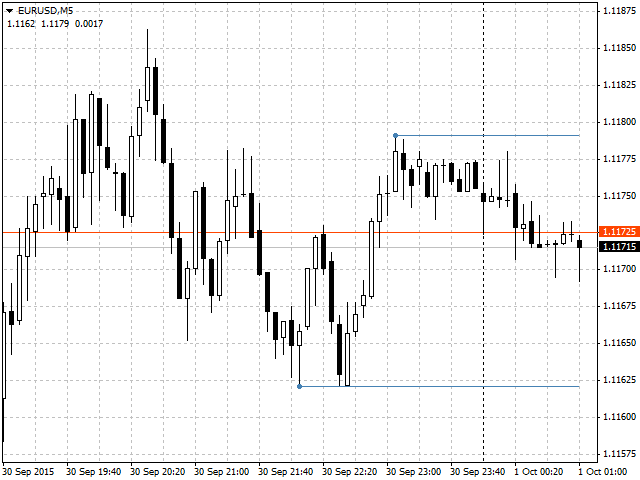
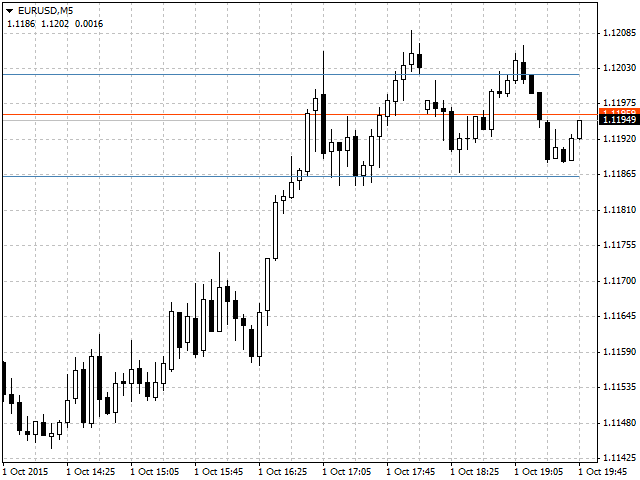
The indicator displays two nearest levels in real time. The one above the current BID price is a resistance level. The one below the current BID price is a support level.

The levels are calculated by the standard ZigZag indicator.


Application

The indicator can be used as an assistant in manual trading to obtain data on the nearest support/resistance levels.

The indicator can be used on any timeframe.

When a displayed level is touched or broken through, an audio alert is triggered (specified in the settings).
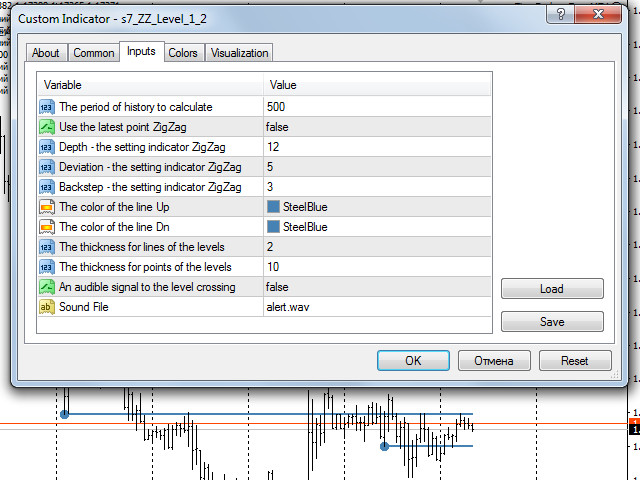

Settings

  • The period of history to calculate = 500 - history period, within which the levels (in bars) are searched for
  • Depth - the setting indicator zigzag = 12 - ZigZag indicator parameter
  • Deviation - the setting indicator zigzag = 5 - ZigZag indicator parameter
  • Backstep - the setting indicator zigzag = 3 - ZigZag indicator parameter
  • The color of the line Up = SteelBlue - Up line color
  • The color of the line Dn = SteelBlue - Dn line color
  • The thickness for lines of the levels
  • The thickness for points of the levels
  • An audible signal to the level crossing = false - enable the level crossing audio alert
  • Sound File = "alert.wav" - select a sound file for the audio alert
评论 1
ZJYY9788
160
ZJYY9788 2020.08.09 13:39 
 

This is an awesome indicator, one of a kind actually, I've been looking everywhere for it and now I found it. Thank you so much!

推荐产品
FiboZag
Andriy Sydoruk
Indicator FiboZag - transfer the indicator to the chart and the Fibonacci levels will be built automatically on the last ZigZag turn. The main advantage lies in the correct construction of Fibonacci levels and markup of price levels. Simple, visual and effective use. The indicator is not redrawn and does not lag. Works on all currency pairs and on all timeframes.
Pivot Points MT4
KEENBASE SOFTWARE SOLUTIONS
KT Pivot Points automatically plots the daily, weekly, and monthly pivot levels on a chart with the precise calculation based on the latest data. Pivot points is a widely used indicator in technical analysis, particularly in the Forex market. Features Send alerts when the price touches the pivot level.  It offers complete customization for each kind of pivot level.   Shows daily, weekly, and monthly pivot levels without any fuss. It uses minimum CPU resources for faster calculation. Compati
Magic Pivot
Evgeny Belyaev
Magic Pivot is a professional indicator for finding the support and resistance lines; it has been developed by a group of professional traders. The indicator plots three support lines and three resistance lines, where a price reversal is highly probable. Magic Pivot is an excellent tool for scalping and intraday trading.   Advantages High accuracy of signals. Suitable for scalping and intraday trading. The indicator does not redraw. Simple indicator setup, minimum parameters. Works on any finan
Pivots MT4
Denis Luchinkin
Pivots MT4 - Простой и удобный индикатор уровней pivot , рассчитывает уровни по методам  Classic , Fibonacci , DeMark , Camarilla , WooDie , Central Pivot Range . Индикатор выгодно отличается следующим Рассчитывает уровни pivot по методам  Classic ,  Fibonacci ,  DeMark ,  Camarilla ,  WooDie ,  Central Pivot Range ; Выводит на графике текущие уровни и уровни на предыдущих периодах; Выводит на графике выбранные метод и период, названия уровней и их ценовые значения. Параметры Pivot Method - Вып
AutoPivot
Hafis Mohamed Yacine
This indicator will draw monthly, weekly, and daily pivot. Pivot line will be calculated automatically again when the period ends. Auto Pivot Metatrader 4 Indicator The Auto Pivot indicator for Metatrader 4 automatically updates the pivot point (PP), support (S1,S2,S3) and resistance levels (r1,r2,r3) every day. Price above the pivot point means positive while price below the pivot point means negative. S3 indicates extremely oversold while price above resistance r3 means extremely overbought.
Key level wedge pro
Presley Annais Tatenda Meck
5 (1)
We have combined all of our beloved indicators the likes of: Key level order block , Key level supply and demand , Key level liquidity grab and Key level wedge into one single indicator and dashboard. Whats new Dashboard : There is an easy access dashboard for all your needs. Multi-timeframe button : There is now a multi-timeframe option for Order Blocks and Supply and demand zones, making it easy to see higher timeframe zones easily on the current timeframe by just clicking the desired timefr
The Auto Super Pivot indicator is an indicator designed to calculate support points and resistance points for pivot points. this indicator has the ability to calculate standard pivot, fibonacci, camarilla, woodie and demark pivot points. It also allows you to use all time zones with the time frame feature. Another feature of the indicator is the auto time slice feature. This feature allows automatic calculations without having to set any time zone. Features 6 different pivot calculation modes
Supply Demand Zone Pro Indicator works with all products and timeframes. It is using a new calculation method, and now you can select the desired zone on any timeframe! Strongest Zones are already enabled by default This is a great advantage in trading.This indicator has a built in backtester enabled by default, just move the chart. Supply and Demand ? Supply is a price zone where sellers outnumbered buyers and drove the price lower. Demand is a price zone where buyers outnumbers sellers and
KT Auto Trendline MT4
KEENBASE SOFTWARE SOLUTIONS
KT Auto Trendline draws the upper and lower trendlines automatically using the last two significant swing highs/lows. Trendline anchor points are found by plotting the ZigZag over X number of bars. Features No guesswork requires. It instantly draws the notable trendlines without any uncertainty. Each trendline is extended with its corresponding rays, which helps determine the area of breakout/reversal. It can draw two separate upper and lower trendlines simultaneously. It works on all timefr
Year2Year
Stanislav Korotky
This indicator shows price changes for the same days in past years. D1 timeframe is required. This is a predictor indicator that finds D1 bars for the same days in past 8 years and shows their relative price changes on the current chart. Parameters: LookForward - number of days (bars) to show "future" price changes; default is 5; Offset - number of days (bars) to shift back in history; default is 0; ShowAverage - mode switch; true - show mean value for all 8 years and deviation bounds; false - s
FREE
Pivot Pro
Igor Semyonov
Description Pivot Pro  is a universal color indicator of the  Pivot Points  levels systems. You can select one of its three versions:  Standard   Old , Standard New  and  Fibo . The system will automatically calculate the  Pivot Point  on the basis of market data for the previous day ( PERIOD_D1 ) and the system of support and resistance levels, three in each. It can also display price tags for each level. You can color the indicator lines. Only a method of calculation of the third level of supp
Fibonacci Auto Levels
Mohamed yehia Osman
Possible Price reversals levels - based on  Fibonacci + Support +  Resistance Levels Auto levels drawn based on input index (Bars Count )  ---->>> Price Over 50% Fibo line ---> UP TREND ---> BUY when price drop near Support Lines  ---->>> Price Down 50% Fibo line ---> DOWN TREND ---> SELL when price goes up  near Resistance Lines  --->>> The more close price levels ----> the more possibility for price reversals --->>> are you a scalper --> try it on M1 charts with big index like 5000 bars  or
Provides instant signals on the chart in panel form. Equipped with signal description and trading analysis tools such as drawing auto trendlines, support/resistance area, regression channel, Fibonacci levels, Pivot levels and current signal price, signal time, signal expiry and stoploss recommendation. Also sending alert messages to all available mt4 alert tool. A detailed description panel provides information about where the signal comes from and what indicators are behind the signal. Includin
Limit Map AM
Andriy Matviyevs'kyy
This indicator is a system of channels based on the minimum and maximum price values. The task of the indicator is to visualize the trend direction and support/resistance lines. The indicator is designed to be used in combination with indicators of the "Signal" or "Candles" series (a lot of free indicators of this type can be found on my page). At the same time, the indicator can be used independently according to the following rules: Buy/Sell signals are used to open a position only in the dire
The PUA MultiType Pivot indicator is built on the daily chart of the previous day. The PUA MultiType Pivot indicator is one of the most popular tools in technical analysis, used by traders to identify potential reversal points in financial markets. This indicator constructs three types of Pivot points: Classic, Fibonacci, and Camarilla, each offering its unique approach to market analysis. The advantages of this indicator include: Simplicity and Clarity PUA MultiType Pivot provides clearly defi
5TT Pivot Lines is a visual display of pivot lines. These are primarily support and resistance points with the 'Blue' Pivot Point. Pivot points are useful for determining key levels for entry or exits (setting targets and stop loss levels). Having these support & resistance lines visually displayed on the chart is very useful for intraday traders. 5TT Pivot Lines come with some user-friendly settings to decide if to display the lines or connectors on the chart Settings CandlesBack: This gives th
VJ Pivot Levels
Vijayaratna Kumar Boda
4.33 (3)
Introduction: Whatever trading method you use, it is important to know the Pivot levels to take the key attention for your entries & exits. This indicator has been made using the standard classic formula for Auto drawing the Pivot levels. Also based on the previous day trading range, the probable expected today trading range has been highlighted in a different color for your reference. Output of the Indicator: This Indicator gives the Pivot level Different resistance Levels Different Support l
Capital Pivot
Mr Nisit Noijeam
Pivot Points และระดับ (Support) และ(Resistance) บนแผนภูมิการเทรดใน MetaTrader 4 สำหรับตลาด Forex : คำนวณ Pivot Points : สคริปต์คำนวณจุด Pivot โดยใช้ข้อมูลราคาประวัติศาสตร์ เช่น ราคาเปิด, ราคาสูงสุด, ราคาต่ำสุด, และราคาปิด จากช่วงเวลาที่กำหนด (เช่น วัน, ชั่วโมง, ฯลฯ) จุด Pivot และระดับต่างๆ เช่น R1, R2, R3 (ระดับการต้านทาน) และ S1, S2, S3 (ระดับการสนับสนุน) ถูกคำนวณออกมา แสดงบนแผนภูมิ : หลังจากคำนวณจุด Pivot และระดับต่างๆ, สคริปต์จะแสดงเส้นเหล่านี้บนแผนภูมิ MT4 เพื่อช่วยให้นักเทรดสามารถเห็นจุดที่
Created by imjesstwoone and mickey1984, this trade model attempts to capture the expansion from the 10:00-14:00 EST 4h candle using just 3 simple steps. All of the information presented in this description has been outlined by its creators, all I did was translate it to MQL4. All core settings of the trade model may be edited so that users can test several variations, however this description will cover its default, intended behavior using NQ 5m as an example. Step 1 is to identify our Price Ra
Indicator Support and Resistence plain in your chart seven lines; Red line=Resistence 3. Red line=Resistence 2. Red line=Resistence 1. Yellow line= Pivot. Green line= Support 1. Green line= Support 2. Green line= Support 3. adattable in all timeframe (minute 1, minute   5, minute   15, minute   30, Hour 1, Hour 4,Day 1,Week 1,Mounth 1); Buy under support and sell over the resistence;
Индикатор  уровней поддержки и сопротивления отлично показывает на графике все силовые уровни от всех таймфреймов. Рекомендую торговать уровни старших таймфреймов. Индикатор на текущем таймфрейме обновляться как только на графике  появится новый сетап  The indicator of support and resistance levels perfectly shows all power levels from all timeframes on the chart. I recommend trading higher timeframe levels. The indicator on the current timeframe is updated as soon as a new setup appears on the
Super support and resistance
Peter Francois J Thijs
This support and resistance indicator gives u a)support level b)resistance level c)direction(trend) all in one.The indicator is based on the top 3 best levels there are!Red dots are sell direction and green dots are buy direction,if candles dont break these levels u get in after the 3rd dot,always use higher time frames from h1 up so its more clear where direction is going,also u can set the indicator to your time frame that u are lookin at.
Apollo BuySell Predictor 是一个包含多个模块的专业交易系统。该指标为交易者提供价格突破区、基于斐波那契的支撑和阻力位、趋势反转线、交易量信号、回调和任何交易者每天都需要的其他有用功能。该系统将适用于任何一对。推荐的时间框架是 M30、H1、H4。尽管该指标可以与其他时间范围一起使用,但 H4 以上的时间范围除外。 该系统是通用的,因为它提供了任何交易者成功交易所需的一切。该系统可以多种方式使用。该指标可用于日内交易、波段交易甚至剥头皮交易。无论您喜欢哪种交易方式,系统都会帮助您以真实的形式看待市场。所有系统信号都不会被重绘! 您可以根据您的交易偏好和任务启用/禁用各种系统模块。系统提供所有类型的通知,包括PUSH通知。您可以打开/关闭您需要的通知。 购买后请给我发电子邮件。我将与您分享交易说明和重要的红利指标,它们将使您的交易更加有利可图!
The price is moving between two curve tunnel lines in a trend. The two lines of a tunnel represent support and resistance. In an uptrend, for instance, a trade might be entered at the support of the trend line (shown by the red line in the chart) and exited at resistance of the upper tunnel line (shown by the blue line). Tunnel show trend direction for any timeframe (if you have enough bars on the chart for higher timeframes). Trend, or price tunnel, can be up, down or sideways. If the current p
MetaTrend M4
Vahidreza Heidar Gholami
Meta Trend Indicator is an efficient way to forecast and detect the trend in any market. It reveals the trend, support and resistance levels, volatility and the maximum potential target, all in one indicator. To adapt to the price and to decrease consecutive trend failures, the internal trend detector algorithm studies the market and dynamically chooses the right values for the internal parameters. This indicator is a perfect trend filter for any strategy or expert advisor. Features Super Adapti
Trend formation channel is a set of lines. The two central lines of the indicator represent moving averages of the specified type and period, they also form a small channel. The large channel is formed - the central lines of the indicator plus / minus the standard deviation estimate, multiplied by the coefficient selected by the user. The basic rule for plotting is that about 5% of prices should be outside these lines, and 95% - inside. If the price crosses the upper or lower line too often, th
什么是枢轴? 支点是预先知道的重要价格水平,交易者认为这很重要,并可能在该水平附近做出交易决策。作为技术指标,支点价格类似于阻力位或支撑位。如果超出枢轴水平,则价格将继续朝该方向发展。否则价格可能会反转至或接近该水平。 枢轴告诉您什么? 有枢轴和枢轴点。这些术语对不同的人可能意味着不同的事情。 枢轴点是计算的级别。场内交易者最初使用枢轴点来确定重要的价格水平,现在,许多交易者将其用于盘中交易。在分析了该工具的历史价格中的数据之后,枢轴点被用作指导价格如何变化的指南。其他计算提供了围绕枢轴点的支撑和阻力水平。枢轴点可以基于各种时间范围进行计算,因此可以为日间交易,摆动交易者和投资者提供信息。 Winshots枢轴水平指示器为日间交易提供信息。 当价格高于枢轴点时,则被视为看涨;当价格低于枢轴点时,则被视为看跌。计算出高于枢轴点的水平,并称为R1,R2和R3,其中R代表阻力。计算出枢轴点以下的水平,并将其称为S1,S2和S3,其中S表示支撑。 如果价格跌至枢轴点以下,则价格可能会继续至S1。如果价格跌至S1以下,则可以继续至S2。如果价格跌至S2以下,则价格可以继
Troopers
Oleksii Ferbei
All the points of intersection of the Troopers indicator will be points at which the trend direction changes. Sharp price fluctuations are ignored as well as noise around average prices. Signal points, where the color changes, can be used as potential market reversal points. The indicator tracks the market trend with very high reliability. This development can be used both for long-term trading and for pipsing on small periods. The indicator algorithm implements a kind of technical analysis base
Gold Indicator
Ahmed Alaaeldin Abdulrahman Ahmed Elherzawi
5 (1)
This indicator uses horizontal lines to identify support and resistance levels based on Zigzag legs and On-Balance Volume (OBV) analysis. Here is a summary of how the indicator works: Resistance and Support Lines : A horizontal line above the current price level indicates resistance. A horizontal line below the current price level indicates support. Drawing Horizontal Lines : Draw horizontal lines on every Zigzag leg within the last X legs, where X is a specified number (e.g., 10). Only the most
FREE
Classic Fractals indicator for MT4, with additional Trendlines connecting the latest couples of fractals ( fractals are showing highest high, and lowest low on each period) Rules for trendlines: -if new top fractal is below the last one = new resistance line -if new bot fractal is above the last one = new support line -Trendlines can be hidden -Fractals can be hidden Fractal Period = can be both even or uneven number, as it is setting for half (one side) of the bars sequence
该产品的买家也购买
Gann Made Easy
Oleg Rodin
4.84 (58)
Gann Made Easy 是一个专业且易于使用的外汇交易系统,它基于使用先生理论的最佳交易原则。 W.D.江恩。该指标提供准确的买入和卖出信号,包括止损和获利水平。您甚至可以使用推送通知在旅途中进行交易。 购买后请联系我!我将免费与您分享我的交易技巧和丰厚的红利指标! 您可能已经多次听说过江恩交易方法。通常 Gann 的理论不仅对于新手交易者而且对于那些已经有一定交易经验的人来说都是非常复杂的东西。这是因为江恩的交易方法在理论上并不那么容易应用。我花了几年时间来完善这些知识,并将最好的原则应用到我的外汇指标中。 该指标非常易于应用。您所需要的只是将其附加到您的图表并遵循简单的交易建议。该指标不断进行市场分析工作并寻找交易机会。当它检测到一个好的入口点时,它会为您提供一个箭头信号。该指标还显示止损和获利水平。 换句话说,当您像先生一样进行交易时,该指标会为您提供最佳江恩建议。江恩亲自告诉你此时此刻该做什么。但最好的部分是您不需要了解任何有关江恩交易原则的知识,因为该指标会为您完成整个市场分析工作。
Atomic Analyst
Issam Kassas
5 (2)
首先值得强调的是,该交易指标是非重绘、非延迟的指标,这使其成为手动和机器人交易的理想选择。 用户手册:设置、输入和策略。 Atomic Analyst是一种PA价格行动指标,利用价格的力量和动量来寻找市场上更好的机会。配备了高级过滤器,可帮助去除噪音和假信号,并提高交易潜力。使用多层复杂的指标,Atomic Analyst扫描图表,并将复杂的数学计算转化为任何初学者都能理解并用来做出一致交易决策的简单信号和颜色。 “Atomic Analyst”是专为新手和经验丰富的交易者量身定制的综合交易解决方案。它将高级指标和一流功能融合为一体的交易策略,使其成为所有类型交易者的多功能选择。 日内交易和剥头皮策略:专为快速准确的日内交易和短期交易而设计。 日内和摆动交易策略:可用作追求价格大幅波动的日内和摆动交易者的可靠工具。 多货币和市场:凭借其可靠的精度,在不同的工具和市场上运作。 多个时间框架:可在多个时间框架上使用,性能良好。 稳定性:所有指标均不重绘、不重绘和不滞后,确保可靠的信号。 信号清晰度:提供箭头信号,用于清晰的入场和出场点。 实时警报:通过交易入场、SL和TP警报通知交
Trend Punch
Mohamed Hassan
5 (13)
This indicator is unstoppable when combined with our other indicator called  Support & Resistance . After purchase, send us a message and you will get it   for  FREE as a BONUS! Introducing Trend Punch , the revolutionary forex trend indicator that will transform the way you trade! Trend Punch is uniquely designed to provide precise buy and sell arrows during strong market trends, making your trading decisions clearer and more confident. Whether you're trading major currency pairs or exotic sym
Scalper Inside PRO
Alexey Minkov
4.69 (49)
An exclusive indicator that utilizes an innovative algorithm to swiftly and accurately determine the market trend. The indicator automatically calculates opening, closing, and profit levels, providing detailed trading statistics. With these features, you can choose the most appropriate trading instrument for the current market conditions. Additionally, you can easily integrate your own arrow indicators into Scalper Inside Pro to quickly evaluate their statistics and profitability. Scalper Inside
FX Power MT4 NG
Daniel Stein
5 (12)
通过 mql5 和 Telegram 上 的晨间简报获取每日市场更新,包括详细信息和屏幕截图 ! FX Power MT4 NG 是我们长期以来非常受欢迎的货币强度计算器 FX Power 的下一代产品。 这款下一代强度计算器能提供什么?您所喜爱的原版 FX Power 的所有功能 附加功能 黄金/XAU 强度分析 更精确的计算结果 可单独配置的分析周期 可自定义计算限制,以获得更好的性能 为希望查看更多信息的用户提供特殊的多实例设置 无尽的图形设置,可在每个图表中设置您最喜欢的颜色 无数的通知选项,让您再也不会错过任何重要信息 采用 Windows 11 和 macOS 风格的全新圆角设计 神奇的移动指标面板 FX Power 主要功能 所有主要货币的完整强势历史 所有时间框架内的货币强弱历史 所有经纪商和图表的计算结果完全相同 100% 可靠的实时计算 -> 无重绘 可通过下拉列表选择分析时段 通过自定义模式单独配置分析时段 可在一个图表中使用多个实例 可移动 FX Power 显示屏(通过拖放) 适用于高分辨率 QHD、UHD 和 4K 显示器 自动终端配置 针对平板电脑
TPSproTREND PrO
Roman Podpora
4.79 (19)
TPSpro TREND PRO 是一个趋势指标,可以自动分析市场并提供有关趋势及其每次变化的信息,并给出进入交易的信号而无需重新绘制! 该指标使用每根蜡烛,分别对其进行分析。指不同的脉冲——向上或向下脉冲。货币、加密货币、金属、股票、指数交易的准确切入点! MT5版本                 指标的完整描述   我们建议将其与 指示器 -   RFI LEVELS 一起使用 主要功能: 准确的输入信号,无需渲染! 如果出现信号,它仍然相关!这是与重提指标的一个重要区别,重提指标可以提供信号然后改变信号,这可能导致存款资金的损失。现在您可以以更高的概率和准确度进入市场。还有一个功能是在箭头出现后为蜡烛着色,直到达到目标(止盈)或出现反转信号。 显示止损/获利区域 为了提高搜索切入点时的视觉清晰度,创建了一个模块,该模块最初显示买入/卖出区域,在该区域中搜索进入市场的最佳点。用于处理止损水平的附加智能逻辑有助于随着时间的推移减小其大小,从而降低进入交易(移动 sl)时的初始风险。 显示较高时间范围内的最小值/最大值(MTF 模式) 添加了一项功能,可以显示较高时间间隔的最小
TPSpro RFI Levels
Roman Podpora
4.8 (20)
Trend Pulse
Mohamed Hassan
5 (2)
Please contact me after purchase to immediately get your PDF strategy + documentation for Trend Pulse !  Official release price of $89  (1 /50 copies left). Next price is $199 . Introducing Trend Pulse , a unique and robust indicator capable of detecting bullish, bearish, and even ranging trends! Trend Pulse uses a special algorithm to filter out market noise with real precision. If the current symbol is moving sideways, Trend Pulse will send you a ranging signal, letting you know that it'
Currency Strength Wizard
Oleg Rodin
4.91 (35)
货币强度向导是一个非常强大的指标,为您提供成功交易的一体化解决方案。该指标使用多个时间范围内所有货币的数据来计算这个或那个外汇对的力量。此数据以易于使用的货币指数和货币电力线的形式表示,您可以使用它们来查看这种或那种货币的力量。 您所需要的只是将指标附加到您要交易的图表上,该指标将向您显示您交易的货币的真实强度。该指标还向您显示买卖量压力的极值,您可以在顺势交易时利用这些压力。该指标还显示了基于斐波那契的可能目标。该指标可用于各种交易时间范围。该指标支持各种货币对的交易。 该指标为您提供所有类型的警报,包括推送通知。 购买后请联系我。我将与您分享我的交易技巧,并免费为您提供丰厚的红利指标! 祝您交易愉快,获利丰厚!
首先,值得强调的是,这个交易工具是非重绘、非重画和非滞后的指标,非常适合专业交易。 在线课程,用户手册和演示。 智能价格行动概念指标是一个非常强大的工具,既适用于新手,也适用于经验丰富的交易者。它将超过20个有用的指标合并到一个指标中,结合了高级交易思想,如内圈交易员分析和智能资金概念交易策略。该指标侧重于智能资金概念,提供有关大型机构交易方式的见解,帮助预测它们的动向。 它在流动性分析方面尤其擅长,有助于理解机构的交易方式。它擅长预测市场趋势,并仔细分析价格波动。通过将您的交易与机构策略对齐,您可以更准确地预测市场走向。该指标多才多艺,擅长分析市场结构,识别重要的订单区块,并识别各种模式。 它擅长识别BOS和CHoCH等模式,理解动量的转变,并突出显示供需强劲的关键区域。它还擅长发现强大的不平衡,并分析价格创造更高高点或更低低点的模式。如果您使用斐波那契回撤工具,该指标可以满足您的需求。它还可以识别相等的高点和低点,分析不同的时间框架,并通过仪表板显示数据。 对于使用更高级策略的交易者,该指标提供了工具,如公平价值差指标和优惠和折扣区域的识别。它特别关注高时间框架订单
Advanced Currency Strength28 Indicator
Bernhard Schweigert
4.91 (607)
目前26%的折扣 任何新手或专家交易者的最佳解决方案! 这个指标是一个独特的、高质量的、可负担得起的交易工具,因为我们纳入了一些专有的功能和一个新的公式。只需一个图表,你就可以读出28个外汇对的货币强度!想象一下,你的交易将如何得到改善,因为你的交易是在你的手中进行的。想象一下,你的交易将如何改善,因为你能够准确地确定新趋势或剥头皮机会的触发点? 用户手册:点击这里  https://www.mql5.com/en/blogs/post/697384 这是第一本,原版的! 不要买一个毫无价值的崇拜者的克隆品。 特别的 子窗口中的箭头显示强劲的货币势头GAP将指导你的交易! 当基础货币或报价货币处于超卖/超买区域(外盘斐波那契水平)时,在个人图表的主窗口中出现警告信号。 当货币力量从外围区间回落时,回撤/反转警报。 十字星模式的特别警报 可选择多个时间框架,以快速查看趋势! 货币强度线在所有的时间框架中都非常平稳,当使用较高的时间框架来识别总体趋势,然后使用较短的时间框架来确定精确的入口时,效果非常好。你可以根据自己的意愿选择任何时间框架。每个时间框架都由其自身进
Quantum Trend Sniper Indicator MT4
Bogdan Ion Puscasu
4.58 (31)
介绍   量子趋势狙击指标 ,突破性的 MQL5 指标,正在改变您识别和交易趋势反转的方式!由拥有超过13年交易经验的资深交易员团队开发,     量子趋势狙击指标   旨在通过其创新的方式以极高的准确度识别趋势反转,将您的交易之旅推向新的高度。 ***购买量子趋势狙击指标,即可免费获得量子突破指标!*** 当量子突破指标识别出趋势反转时,它会向您发出警报和信号箭头,并建议您三个止盈水平。 它既适合新手交易者,也适合专业交易者。 量子 EA 通道:       点击这里 MT5版本:       点击这里 建议: 时间范围:  所有时间范围。为了获得最佳结果,我们建议在 M15、M30 和 H1 时间范围内使用它。 货币对:欧元兑美元、英镑兑美元、澳元兑美元、欧元兑英镑, EURAUD, XAUUSD 账户类型:ECN、Raw 或 Razor,点差极低 经纪时间:任意 经纪商:IC Markets、Pepperstone with Raw 和 Razor 的点差最低 建议止损:50 点 建议止盈水平:20 点、50 点和 1
RelicusRoad Pro
Relicus LLC
4.54 (80)
现在$ 147(更新后增加到$ 499) - 无限帐户(PC或Mac) RelicusRoad 用户手册 + 培训视频 + 访问 Private Discord Group + VIP 身份 一种看待市场的新方式 RelicusRoad 是世界上最强大的外汇、期货、加密货币、股票和指数交易指标,为交易者提供保持盈利所需的所有信息和工具。我们提供技术分析和交易计划,帮助每一位交易者取得成功,从初学者到高级。它是一个关键的交易指标,可以提供足够的信息来预测未来的市场。我们相信一个完整的解决方案,而不是图表上几个没有意义的不同指标。这是一个多合一指标,显示无与伦比且非常准确的信号、箭头 + 价格行为信息。 RelicusRoad 基于强大的人工智能,提供缺失的信息和工具来教育您并使您成为交易专家,成为成功的交易者。 几乎所有技术指标都滞后,这意味着它们只能报告已经发生的事情。因此,他们只确认您过去可以看到的价格已经在哪里。我们相信领先指标可以预测未来价格,而无需重新绘制,也不要过度依赖可能改变并导致重新绘制的滞后指标。如果您根据滞后指标进行交易并建立头寸,您就知道您已
- Real price is 80$ - 40% Discount ( It is 49$ now ) Contact me for instruction, any questions! Related EA Product: Bitcoin Expert Introduction The breakout and retest strategy is traded support and resistance levels. it involves price breaking through a previous level.  The break and retest strategy is designed to help traders do two main things, the first is to avoid false breakouts. Many false breakouts start with a candlestick that breaks out of a level but ends with an immediate candlestic
目前八折优惠! 对任何新手或专家交易者来说都是最好的解决方案! 这个仪表板软件适用于28种货币对。它基于我们的两个主要指标(高级货币强度28和高级货币冲动)。它对整个外汇市场提供了一个伟大的概述。它显示高级货币强度值,货币运动速度和28个外汇对在所有(9)时间段的信号。想象一下,当你可以使用图表上的单一指标观察整个市场,以确定趋势和或剥头皮的机会时,你的交易将得到改善 我们已经在这个指标中建立了一些功能,使你更容易识别强势和弱势货币,同时识别和确认潜在的交易。该指标以图形方式显示货币的强势或弱势是增加还是减少,以及它在所有时间段的表现。 增加的新功能是动态市场斐波那契水平,它适应当前的市场条件变化,这是一个已经在我们的高级货币强度28和高级货币冲动指标中使用的成熟的加分项。 在交易时,总是将弱势货币和强势货币配对,这个新指标将帮助你做到这一点。 用户手册:点击这里  https://www.mql5.com/en/blogs/post/708783 特点  显示每个时间段的ACS28和GAP-speed(冲动)的货币强度值。 列:颜色代码以7种颜色
Bomb Bank Signal
Igor Pereira Calil
炸彈銀行訊號:您對 MetaTrader 4 的信心指標 Bomb Bank Signal 是 MetaTrader 4 的一個強大指標,旨在識別金融市場中最相關的趨勢。如果您正在尋找一種能夠準確預測運動的工具,那麼炸彈庫就是您需要的盟友。 運作原理: 該指標結合了三種不同的方法——成交量分析、蠟燭收盤價和對稱趨勢——來偵測和發出買賣機會訊號。當炸彈銀行識別出買入機會時,它就像一顆「炸彈」;當它偵測到賣出訊號時,它就像一個「頭骨」。 為什麼炸彈銀行不一樣? 完全可靠性:炸彈庫訊號不會刪除訊號。訊號一旦發出,就會一直存在,確保您不會錯過任何機會。 極為準確:炸彈庫不會發出錯誤訊號。它會即時更新您的訊息,隨著市場的變化進行調整,但保持先前訊號的透明度。 即時更新:訊號被即時識別並在必要時更新,使您能夠快速響應市場變化。 最大化您的結果: 炸彈銀行訊號是識別趨勢持續走勢的理想選擇。例如,如果您已經做空並且指標在 M15 發出買入訊號,那麼現在就是平倉或部分下單的最佳時機,反之亦然。 此外,經過仔細分析,我們建議您遵循M30、H1和H4上的訊號,停損僅50點。這使
Market Reversal Alerts
LEE SAMSON
4.19 (108)
成為突破者,隨著價格反轉,市場結構會改變利潤。 訂單突破者指示器可以識別趨勢或價格走勢何時接近枯竭並準備好逆轉。它會提醒您市場結構的變化,通常會在發生逆轉或重大回調時發生。 該指標使用專有計算來確定突破和價格動能。每當在可能的耗盡點附近形成新的高點時,指標就會繪製最後一個生成該高點的順序塊。然後,它將隨價格移動隨價格跟隨定單。然後,當價格轉向相反方向並突破該訂單塊時,它會提醒您,從而創建新的市場結構並開始趨勢或重大回調的可能逆轉。 訂單塊是在創建高/低之前的最後一個相反的彩色蠟燭,並且當價格跌破這些關鍵區域以下時,這表明趨勢可能會發生短期或長期反轉。 特徵 提醒您關鍵耗盡點的市場結構變化 價格接近耗盡水平時自動提取訂單塊 在一個方向繼續移動時,在價格後面跟踪定單,以提醒您最佳的反轉輸入 將顏色更改為純色塊,以顯示何時發生市場結構中斷。 適用於所有交易品種和時間範圍 內置集成的彈出窗口和電子郵件警報 策略和如何與定單破壞者指標進行交易 當斷路器塊發生時,您有兩個選擇。 看左邊!我們正在尋求供應/需求或支撐/阻力位嗎?市場結構轉變(逆轉)通常發生在價格重新測試舊水平或
Advanced Currency IMPULSE with ALERT
Bernhard Schweigert
4.9 (455)
目前31%的折扣!! 对任何新手或专家交易者来说都是最好的解决方案! 这个指标是一个独特的、高质量的、负担得起的交易工具,因为我们已经纳入了一些专有的功能和一个秘密的公式。只需一张图表,它就能给出所有28种货币对的警报。想象一下,你的交易将如何改善,因为你能够准确地确定新趋势或剥头皮机会的触发点 建立在新的基础算法上,它使识别和确认潜在交易变得更加容易。这是因为它以图形方式显示了一种货币的强势或弱势是否正在加速,并测量了这种加速的速度--把它想象成你汽车中的速度表。当你加速时,事情显然会发生得更快,这在外汇市场上也是一样的,即如果你配对的货币正在向相反的方向加速,你就会发现一个潜在的有利可图的交易。 货币动量的垂直线和箭头将指导你的交易! 动态的市场斐波那契23水平被用作警报触发器,将适应市场活动。如果冲动触及黄色触发线,您将在MetaTrader或您的电子邮件或推送警报中收到警报。然后你就知道作为一个交易员应该做什么。货币对和方向已经给出。只要点击警报按钮,就可以切换到该货币对或打开一个新的图表,以便进一步分析。警报级别可以通过用户输入来改变,可以选择3个敏感度级别
Advanced Supply Demand
Bernhard Schweigert
4.9 (271)
现在优惠 33%! 任何新手或专业交易者的最佳解决方案! 该指标是一款独特、高质量、且价格合理的交易工具,因为我们已经整合了许多专有功能和新公式。 依据此更新,您将能够显示双重时间帧区域。 您不仅可以显示一个较高的时间帧,还可以同时显示图表时间帧,加上更高的时间帧:显示嵌套时区。 供需双方所有交易者都会喜欢它。 :) 重要信息披露 高级供需的最大潜力,请访问 https://www.mql5.com/zh/blogs/post/720245   想象您的交易如何得以改善,是因为您能够精准定位入场或目标位吗? 构建于新的底层算法,它可以更轻松地识别出买卖双方之间的潜在失衡。 这是因为它以图形方式展示供需最强劲区域,及其过去的表现(显示旧区域)。 这些功能旨在帮助您更轻松地发现最佳入场区域和价位。 现在您可以针对您的交易品种和时间帧来优化和编辑区域强度! 高级供需指标适用于所有产品和时间帧。 它是一个新的公式,非常新的功能是两个区域强度函数可由用户输入进行调整! 这在交易中是一大优势。 当您学习如何使用专有功能,例如带有价格游离最小 X 因子的区域强度时,您能够判断该区域强劲与否。 供
Scalper Vault
Oleg Rodin
5 (22)
Scalper Vault 是一个专业的剥头皮系统,为您提供成功剥头皮所需的一切。该指标是一个完整的交易系统,可供外汇和二元期权交易者使用。推荐的时间范围是 M5。 该系统为您提供趋势方向的准确箭头信号。它还为您提供顶部和底部信号以及江恩市场水平。无论您拥有何种交易经验,该系统都易于使用。您只需要遵循简单的规则并每天重复该过程。 建议将此系统用于主要货币对。感谢您的关注! 请注意,该指标在策略测试器中可能无法正常工作。因此,我建议仅在模拟或真实账户的真实交易条件下使用该系统。 指示器提供所有类型的警报,包括推送通知。 购买指标后请与我联系。我将免费与您分享我的个人交易建议和出色的奖励指标! 祝您交易愉快,盈利!
使用我们的自定义MT4指标发现成功外汇交易的秘诀! 您是否曾经想过如何在外汇市场上取得成功,一贯赚取利润,同时降低风险? 这是您一直在寻找的答案! 允许我们介绍我们的专有MT4指标,该指标将彻底改变您的交易方法。 独特的多功能性 我们的指标专为喜欢Renko和Rangebar Candle编队的用户而设计。 我们了解到,这些图表类型受到许多经验丰富的交易者的青睐,这就是为什么我们的指标与它们无缝集成,从而提供无与伦比的市场分析。 清晰的趋势信号 忘记复杂的分析! 我们的指标利用鲜艳的色彩和清晰的点结构来明确指示市场趋势。 红色和蓝色的点毫无疑问地对价格变动的方向留下了疑问,从而可以在您的交易中快速决策。 与HH/HL HL/LL策略对齐 如果您正在寻求一个指标,该指标无缝地与基于HH/HL和HL/LL结构的策略无缝合作,则不需要更多。 我们的工具不仅确定了这些形式,而且还促进了它们在投资过程中的有效利用。 绝对的清晰度和简单性 我们的首要任务是为您提供一种不仅有效而且易于使用的工具。 我们的指标是为了清晰而设计的,使您可以专注于做出投资决策,而不是
FX Volume
Daniel Stein
4.48 (27)
通过 mql5 和 Telegram 上 的 " 晨间简报 "获取每日市场更新,包括详细信息和屏幕截图 ! 外汇交易量(FX Volume)是第一个也是唯一一个从经纪商角度真正洞察市场情绪的交易量指标。 直接在您的图表上看到这些信息是真正改变游戏规则和突破性的交易解决方案。 受益于独特的市场数据洞察,如 比率(Ratios )显示货币多头和空头头寸的比率(百分比 比率变化 显示所选时间段内的多头比率及其百分比变化 总交易量 显示货币的总交易量(多头和空头),以手为单位 多头 交易量显示货币所有多头头寸的交易量 空头 交易量显示所有货币空头头寸的交易量 净多头 显示净多头交易量,即所有多头头寸减去所有空头头寸(以手为单位)。 净多头百分比 显示货币净多头交易量的变化 请阅读我们的基本教程 -> "如何使用外汇交易量进行交易 " 获取更多信息,如常见问题、交易技巧和教程视频,请访问我们的 外汇交易量公共信息频道 请 安装并运行 SI Connect 以建立与我们数据中心的持续连接 背景信息 我们都知道,外汇是一个分散的市场。这就是为什么我们必须打破常规思维,开发一个独
Order Block Hunter
Noha Mohamed Fathy Younes Badr
5 (1)
Order block hunter indicator is the best indicator for  hunt the order blocks that area where there has been a large concentration of limit orders waiting to be executed Order blocks are identified on a chart by observing previous price action and looking for areas where the price experienced significant movement or sudden changes in direction .This indicator does that for you by using very complicated codes and helps you to take the best areas To buy and sell because it make marks at the best a
Best Currency Strength Indicator
Tumelo Patrick Rakotsoane
4.54 (41)
Advanced Currency Strength Indicator The Advanced Divergence Currency Strength Indicator. Not only it breaks down all 28 forex currency pairs and calculates the strength of individual currencies across all timeframes , but, You'll be analyzing the WHOLE forex market in 1 window (In just 1 minute) . This indicator is very powerful because it reveals the true movements of the market.  It is highly recommended to  analyze charts knowing the performance of individual currencies or the countries ec
Apollo Pips PLUS SP
Oleg Rodin
5 (3)
请在购买产品之前阅读下面的信息! Apollo Pips PLUS SP 是一款独特的产品!它适合那些想要获得我的新“APOLLO PIPS”指标以及“超级包”奖金以及访问我所有交易指标的人! 通过购买 Apollo Pips PLUS SP 产品,您实际上购买的是全新版本的 Apollo Pips 指标。此版本的指标具有改进的算法和易于使用的参数,使您有机会在任何市场和任何交易风格中使用该指标。 该产品的购买者还可以免费访问我的所有其他指标,作为我的超级奖励!如果您想获得我所有的交易工具,那么该产品非常适合您!:) 但这还不是全部!:) 该产品的所有购买者也有资格免费获得我的新指标!:) 如果我有一个新的交易指标可用,您将能够在我的特权“SUPER PACK”终身奖金计划中完全免费获得它! 购买后请联系我以获得我的交易提示和超级礼包奖金!
Currency Strength Exotics
Bernhard Schweigert
4.86 (29)
目前8折优惠! 对任何新手或专家交易者来说都是最好的解决方案! 这个指标是专门用来显示任何符号的货币强度,如异国货币对、商品、指数或期货。它是同类产品中的第一个,任何符号都可以添加到第9行,以显示黄金、白银、石油、DAX、US30、MXN、TRY、CNH等的真实货币强度。这是一个独特的、高质量的、负担得起的交易工具,因为我们已经纳入了一些专有的功能和一个新的公式。想象一下,你的交易将如何改善,因为你能够准确地确定新趋势或剥头皮机会的触发点? 用户手册:点击这里   https://www.mql5.com/en/blogs/post/708876 它适用于所有时间框架。你将很快能够看到TREND! 根据新的基础算法设计,它使识别和确认潜在交易变得更加容易。这是因为它以图形方式显示了8种主要货币和一种符号的强弱。 该指标显示了8种主要货币(澳元加元瑞士法郎欧元英镑日元新西兰美元)的强弱线,再加上一个符号! 该指标显示了符号的真实价值。例如:对于XAUUSD(黄金):价格以美元报价。如果黄金在上涨,你怎么能知道是黄金的强势还是美元的弱势?只有当黄金走强时,我们才会进行
Trend Screener
STE S.S.COMPANY
4.79 (81)
趋势指标,趋势交易和过滤的突破性独特解决方案,所有重要趋势功能都内置在一个工具中! 它是 100% 非重绘多时间框架和多货币指标,可用于所有符号/工具:外汇、商品、加密货币、指数、股票。 趋势筛选器是有效的指标趋势跟踪指标,它在图表中提供带有点的箭头趋势信号。 趋势分析器指标中可用的功能: 1.趋势扫描仪。 2. 具有最大利润分析的趋势线。 3.趋势货币强度计。 4. 带有警报的趋势反转点。 5. 带有警报的强趋势点。 6. 趋势箭头 每日分析示例,每日信号表现...等与我们的趋势筛选指标,可以在这里找到: 点击这里 限时优惠:Trend Screener Indicator 仅售 50 美元且终身可用。原价 125$) 通过访问我们的 MQL5 博客,您可以找到我们所有的高级指标以及分析示例、每日信号表现...等。 : 点击这里 我们的趋势系统由 2 个指标组成: 1. Trend Screener Indicator:显示趋势仪表盘、图表中的趋势线、入场点...等。 2. Trend Line Map Indicator:显示买卖作为仪表板,活动信号盈利/亏损
IX Power MT4
Daniel Stein
5 (5)
IX Power 终于将 FX Power 的无与伦比的精确性带到了非外汇交易符号中。 它能准确判断您喜爱的指数、股票、商品、ETF 甚至加密货币的短期、中期和长期趋势强度。 您可以 分析 终端提供的 一切 。试试吧,体验一下您在交易时如何把握 时机 。 IX Power 主要功能 100% 精确的非重绘计算结果 - 适用于您终端中的所有交易符号 下拉式选择预配置以及可单独配置的强度分析周期 通过电子邮件、消息和手机通知的无数种通知选项 可访问的 EA 请求缓冲区 可自定义计算限制,以获得更好的性能 为希望查看更多信息的用户提供特殊的多实例设置 无尽的图形设置,让您在每个图表中都能找到最喜欢的颜色 采用 Windows 11 和 macOS 风格的圆角新面板设计 神奇的移动指标面板,可在子窗口和主图表之间无缝移动 适用于高分辨率 QHD、UHD 和 4K 显示器,并针对平板电脑和触摸屏进行了优化 IX Power 参数 最重要的参数不言自明,但我们很快会在另一篇文章中为您提供所有 IX Power 参数的完整说明。 使用别名 "参数可为技术交易
自动在你的图表上画出支撑位和阻力位以及推动性蜡烛缺口,这样你就可以看到价格接下来可能会走向哪里和/或可能会逆转。 该指标旨在作为我的网站(The Market Structure Trader)上教授的头寸交易方法的一部分,并显示目标和潜在入场的关键信息。 该指标有两个核心功能和四个附加功能: 核心功能1 - 日线、周线和月线的自动支持和阻力线 该指标为你自动绘制过去2天以及6周和数月前的最新支撑和阻力水平。你可以完全自定义这些水平的外观以适合你,并显示多少个。这些关键水平通常作为主要的支持和阻力区,价格将从这里转向并回撤或逆转。它们也是价格将走向的目标,因此你可以迅速看到在价格可能转向之前交易的潜在距离。 核心特征2--推进型蜡烛缺口目标 推进性缺口蜡烛是银行和机构通过在任何市场上执行大额头寸而创造的强劲、快速的移动。这些大阳线一旦形成,有两个关键作用。 1. 1.它们作为一个方向性信号,因为大型市场参与者已经选择了一个方向,一旦发生,价格往往会在一段时间内继续移动。 2. 2.更重要的是,它们作为目标,因为这些区域往往会让其他大玩家的头寸 "越位",价格在绝大
M1 Arrow
Oleg Rodin
4.67 (12)
M1 Arrow - 基于市场的两个基本原则的盘中策略。 该算法基于使用附加过滤器对交易量和价格波动的分析。该指标的智能算法仅在两个市场因素合二为一时才会发出信号。该指标使用较高时间框架的数据计算 M1 图表上某个范围的波浪。为了确认波浪,该指标使用了成交量分析。 从理论上讲,该指标可以与其他时间框架一起使用,但您需要考虑到该指标最初是为在 M1 上交易而开发的这一事实。 该指标是一个现成的交易系统。交易者所需要的只是跟随信号。此外,该指标可以成为您自己的交易系统的基础。交易仅在分钟图表上进行。 尽管指标使用 MTF 原理,但指标算法尽可能稳定。 购买后,一定要写信给我!我将与您分享我的交易设置和建议!祝您交易成功!感谢您的关注!
作者的更多信息
Script Hunting for the Channel Breakout The script is designed for semi-automatic trading. It can place required number of pending BuyStop and SellStop orders with preset StopLoss and TakeProfit levels in one go. The script calculates the channel width using the ZigZag indicator and places a grid of pending BuyStop and SellStop orders according to specified settings. The first pair of pending BuyStop and SellStop orders is placed at the specified distance from the channel's borders. This distanc
FREE
An Expert Advisor. A channel breakthrough signal. Attach two horizontal lines to a chart: one for the upper channel line, name it < Up > the other one for the lower border, name it < Dn > Settings: sound = true - play a sound notification alert = true - show a dialog box containing user data comment = true - show a comment in the upper left corner of the chart print = false - print a message to the Experts log repet = 3 - number of times the sound file is played.
FREE
Hunter on the channel breakout Bot The Expert Advisor places the necessary amount of BuyStop and SellStop pending orders with predefined StopLoss and TakeProfit levels at the specified time daily. The EA calculates the channel width using the ZigZag indicator and sets a grid of BuyStop and SellStop pending orders according to the specified settings. The first pair of BuyStop and SellStop pending orders is placed at a predetermined distance from the channel borders. The distance is set in the pe
Script Deleting the Hunter The script is developed for fast deletion of pending orders, Up and Dn border lines, as well as arrows (symbols) which appear when an order is placed. Features: Can delete all pending orders of the current chart in one go Can delete all pending orders of the current account in one go Can delete only those orders which have specified magic number Can delete lines which show the channel's border, support and resistance levels marked Up and Dn Can delete all arrows (sym
FREE
Purpose The indicator is intended for manual multi-currency trading based on the Triple Screen Strategy. It works with any symbols located in the Market Watch window of the MT4: currencies, metals, indexes, etc. The number of instruments can be limited by capacity of the МТ4's parameters. But if desired, you can create several windows with various set of instruments and parameters. Operation Principle The indicator uses the modified Triple Screen Strategy for determining trend direction in the
This utility displays the name of the current symbol and the current period in the chart background in a large font. It is very convenient, e.g. when you use multiple charts with different symbols, period or when saving a chart screenshot. The information is displayed in two lines. In the first line, the chart symbol and current timeframe are shown in a larger font (e.g. AUDUSD,h1 ). In the second line, the full name of the current symbol is displayed in a smaller font (e.g. for GPBJPY it shows
This expert Advisor is a more developed version of  News Hunter Bot OneTime . The EA places pending orders BuyStop and SellStop before the news release at a specified distance from the current price. The date and time of the news release is set in the EA parameters for a few days in advance. In total, you can set the time for 20 news. Also, the EA indicates how many minutes before the news you need to place pending orders and after how many minutes you should remove pending orders that have not
This adviser can be used without optimization. To get started, you only need to install the desired risk (or the size of the lot) and regularly withdraw profit. For a start, you can install the trial version of the Expert Advisor Hunter bot PriceLines Lite , which will work on a real account with a minimum lot (and therefore with minimal risk). In this, the main version, all settings are available. EA is designed for fully automated trading. It spelled out the function of protection against most
This is a multi-currency version of  Hunter bot PriceLines Extra . This expert Advisor can be installed on different currency pairs, with no limit on the number. All copies of the expert Advisor work as one team. When you open a market order for one of the instruments, all other advisors go into standby mode. As soon as the market order is closed, all the experts return to the active mode. For a start, you can install the trial version of the expert Advisor   Hunter bot PriceLines Lite , which w
A dealer with simple logic of opening orders and reliable closing control for advanced. The input signal is determined by only one indicator. Closing occurs on target profit. When drawdring first orders, the following appears. Maximum number of orders - no more than three in each direction. Settings for configuration: ----------- Trade Settings ----------- Quantity Lot 1 - the size of the first transaction Quantity Lot 2 - the size of the second transaction in the series Quantit
This utility displays the name of the current symbol and the current period in the chart background in a large font. It is very convenient, e.g. when you use multiple charts with different symbols, period or when saving a chart screenshot. The information is displayed in two lines. In the first line, the chart symbol and current timeframe are shown in a larger font (e.g. AUDUSD,h1 ). In the second line, the full name of the current symbol is displayed in a smaller font (e.g. for GPBJPY it shows
Purpose The indicator is intended for manual multi-currency trading based on the Triple Screen Strategy. It works with any symbols located in the Market Watch window of the MT5: currencies, metals, indexes, etc. The number of instruments can be limited by capacity of the МТ5's parameters. But if desired, you can create several windows with various set of instruments and parameters. Operation Principle The indicator uses the modified Triple Screen Strategy for determining trend direction in the
A dealer with simple logic of opening orders and reliable closing control for advanced. The input signal is determined by only one indicator. Closing occurs on target profit. When drawdring first orders, the following appears. Maximum number of orders - no more than three in each direction. Settings for configuration: ----------- Trade Settings ----------- Quantity Lot 1 - the size of the first transaction Quantity Lot 2 - the size of the second transaction in the series Quantit
The robot uses the logic of triangular arbitration. To work it, you need to choose a triangle of currency pairs, for example EURUSD_GBPUSD_EURGBP. The robot compares the basic cross-pair with its artificial analogue and trades towards the lag of quotations. The lag is calculated for each of the three currency pairs. The difference in quotations (spread) can be set in the settings. The adviser is multi currency, as it can trade at once with several triangles of currency pairs. The list of cross-
筛选:
ZJYY9788
160
ZJYY9788 2020.08.09 13:39 
 

This is an awesome indicator, one of a kind actually, I've been looking everywhere for it and now I found it. Thank you so much!

回复评论
版本 1.11 2021.08.12
Added the ability to increase the thickness of the lines - new items in the settings:
- The thickness for lines of the levels,
- The thickness for points of the levels.
版本 1.10 2016.05.06
A new parameter in the indicator settings:
- use the latest floating point of the ZigZag indicator (Yes/No)?