CBT Quantum Maverick
- 指标
- Arpit Sharma
- 版本: 1.1
- 更新: 20 九月 2024
- 激活: 5
CBT Quantum Maverick
高效二元盈利系统
CBT Quantum Maverick 是一款经过精心调校的高性能二元期权交易系统,专为寻求精确、简单和可靠利润的交易者而设计。无需定制——该系统经过优化,开箱即用,可获得最佳效果。
主要特点:
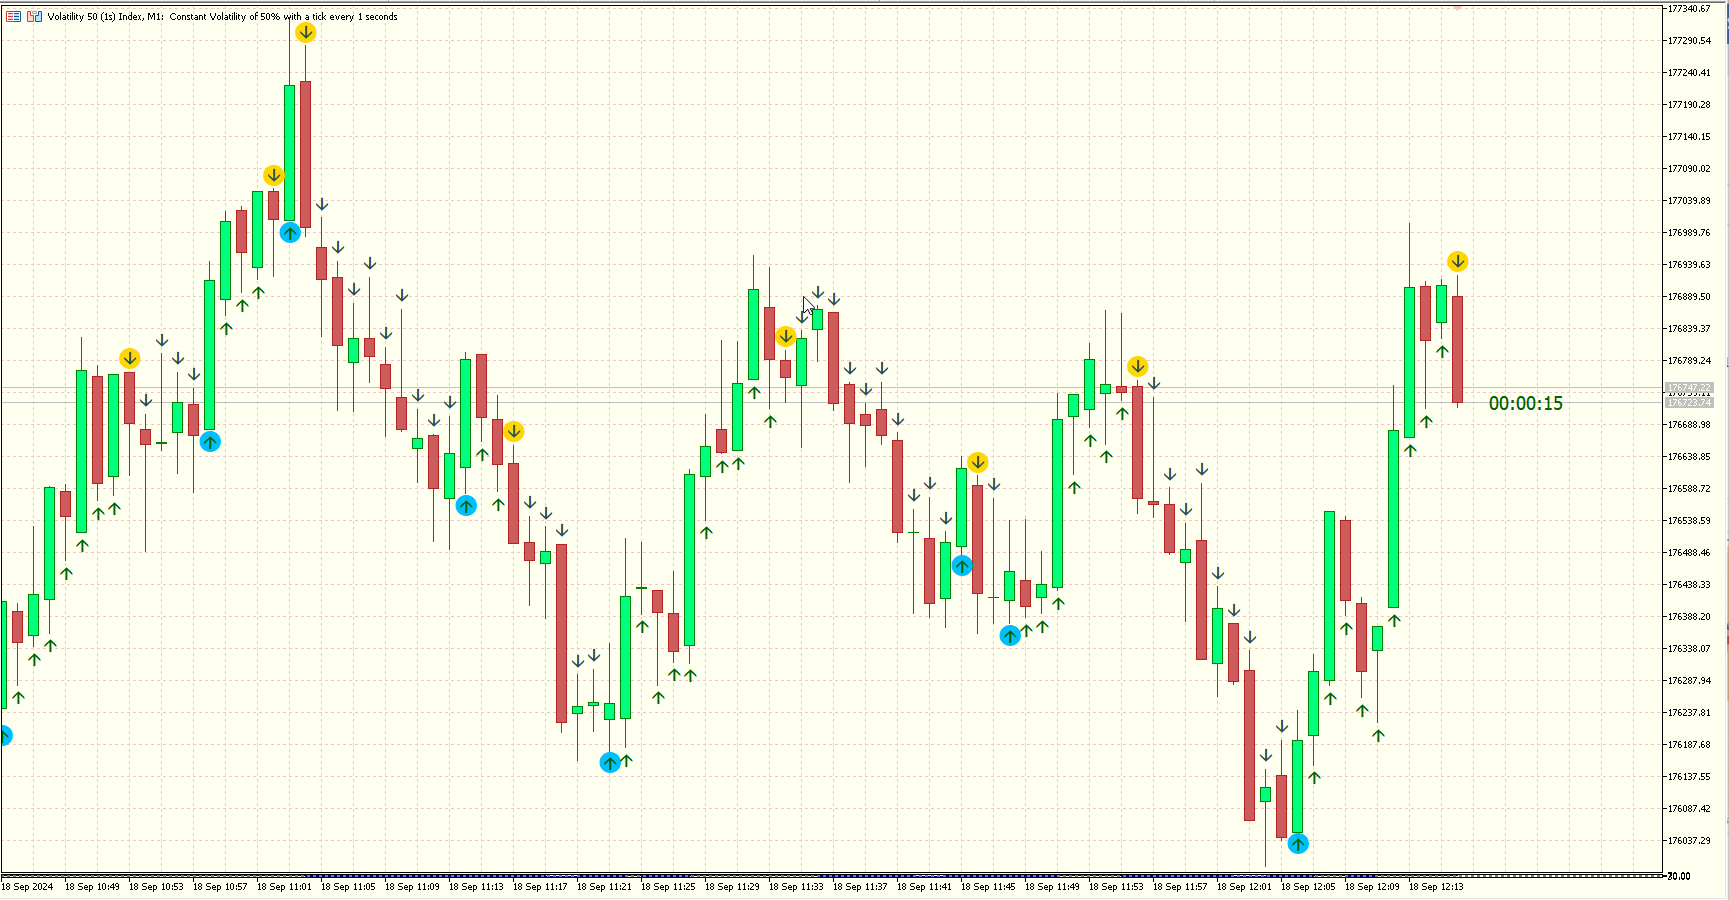
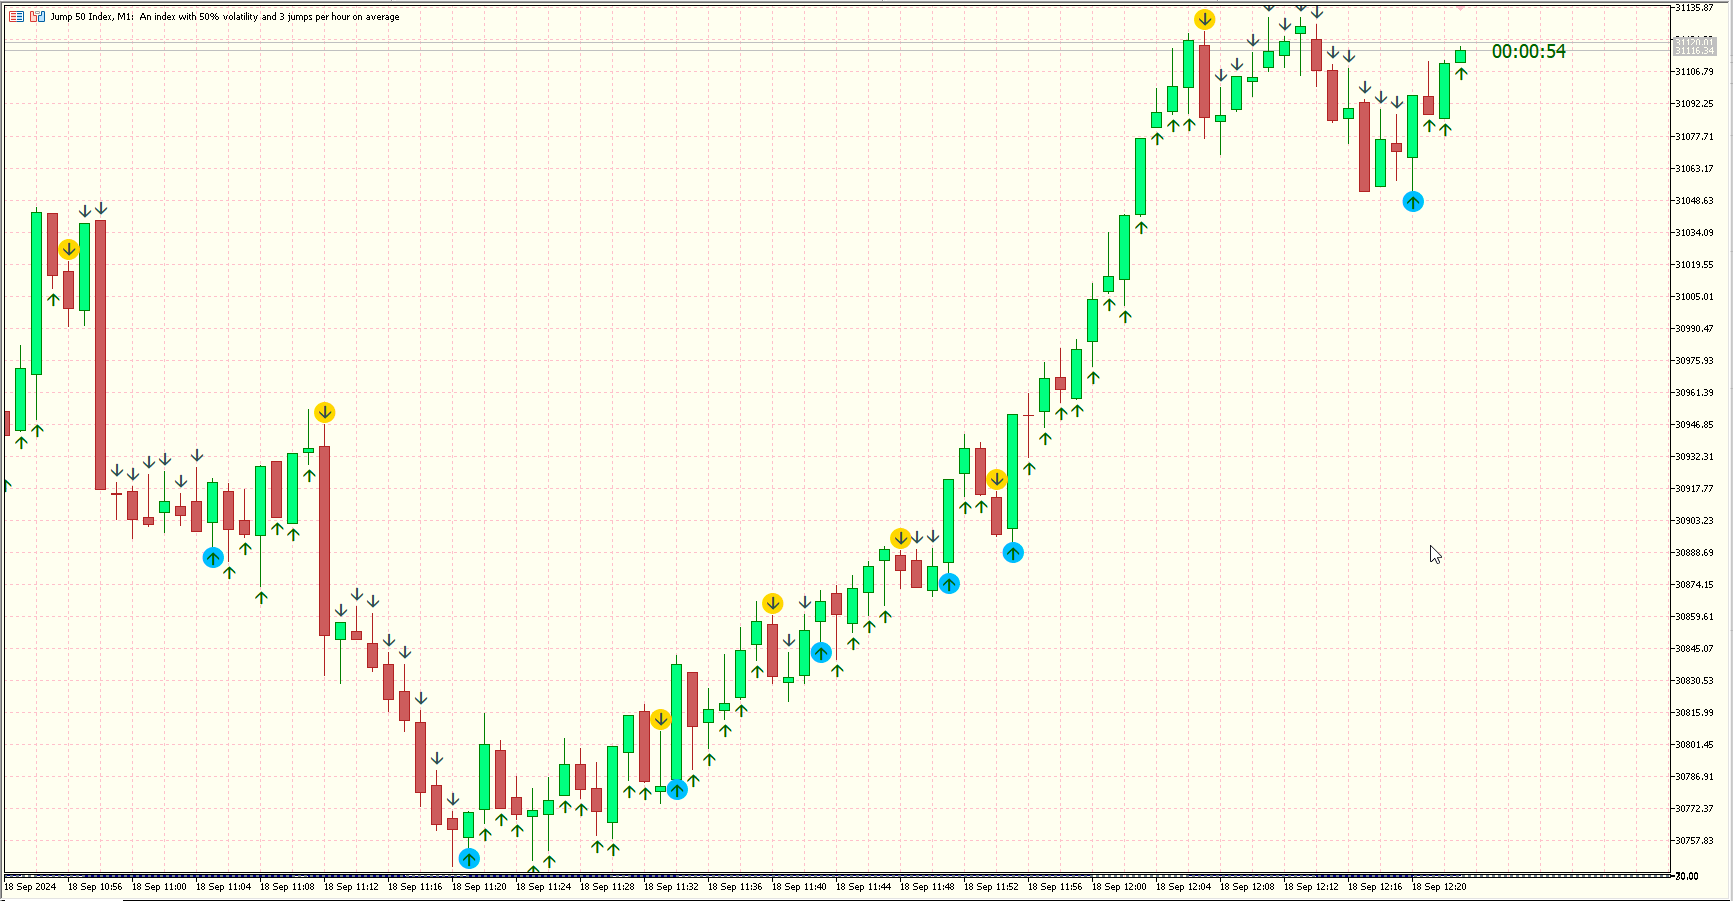
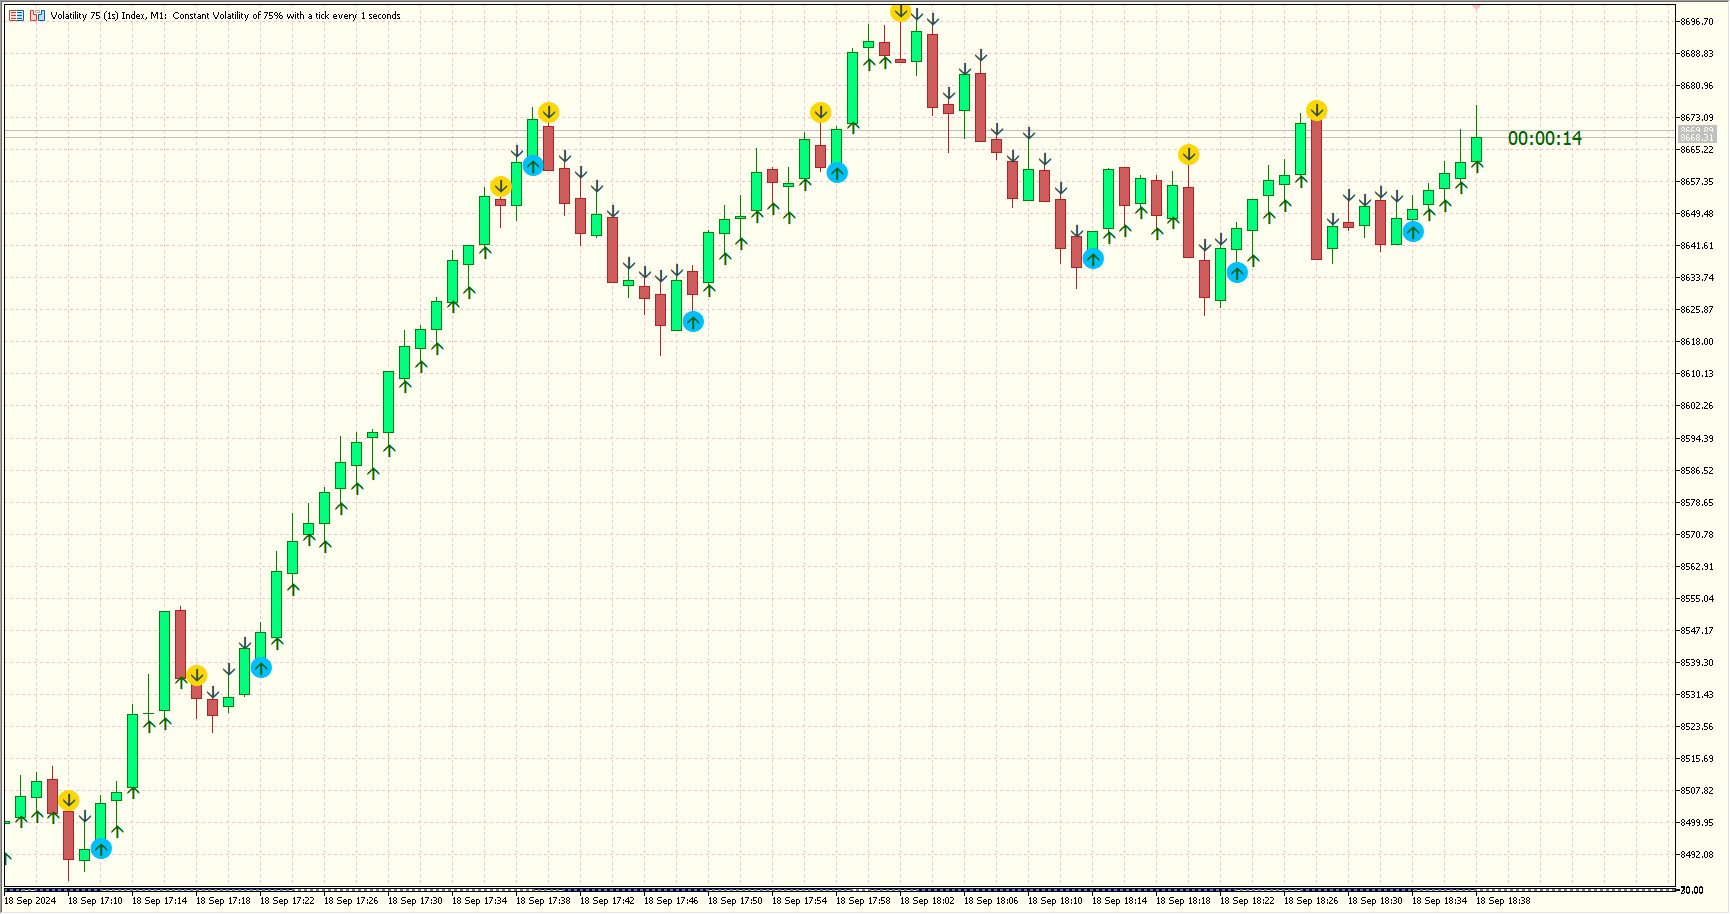
- 两种信号精度模式:
- “允许重绘”模式:提前提供信号,让您有充足的机会为下一根蜡烛做准备并进行交易。
- “严格不重绘”模式:在当前蜡烛开始时提供实时信号——确保不重绘和 100% 准确的信号时序。
- 二元期权中的最佳产品:
该系统是二元期权交易的理想选择。只需遵循信号,为您的交易做好准备,然后满怀信心地执行。
兼容:
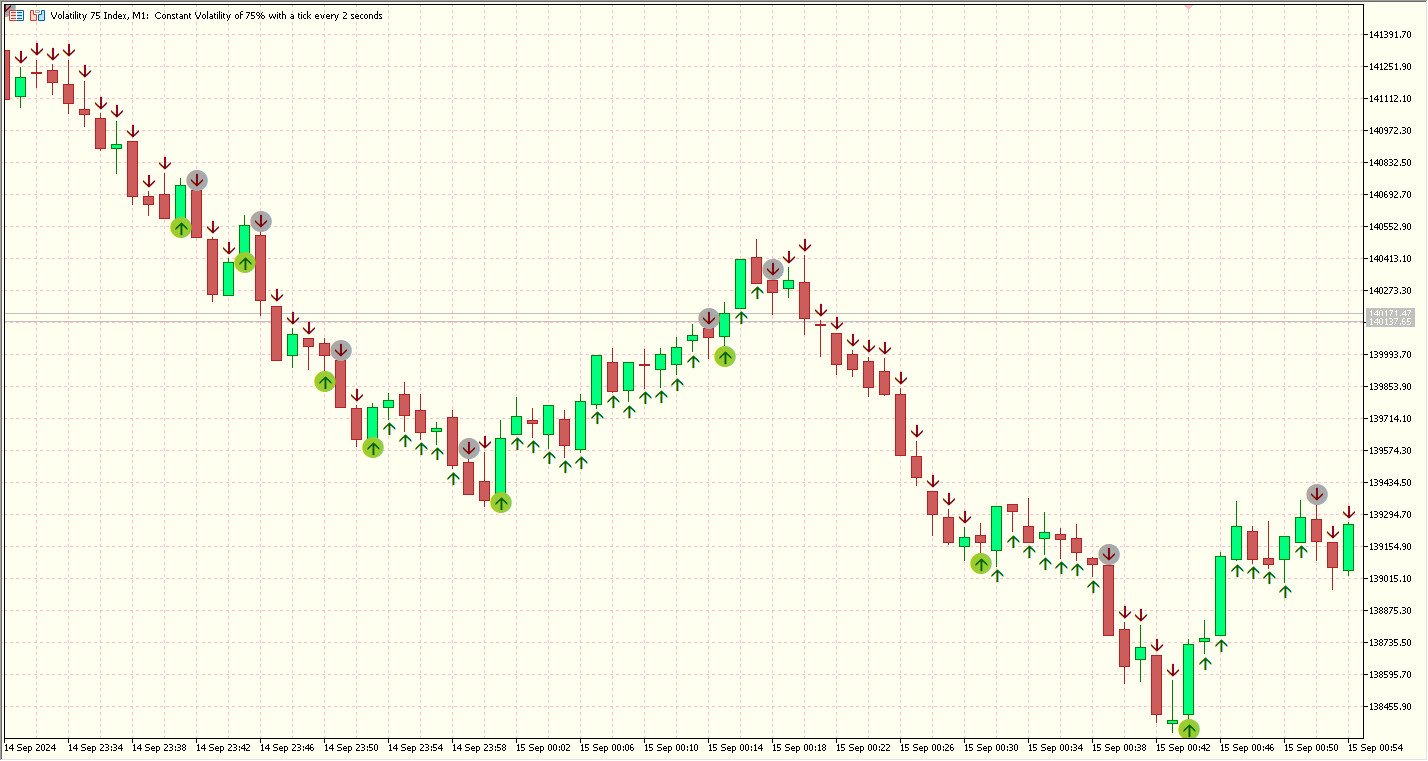
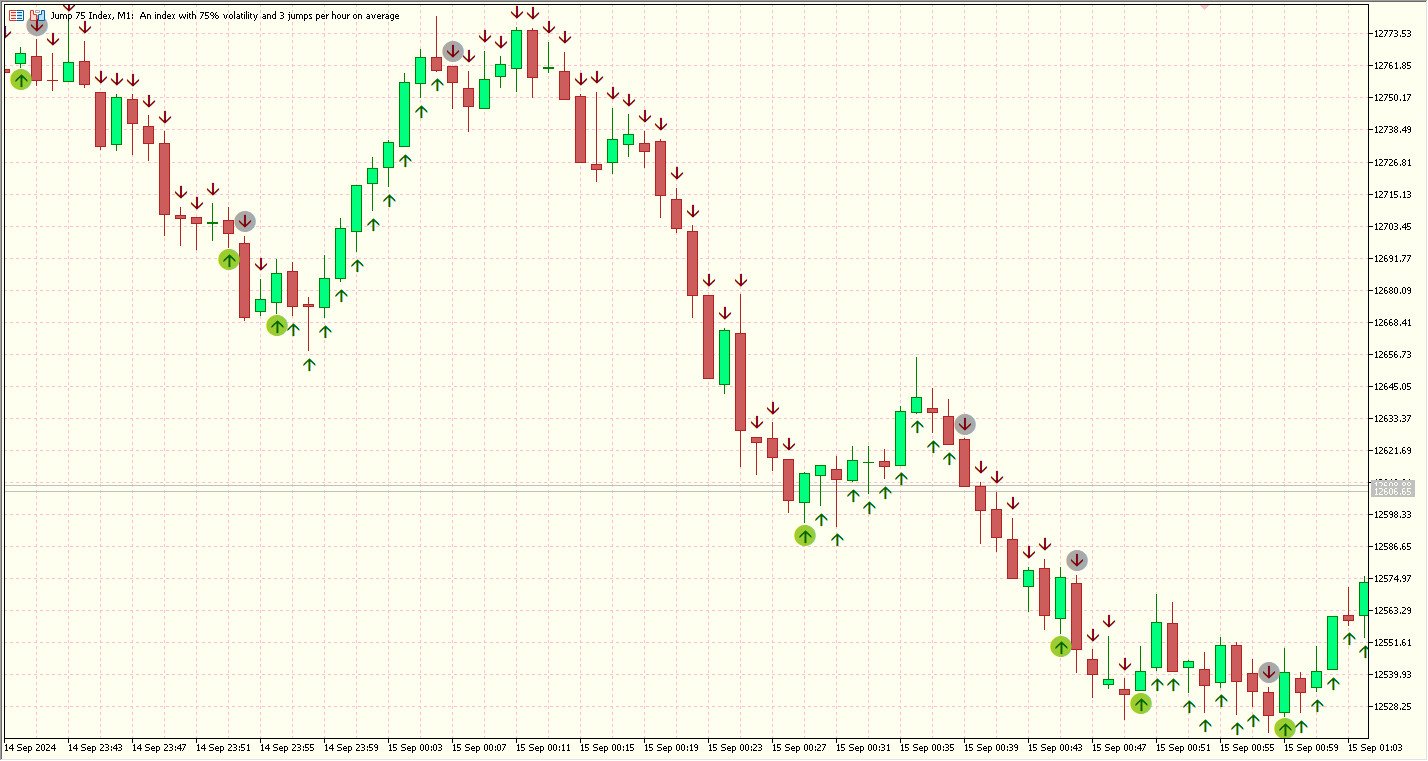
1. Deriv 合成图表,适用于任何时间范围。
2. 来自 Quotex、PocketOption、Binomo、Stockity、IQOption、Exnova、OlympTrade、Deriv、Binolla 和 Homebroker 等经纪商的场外交易图表——可导入 MT5(一周内免费导入支持;之后为付费服务)。
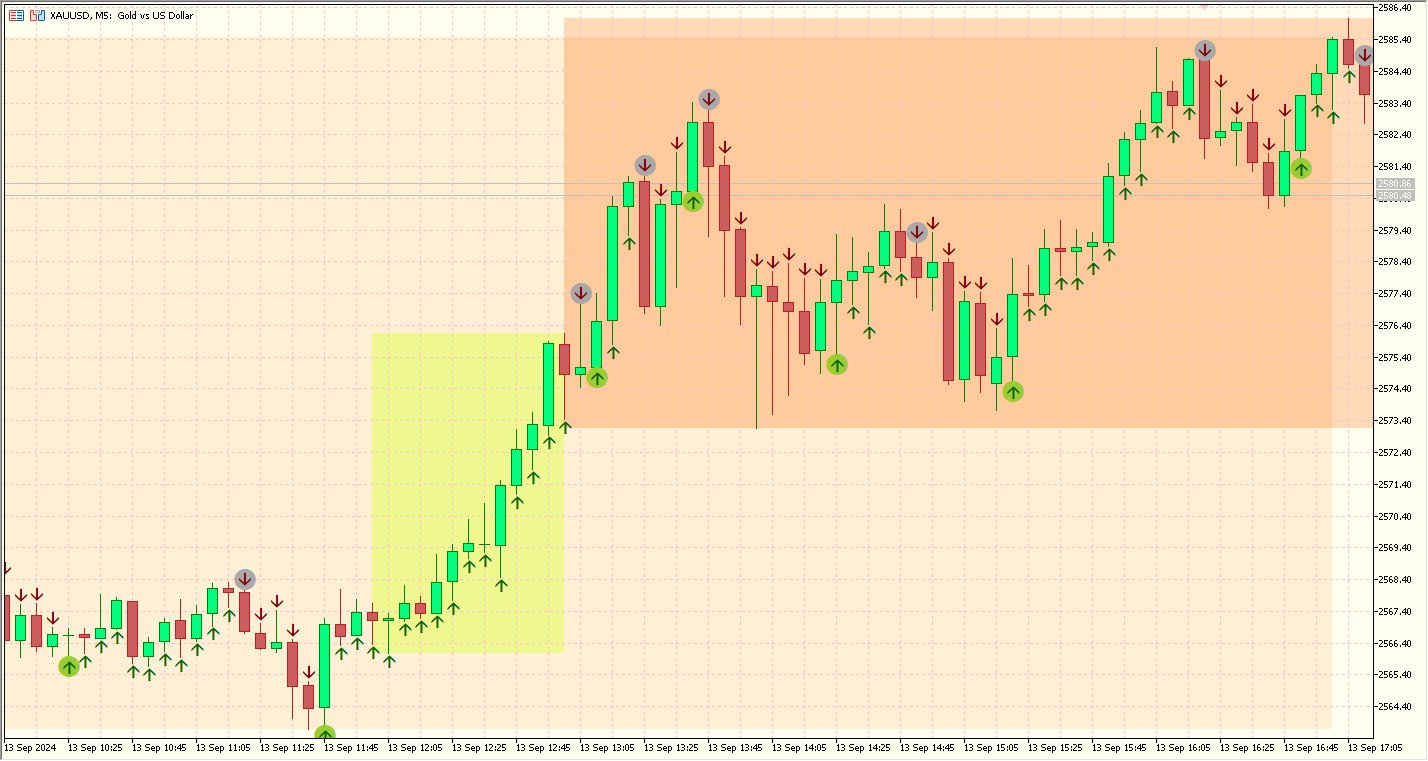
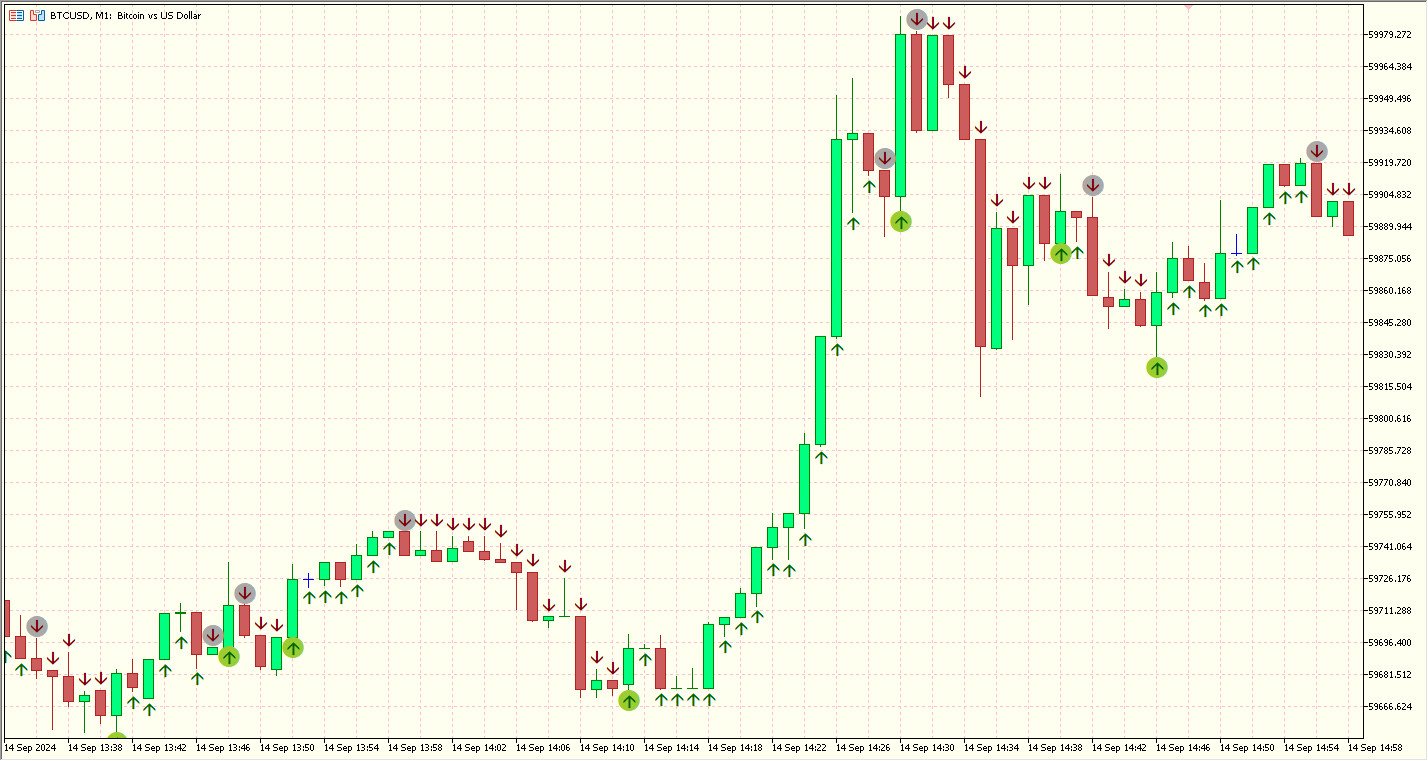
3. 外汇、加密货币和商品市场,实现更广泛的资产多元化。
4. 高回报二元资产,建议超过 90% 的回报以获得最佳性能。
额外好处:
1. 提供交易计划:将包括分步交易计划,以确保一致且可靠的执行。
2. 工作量少,回报高:每天只需 1 小时交易,对于时间有限的人而言非常高效。
3. 明确的交易规则:对固定交易规则的完整解释消除了任何困惑。您可以在 YouTube (@pstradeandsuccess) 上找到更多信息并与我们联系。
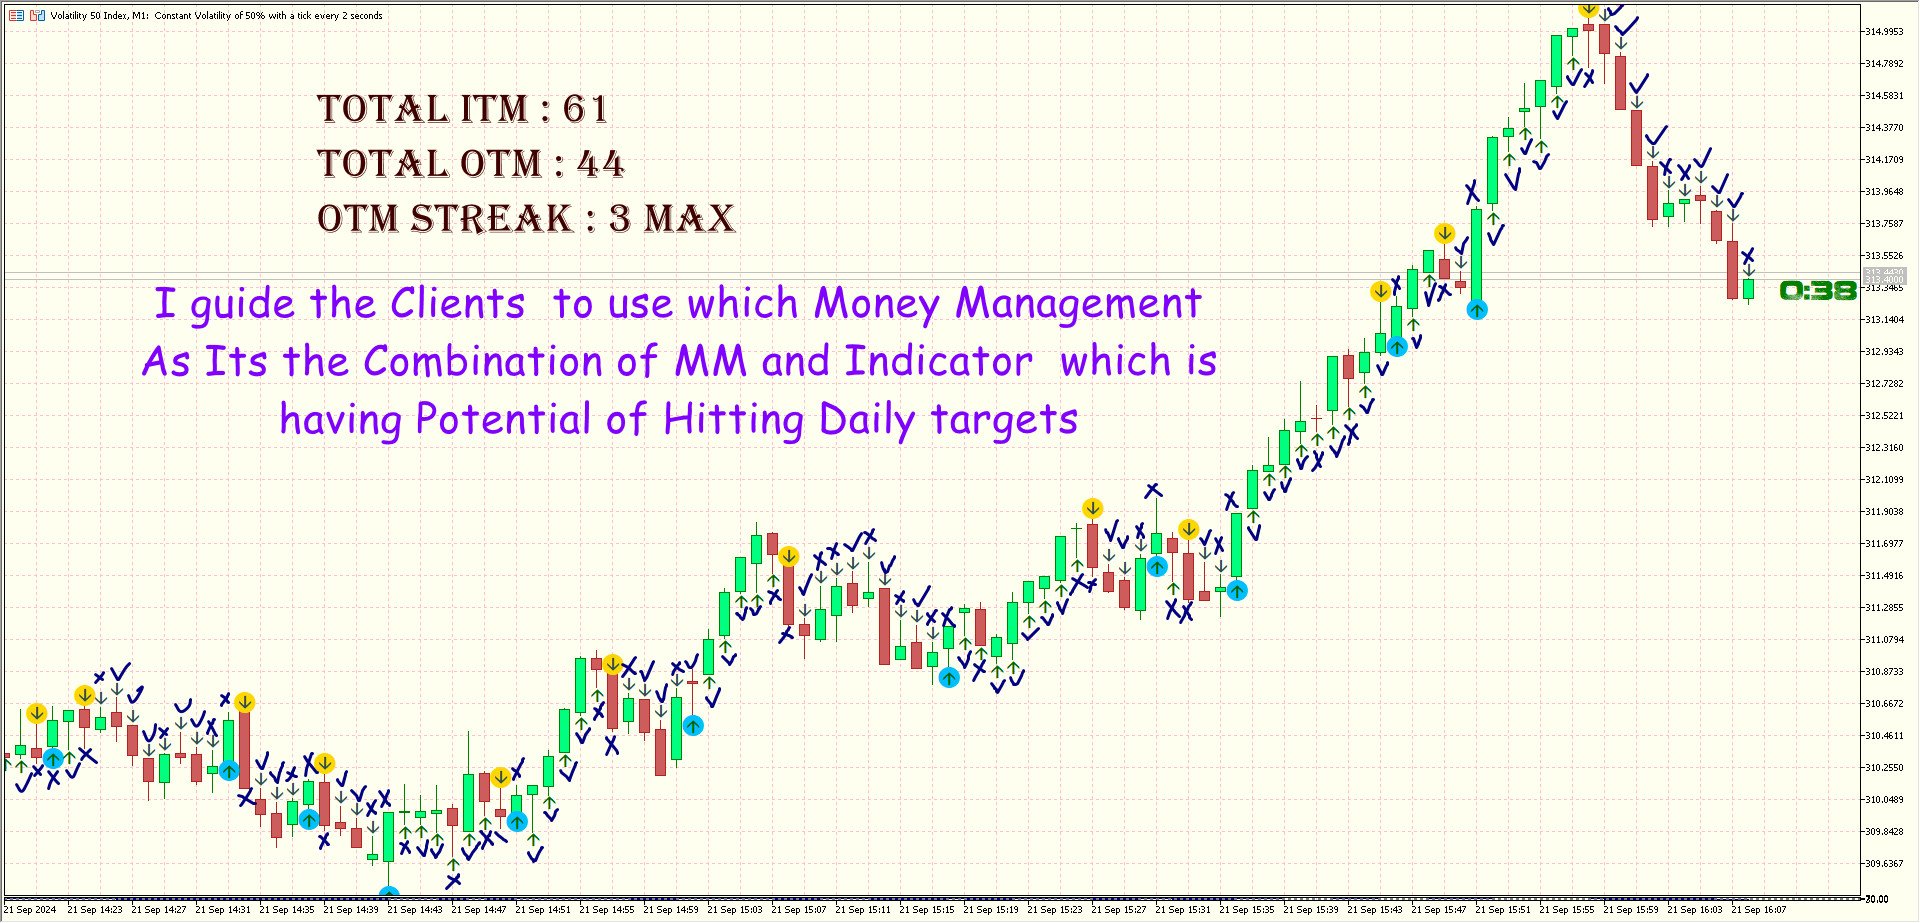
4. 资金管理指南:学习如何使用先进的资金管理系统,该系统可与交易计划一起提高盈利能力。
5. 用户友好:该系统非常直观,即使是经验最少的交易者,只需几天的练习就可以熟练掌握。
独特的销售主张 (USP):
通过正确使用资金管理并严格遵守交易计划,该系统有可能在每天仅 1 小时的交易中实现 20-25% 的增长。虽然二元期权交易存在固有风险,但实现持续每日利润的机会要高得多——仅使用您能承受的余额。
---
免责声明:
交易二元期权、外汇和加密货币涉及重大风险,可能不适合所有投资者。您可能会损失所有投资资本。过去的表现并不能保证未来的结果。在使用真钱交易之前,请在模拟账户上练习。我们对使用本产品时可能发生的任何财务损失概不负责。始终使用您可以承受损失的资金进行交易。