• 概述
  • 评论 (3)
  • 评论 (6)
  • 新特性

RR TradeManager Visualizer

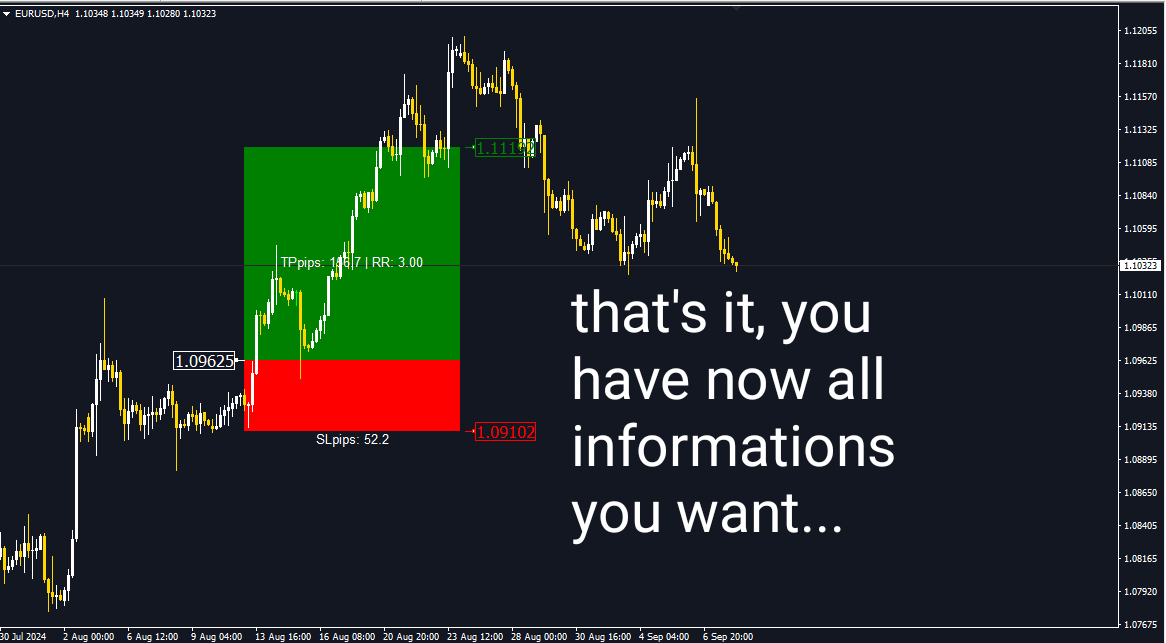
RR_TradeManager Visualizer 是一个交易管理工具,旨在帮助交易者轻松地在图表上可视化他们的止损(SL)和获利(TP)水平。此初始版本提供了一个简单的图形表示,显示SL和TP区域以及入场价格。请注意,目前的版本仅专注于图形显示SL和TP区域的图形标记。

当前版本的特点:

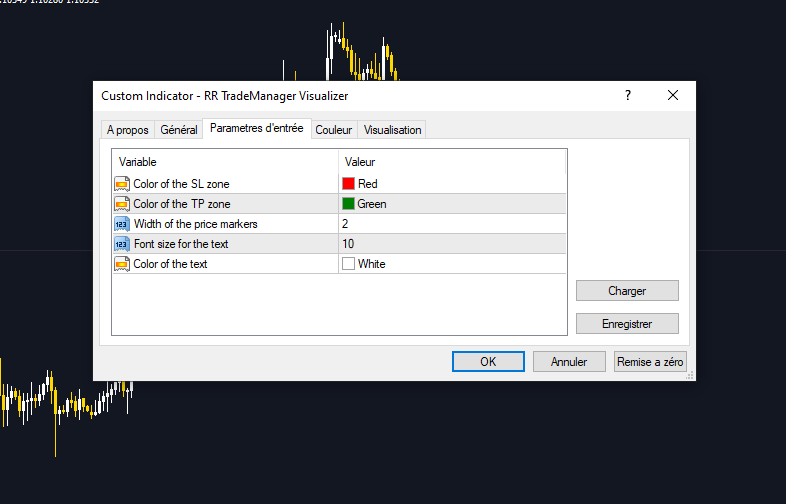
  • SL和TP区域显示: 清晰地显示止损和获利水平,支持自定义颜色。
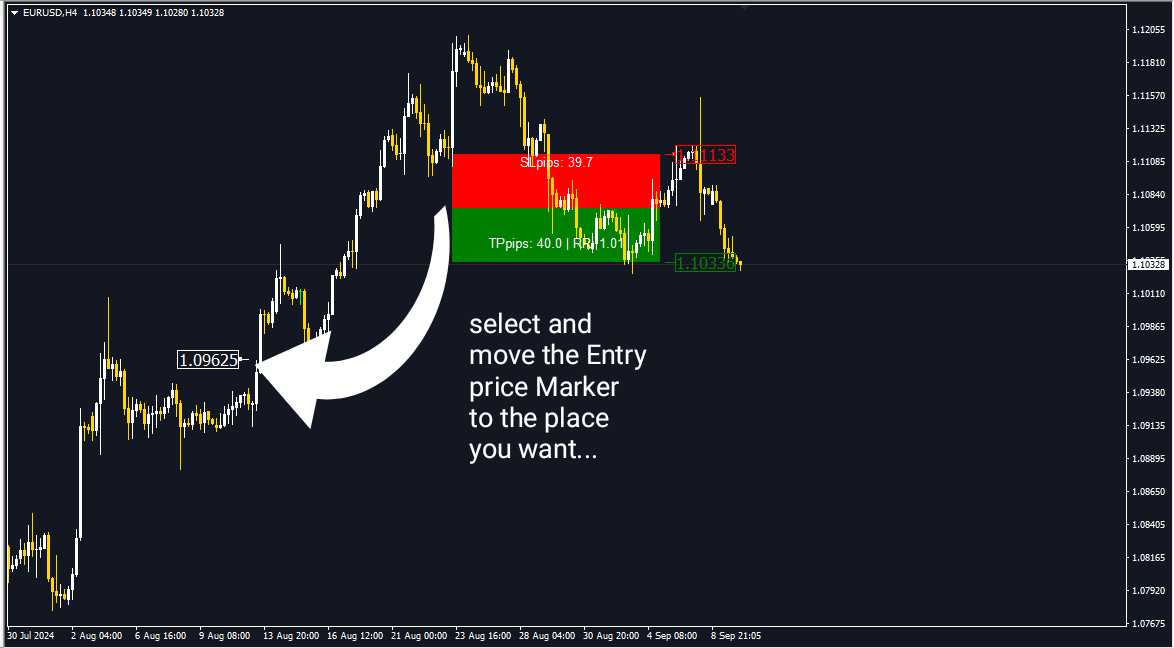
  • 可移动入场价格: 允许在图表上移动入场价格,以查看SL和TP水平的变化。
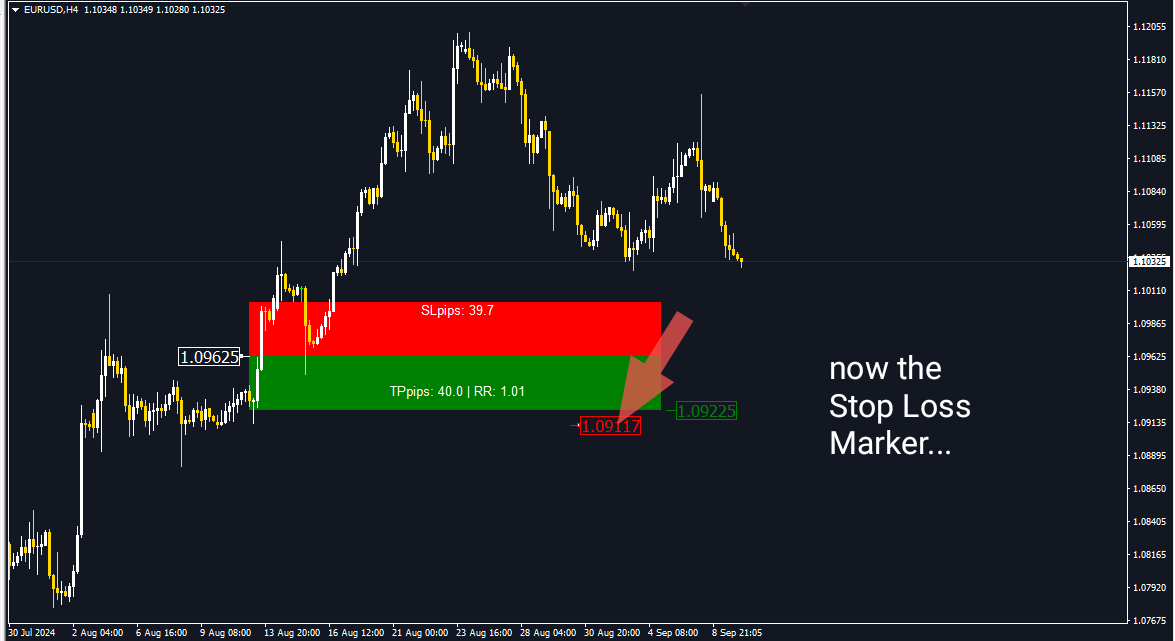
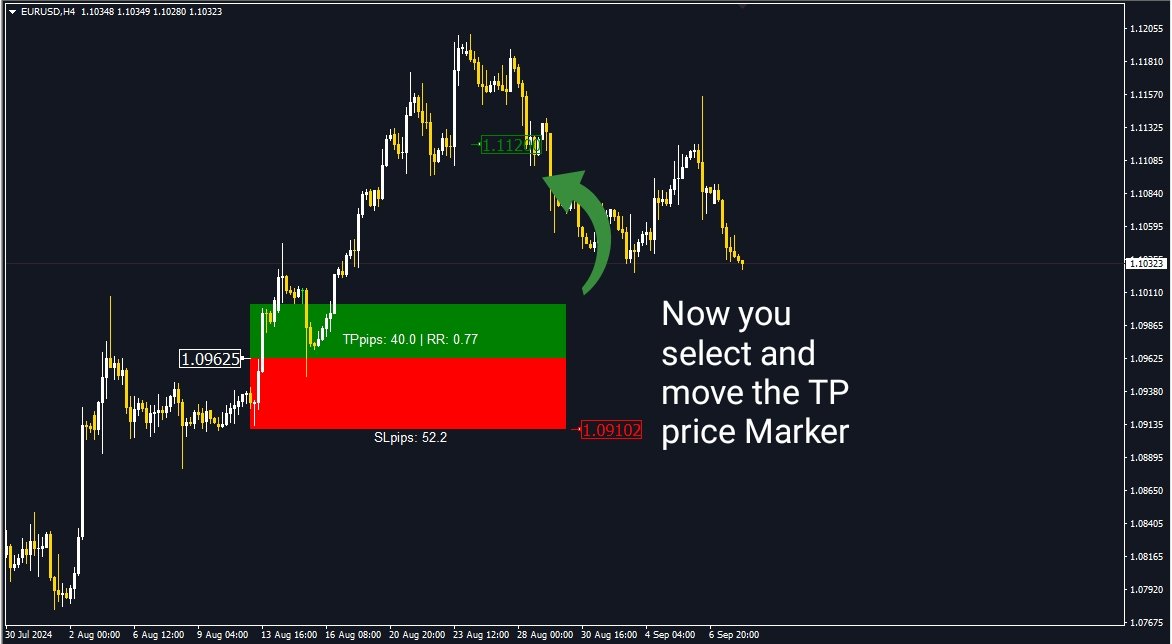
  • 风险/回报比率计算: 动态显示基于设定水平的风险/回报比率。

使用方法:

  1. 设置入场价格: 点击图表以设置您的入场价格。
  2. 调整SL和TP水平: 移动SL和TP区域,以调整风险和回报水平。
  3. 查看区域: SL和TP区域将以不同的颜色显示,以方便可视化。

即将推出: 更新版本将在几天内发布,提供更多功能和改进,以实现更有效的交易管理。

请求: 如果您觉得 RR_TradeManager Visualizer 有用,请在产品页面上进行评分。您的反馈对我们非常重要,有助于改进我们的工具。


推荐产品
Tract
Andriy Sydoruk
Tract - Channel indicator, by which you can place orders like a classic channel indicator. Trading can be carried out inside the channel when the price reaches its borders and turns in the opposite direction from them. In such cases, reversal strategies are used. The channel indicator is designed to work with support and resistance levels and help traders find opportunities to enter the market. Another way to trade a breakout - assumes a situation when the price, upon reaching one or another cha
DailyHighLow
Komi Eyram F Kahoho
请不要忘记给指标评分,以帮助我提高其可见性。 DailyHighLow 指标是专为 MetaTrader 4 (MT4) 平台设计的强大工具,旨在帮助交易者跟踪每日的价格波动。该指标可以自动绘制趋势线,基于自定义时间段内的最高价和最低价,为需要准确市场信息的交易者提供清晰的视觉辅助。 主要特点: 趋势线个性化设置: 根据您的交易偏好,调整趋势线的颜色、样式和宽度,包括破位线和未破位线。 动态更新: 自动根据最新的市场数据调整趋势线,并使用明显的视觉标记来显示破位情况。 灵活参数设置: 选择显示趋势线的天数,设置破位后趋势线的结束时间,并为最高价和最低价自定义趋势线的外观。 清晰的视觉效果: 通过不同的颜色和线条样式轻松区分破位和未破位的趋势线,使您可以一目了然地识别市场的关键水平。 此指标非常适合希望通过清晰且可自定义的趋势线来增强技术分析的交易者,无论是分析短期趋势还是长期市场动向,DailyHighLow 指标都能为您的交易策略提供宝贵的信息支持。
FREE
Candle EA MT4
Mansour Babasafary
3.6 (20)
This expert is based on patterns The main patterns of this specialist are candlestick patterns Detects trends with candlestick patterns It has a profit limit and a loss limit, so it has a low risk The best time frame to use this expert is M30 time frame The best currency pairs to use with this expert is the EURUSD, GBPUSD, AUDUSD, USDCAD currency pairs Attributes: Can be used in the EURUSD, GBPUSD, AUDUSD, USDCAD  currency pairs Can be used in M30, H1, H4 time frames Has profit limit and loss
This indicators automatically draws the Support and resistances levels for you once you've dropped it on a chart.  It reduces the hustle of drawing and redrawing these levels every time you analysis prices on a chart. With it, all you have to do is dropped it on a chart, adjust the settings to your liking and let the indicator do the rest.  But wait, it gets better; the indicator is absolutely free!  Get the new and improved version here:  https://youtu.be/rTxbPOBu3nY Parameters Time-frame  -> T
FREE
FiboPlusWaveRunner
Sergey Malysh
3.29 (7)
Expert.   Automatic and manual trading. Ready-made trading system based on   Elliott waves   and Fibonacci retracement levels . It is simple and affordable. Display of the marking of Elliott waves (main or alternative option) on the chart. Construction of horizontal levels, support and resistance lines, a channel. Superposition of Fibonacci levels on waves 1, 3, 5, A Alert system (on-screen, E-Mail, Push notifications).    visual panel for opening orders in manual trading. visual panel for sett
Psy Levels
THE FWA COMPANY
This free MT4 indicator allows you to automatically display psychological price levels on your chart It's very powerful when you combine it with other tools such as Fibs levels, Supports & Resistance levels, Moving Averages, Wyckoff schematics, etc. For example, you can use this indi to display horizontal levels every 100 points on your GER40 chart, or 500 points on your BTC chart, etc. ***Please comment, rate and share it to your friends if you like it***
FREE
The only volatility calculator for ANY custom time period. Place up to 5 vertical lines on chart at your chosen times to find the average volatility / expected price movement for any custom time period starting at each line time (e.g. from the time you opened your trade  or from the start of a session etc). Use the average volatility to set achievable take profit targets for your trades.  Also use the visual on-chart HISTORICAL lines to easily analyse price action at specific times of day + get
Fibonacci Retracements Pro
Savia Forex Software Solutions
Fibonacci Retracements Pro The Fibonacci Retracements Pro is a powerful yet easy to use indicator. It automatically plots all the important Fibonacci retracement and extension levels for you. FRP is dynamic powerful and seamlessly adjusts to whatever timeframe you are analyzing. Fibonacci Retracement Pro is optimized for ALL timeframes and ALL Currency pairs, Indices, Commodities, and Cryptocurrency pairs. Trade with improved confidence and maximize your success rate. Benefits Dynamic and Power
It contains four major utilities:  ZeroRisk   Trade Pad  to open and manage trades,  ZeroRisk Manual Trader , a ssistant for manual traders to control the trading plan and prop firm rules, ZeroRisk Algo Trader , assistant for algo traders to control and monitor EAs and ZeroRisk Telegram Signal Provider  to send manual or EA signal to telegram. This assistant supports news filter from top 3 trusted news website ( Investing.com, Daily FX ,  Forex Factory ) and auto GMT offset from  Worldtimeserve
Fibo Scalper Pro
Thushara Dissanayake
2.33 (3)
Fibo Scalper Pro Expert Advisor 是一款功能强大的工具,旨在自动执行流行的 斐波那契交易策略 。它通过在图表上自动绘制和调整斐波那契水平来简化交易过程。此功能为在其分析中使用斐波那契回撤和扩展的交易者提供了便利和准确性。 Fibo Scalper Pro 的主要特点之一是其定制功能。它允许专业交易者根据他们的特定交易偏好启用或禁用每个斐波那契水平。这种级别的定制确保交易者可以根据他们的个人策略和交易风格定制工具。 为了进一步增强交易信号,Fibo Scalper Pro 结合了流行的指标,例如 RSI、CCI 和随机指标。这些指标用作验证斐波那契信号的过滤器,提高交易策略的整体准确性和可靠性。 Expert Advisor 还包括适当的风险管理系统,这对于有效保护资本和管理风险至关重要。交易者可以定义手数、最大风险百分比、追踪止损、止损和止盈等参数,以符合他们的风险承受能力和交易目标。 此外,Fibo Scalper Pro 提供快速活动,确保根据生成的信号及时执行交易。交易者即使没有主动监控图表,也可以收到通知提醒,随时了解交易机会。 Fib
The Arrow Scalper
Fawwaz Abdulmantaser Salim Albaker
1 (2)
Dear Friend..  I share with you this simple Expert Adviser .. it is full automatic  this Expert Adviser following the trend of the pair you install on or any stocks or indices , it is works like that: - when the trend on H4 chart show a start of up trend the expert will wait till the 15M & 1H charts show an up trend the EA will open a buy order directly , and do the same for down trend and open a sell order the buy or sell  order lot size and take profit and stop loss will measured manually  by
FREE
Fibonacci theft   is an ultrascalping system that uses Fibonacci levels to launch a scalping system that allows   theft     a few pips from the market. This system allows the use of fibonacci levels, predetermined levels or a level chosen by the user. It also presents the option of using or not volume and impulse filters. Being a very aggressive scalping system, it should only be used in pairs with a low spread and low commissions. This system is suitable for small accounts and can be used wit
The   Pivot Point indicator   automatically calculates and displays the pivot point line and support and resistance levels. Pivot can be calculated according to the Classic, Floor, Fibonacci, Woodie, Camarilla or DeMark formula. It is also possible to select the period for calculating the indicator. A trader can choose from daily, weekly, monthly, or user-defined periods. Types of pivots Classic Floor Fibonacci Woodie Camarilla DeMark Main features The indicator shows the current and historic
FREE
XFibo Auto Fibonacci
Welinton Dos Reis Goncalves
5 (1)
Use with disciplined risk management. Fibonacci entry system based on the golden zone 38.2 - 61.8 where the entry is confirmed at 23.6 with indications of Take Profit 3:1. Automatically plotted Fibonacci contains retracement and expansion Fibonacci in a single indicator. Up to 77% win rate with this system. FTMO challenge pass with 0.50% risk and 1.50% R:R.
Risk Reward Panel Demo
HESAMEDDIN ABDOLRAHIM RAHI
1 (1)
This is a useful tool to plan a trade risk to reward visually. The indicator is very simple to use with minimum settings.  Long or Short You can use the indicator for both long and short positions.  Lot Size Calculator You can also use this indicator as a lot size calculator. If you set the risk amount the indicator will calculate the lot size for you based on the stop loss line. You do not need to calculate the lot size manually.  Free Version Free versions works fully on EURUSD pair. For othe
FREE
Pivot levels Auto V1
Hafis Mohamed Yacine
What Is a Pivot Point? A pivot point is a technical analysis indicator, or calculations, used to determine the overall trend of the market over different time frames. The pivot point itself is simply the average of the intraday high and low, and the closing price from the previous trading day. On the subsequent day, trading above the pivot point is thought to indicate ongoing bullish sentiment, while trading below the pivot point indicates bearish sentimen How to Use Pivot Points The very ess
Trend Catcher with Alert
Issam Kassas
4.69 (62)
趋势捕捉器: 具有警示指标的趋势捕捉器策略是一种多功能的技术分析工具,可帮助交易员识别市场趋势和潜在的进出点。它采用动态趋势捕捉器策略,根据市场条件进行调整,清晰地呈现趋势方向。交易员可以自定义参数,以符合其偏好和风险容忍度。该指标有助于识别趋势,发出潜在的反转信号,充当跟踪止损机制,并提供实时警报,以便及时应对市场。 具有警示指标的趋势捕捉器策略是一种多功能的技术分析工具,可帮助交易员识别市场趋势和潜在的进出点。它采用动态趋势捕捉器策略,根据市场条件进行调整,清晰地呈现趋势方向。交易员可以自定义参数,以符合其偏好和风险容忍度。该指标有助于识别趋势,发出潜在的反转信号,充当跟踪止损机制,并提供实时警报,以便及时应对市场。 特点: 趋势识别:信号牛市趋势和熊市趋势。 趋势反转:当蜡烛颜色从牛市变为熊市,反之亦然时,提醒可能的反转。 实时警报:为新趋势识别生成警报。 建议: 货币和货币对:EURUSD,AUDUSD,XAUUSD... 时间框架:H1。 账户类型:任何ECN,低点差账户。
FREE
Reversal Monster Mini
Abdulfattah Yahya Mohammed Alhazmi
The Most advanced and comprehensive EA to trade Trend Reversals/Pullbacks It is a very profitable EA, to trade trends breakout, and manage trades, takeprofit, stoploss, move to breakeven, and trailing stop. The   “Reversal Monster EA”   trades Reversal/Pullbacks when the current price of the pair pullback to a predefined horizontal level or trendline on the currency chart. The opening of the position can be immediate after pullback to the drawn trendline or after closing the candle below/above
FREE
This Expert Advisor is designed for news trading. This version is the professional version for MT4. The price of this version is going to be 50 USD for a limited number of copies. The Final price is 99 USD. Please find below the MT5 version of this expert: News Advisor MT5 Pro. The main advantage of this expert is that it’s offering backtesting capabilities (something that is not found in most news expert advisors). This ability gives you the opportunity to optimize and test the efficacity, the
此多品种指标旨在自动识别价格何时达到主要心理水平。也称为整数、整数或关键级别。作为奖励,它还可以在一个选定的时间范围内扫描枢轴点水平。结合您自己的规则和技术,该指标将允许您创建(或增强)您自己的强大系统。 特征 可以将信号写入文件,智能交易系统可以使用该文件进行自动交易。 可以同时监控您的市场报价窗口中可见的所有交易品种。将该指标仅应用于一张图表,并立即监控整个市场。 当价格达到整数水平时向您发送实时警报。支持所有 Metatrader 原生警报类型。 该指标包括一个用于存储信号的图表面板。 输入参数 请在此处 找到输入参数的说明和解释。 重要的 请注意,由于具有多功能性,既不会在安装指标的图表上绘制买入/卖出建议,也不会绘制线条和箭头。圆形水平线将绘制在图表上,当单击面板中的信号时将打开该水平线。强烈建议将指标放在干净的图表上,不要在其上放置任何其他可能干扰扫描仪的指标或智能交易系统。
FORCES VARIATION
Nacer Kessir
5 (2)
The most important thing in my system of forces, is the variation and changing of these forces. It is the key to the whole system, and from this point, my second indicator called FORCES-VARIATION appeares important. The indicator is represented in a separate window in the form of the green histogram and the red curve . The parameter NPIuPeriod represents the number of bars on which we calculate the variation of buyers forces. The parameter NPIdPeriod represents the number of bars on which we cal
Ratio market
Aleksandr Krokhalev
4.33 (15)
Volatility under control. The indicator shows the optimal depth for setting goals within the day and on the average trend. It also builds pivot zones for the estimated correction depth. As an accompaniment, the key levels of the structure are displayed for several timeframes. Classical volatility indicators ATR & ADX on fixed timeframes are used for calculation. The calculation takes into account the spread, and if the market is slightly volatile, you will see a warning about the risk. You can c
FREE
Utility for show on charts the visual informations about: - a vertical line at start of each bar of selected timeframe - a vertical line at start of each day - a vertical line at start of each week - vertical lines at start / end of trading sessions selected - bid / ask prices, spread, money value for each point (of 1 standard lot) and last tick time recived" You can enable / disable each information and set the color for each line
FREE
Leo Fibonacci
Dmitriy Zaytsev
The indicator is designed for determining Fibonacci levels. Does not repaint/redraw The blue level shows the zero Fibonacci value (it is also the Pivot level) Red levels show calculated Fibonacci levels (used as a rollback or reversal point) Automatic period detection (periods can be entered manually) Adjustable display calculation method. Settings BarsHistory - the number of bars to be used to display the indicator. Method - method of calculation. AutoPeriod - automated period calculation (true
Ratio for MT4
Radim Kucera
This indicator shows ratios between extremes on the chart. You can specify your own ratios (e.g. Fibonacci). Parameters Most important Density - how much in details to search ratios in extremes. Bigger number means less details, smaller number means more details. Base unit is 1 bar on the chart. History - how far to go in history while searching. When you set -1, the indicator processes all bars from history. Base unit is 1 bar on the chart. Range - how far search ratios from given extreme. Bas
FREE
This EA is an extension for the free trade indicator Trend Mate . https://www.mql5.com/en/market/product/50082 The main idea is to support your decision to  trade  according to the current trend. It is possible to configure alert and push notification to receive when entering to first candle for bull / bear trend. For this extension of the free indicator now it is possible to filter the current trend info with other timeframes. For example show trend for timeframe M5 considering also timeframe
This indicator graphically displays profit ($),risk/reward and % of risk according SL&TP Open orders on Current Symbol. when you open orders on current symbol and set StoplLoss and TakeProfit this indicator automatically calculate Risk/Reward and  calculate %risk Of Equity Account that your order get  stop Loss. If you trade on several symbols at the same time, you can install the indicator on each one separately and see the relevant calculations on each one.
FREE
Vertical time lines
Bekhterev Sergey
5 (1)
Vertical time lines. A simple indicator that draws on the graph vertical lines of time. 1,3,5,10,12,15,20,30,60 minutes. You can change the line color, line style, select a time period from 1 to 60 minutes. Applies to any chart, timeframe. Incoming parameters: Minute_Num = 20;           // step 3,5,12,10,20,15,30,60 minutes color Line_Color = clrYellow; // color line Line_Dash = 2;                //0,1,2,3,4... solid, dash, dot, dash dot,dash dot dot
FREE
This indicator prepared by using 57 days moving averagr and least square method. It can only work for 1 hr time interval. Once a signal created. It is creating order and 2 limit orders. It works in CFD pairs as well as in Forex pairs. You can fins our other products from link : https://www.mql5.com/en/users/drbastem/seller Also, you can ask all your questins from email : haskayafx@gmail.com or mobile : +90 530 867 5076 or @MehmetBastem on telegram application This system is for Long term and pr
Take a Break Indicator
Eric Emmrich
4.83 (6)
Please check the " What's new " tab regularly for a complete and up-to-date list of all improvements + parameters. FREE indicator for my trading utility Take a Break . This indicator allows you to manage multiple other EAs with just one Take a Break EA instance. Simply specify the corresponding Chart Group in the indicator(s) and Take a Break EA settings and you are good to go.  Setup examples (Indicator + EA) As a prerequisite, add the URL https://trading.custom-solutions.it to the list of al
FREE
该产品的买家也购买
Gann Made Easy
Oleg Rodin
4.79 (109)
Gann Made Easy 是一个专业且易于使用的外汇交易系统,它基于使用先生理论的最佳交易原则。 W.D.江恩。该指标提供准确的买入和卖出信号,包括止损和获利水平。您甚至可以使用推送通知在旅途中进行交易。 购买后请联系我!我将免费与您分享我的交易技巧和丰厚的红利指标! 您可能已经多次听说过江恩交易方法。通常 Gann 的理论不仅对于新手交易者而且对于那些已经有一定交易经验的人来说都是非常复杂的东西。这是因为江恩的交易方法在理论上并不那么容易应用。我花了几年时间来完善这些知识,并将最好的原则应用到我的外汇指标中。 该指标非常易于应用。您所需要的只是将其附加到您的图表并遵循简单的交易建议。该指标不断进行市场分析工作并寻找交易机会。当它检测到一个好的入口点时,它会为您提供一个箭头信号。该指标还显示止损和获利水平。 换句话说,当您像先生一样进行交易时,该指标会为您提供最佳江恩建议。江恩亲自告诉你此时此刻该做什么。但最好的部分是您不需要了解任何有关江恩交易原则的知识,因为该指标会为您完成整个市场分析工作。
Dynamic Forex28 Navigator
Bernhard Schweigert
5 (4)
Dynamic Forex28 Navigator - 下一代外汇交易工具。 当前 49% 折扣。 Dynamic Forex28 Navigator 是我们长期流行的指标的演变,将三种功能合二为一: 高级货币强度 28 指标 (695 条评论)+ 高级货币 IMPULSE 带警报 (520 条评论)+ CS28 组合信号(奖励)。 有关指标的详细信息 https://www.mql5.com/en/blogs/post/758844 下一代强度指标提供什么? 您喜欢的原始指标的一切,现在通过新功能和更高的精度进行了增强。 主要特点: 专有货币强度公式。  所有时间范围内的平滑和准确的强度线。 非常适合识别趋势和精确进入。 动态市场斐波那契水平(市场斐波那契)。  此指标独有的独特功能。 斐波那契应用于货币强度,而不是价格图表。 适应实时市场活动以获得准确的反转区域。 实时市场动量。  第 9 行显示市场是活跃还是被动。 对于定时交易至关重要。 全面的警报和显示。  每种货币最强的买入和卖出动量。 ​​28 对的双重动量买入和卖出。 超买/超卖警告外部范围和止损。 反转
-   Real price is 80$   - 40% Discount ( It is 49$ now ) - Lifetime update free Contact me for instruction, add group and any questions! Related Products:  Bitcoin Expert , Gold Expert - Non-repaint - I just sell my products in Elif Kaya profile, any other websites are stolen old versions, So no any new updates or support. Introduction The breakout and retest strategy is traded support and resistance levels. it involves price breaking through a previous level.  The break and retest strategy is
Scalper Inside PRO
Alexey Minkov
4.75 (61)
!SPECIAL SALE!  An exclusive indicator that utilizes an innovative algorithm to swiftly and accurately determine the market trend. The indicator automatically calculates opening, closing, and profit levels, providing detailed trading statistics. With these features, you can choose the most appropriate trading instrument for the current market conditions. Additionally, you can easily integrate your own arrow indicators into Scalper Inside Pro to quickly evaluate their statistics and profitability
FX Levels MT4
Daniel Stein
5 (2)
FX Levels:适用于所有市场的高精度支撑与阻力 快速概览 想要精准确定适用于任何市场(外汇、指数、股票或大宗商品)的支撑与阻力吗? FX Levels 将传统的“Lighthouse”方法与前沿的动态分析相结合,实现近乎通用的准确性。依托真实经纪商经验和自动化的每日与实时更新, FX Levels 帮助您捕捉价格反转点、设置合理的盈利目标,并自信地管理交易。立即使用,体验更准确的支撑/阻力分析如何助力您的交易更上层楼! 1. 为什么 FX Levels 对交易者非常有利 极度精准的支撑 & 阻力区 • FX Levels 专为不同经纪商提供的行情源和时间设置而设计,可生成几乎相同的价位区,解决数据不一致的常见问题。 • 这意味着无论您在哪里交易,都能获得稳定一致的水平线,为策略打下更加牢固的基础。 结合传统与先进技术 • 通过将久经考验的“Lighthouse”方法与动态分析相融合, FX Levels 不仅限于每日刷新,还可针对新的价格波动进行即时更新。 • 您可以选择经典的静态方式,或实时捕捉新出现的水平,以贴近最新的市场行为。 识别清晰的反转点 • FX Lev
FX Volume
Daniel Stein
4.59 (34)
FX Volume:从经纪商视角洞察真实市场情绪 简要概述 想要提升您的交易策略? FX Volume 可提供零售交易者和经纪商的持仓实时数据——远早于诸如 COT 之类的延迟报告。不论您希望获得持续稳定的收益,还是想在市场中多一分制胜的砝码, FX Volume 都能帮您识别重大失衡、确认突破以及完善风险管理。立即开启体验,让真实的成交量数据为您的交易决策带来革新! 1. 为什么 FX Volume 对交易者格外有用 极具准确度的早期预警 • 快速捕捉有多少交易者正在买入或卖出某个货币对——比大多数人提前一步。 • FX Volume 是 唯一 能够整合多家零售经纪商真实成交量数据并以简洁方式呈现的工具。 强力风险管理 • 及时识别多头或空头仓位的巨大不平衡,这往往预示着潜在的趋势反转,帮助您更自信地设置止损和目标位。 • 独家而真实的数据让每一次交易决策更具可靠性。 优化进场与出场点 • 发现“过度集中”的交易(大多数交易者都在同一方向),并通过真实成交量来确认突破。 • 避免依赖常见指标可能带来的误导信号,而是利用真实的实时成交量。 适配各种交易策略 • 将 FX
IX Power MT4
Daniel Stein
4.67 (6)
IX Power:解锁指数、大宗商品、加密货币和外汇市场洞察 概述 IX Power 是一款多功能工具,可分析指数、大宗商品、加密货币和外汇市场的强弱表现。 FX Power 提供针对货币对的最高精度,利用所有可用货币对数据进行分析,而 IX Power 专注于基础资产的市场数据。这使得 IX Power 成为非外汇市场的理想选择,同时在需要简单外汇分析时也非常可靠。它可以无缝适用于任何图表,提供清晰的、有行动价值的洞察,帮助提升您的交易决策。 1. 为什么 IX Power 对交易者非常有价值 多市场强弱分析 • IX Power 分析指数、大宗商品、加密货币和外汇市场的强弱表现,为每个市场提供量身定制的洞察。 • 监控 US30、WTI、黄金、比特币等资产的表现,发现交易机会。 适用于更广泛的市场 • 对于外汇交易, FX Power 提供无与伦比的精度,通过分析所有相关货币对。 • IX Power 专注于基础资产的市场数据,非常适合非外汇市场及简化的外汇分析。 实时适应性 • 借助自适应算法, IX Power 实时响应市场数据变化,保持分析的最新性。 • 实时更新
FX Power MT4 NG
Daniel Stein
4.94 (18)
FX Power:分析货币强度,助您做出更明智的交易决策 概述 FX Power 是一款专业工具,帮助您全面了解主要货币和黄金在任何市场条件下的真实强度。通过识别强势货币用于买入,弱势货币用于卖出, FX Power 简化了交易决策,并帮助您发现高概率的交易机会。不论您是想跟随趋势还是通过极端的 Delta 值预测反转,这款工具都能完美适应您的交易风格。别再盲目交易——用 FX Power 让您的交易更加智慧。 1. 为什么 FX Power 对交易者极具价值 实时货币和黄金强度分析 • FX Power 实时计算并显示主要货币和黄金的相对强度,助您全面了解市场动态。 • 监控领先或落后资产,轻松识别值得交易的货币对。 全面的多时间框架视图 • 跟踪短期、中期和长期时间框架的货币和黄金强度,以便将您的交易策略与市场趋势保持一致。 • 无论是快进快出的短线交易还是更长期的投资策略, FX Power 都能为您提供所需的信息。 Delta 动态分析用于趋势和反转 • 极端 Delta 值常常预示反转机会,而平缓的 Delta 变化则确认趋势延续。 • 使用 Delta 分析,轻
Advanced Supply Demand
Bernhard Schweigert
4.91 (294)
现在优惠 33%! 任何新手或专业交易者的最佳解决方案! 该指标是一款独特、高质量、且价格合理的交易工具,因为我们已经整合了许多专有功能和新公式。 依据此更新,您将能够显示双重时间帧区域。 您不仅可以显示一个较高的时间帧,还可以同时显示图表时间帧,加上更高的时间帧:显示嵌套时区。 供需双方所有交易者都会喜欢它。 :) 重要信息披露 高级供需的最大潜力,请访问 https://www.mql5.com/zh/blogs/post/720245   想象您的交易如何得以改善,是因为您能够精准定位入场或目标位吗? 构建于新的底层算法,它可以更轻松地识别出买卖双方之间的潜在失衡。 这是因为它以图形方式展示供需最强劲区域,及其过去的表现(显示旧区域)。 这些功能旨在帮助您更轻松地发现最佳入场区域和价位。 现在您可以针对您的交易品种和时间帧来优化和编辑区域强度! 高级供需指标适用于所有产品和时间帧。 它是一个新的公式,非常新的功能是两个区域强度函数可由用户输入进行调整! 这在交易中是一大优势。 当您学习如何使用专有功能,例如带有价格游离最小 X 因子的区域强度时,您能够判断该区域强劲与否。 供需
Scalper Vault
Oleg Rodin
5 (28)
Scalper Vault 是一个专业的剥头皮系统,为您提供成功剥头皮所需的一切。该指标是一个完整的交易系统,可供外汇和二元期权交易者使用。推荐的时间范围是 M5。 该系统为您提供趋势方向的准确箭头信号。它还为您提供顶部和底部信号以及江恩市场水平。无论您拥有何种交易经验,该系统都易于使用。您只需要遵循简单的规则并每天重复该过程。 建议将此系统用于主要货币对。感谢您的关注! 请注意,该指标在策略测试器中可能无法正常工作。因此,我建议仅在模拟或真实账户的真实交易条件下使用该系统。 指示器提供所有类型的警报,包括推送通知。 购买指标后请与我联系。我将免费与您分享我的个人交易建议和出色的奖励指标! 祝您交易愉快,盈利!
Chart Patterns All in One
Davit Beridze
4.68 (19)
以演示模式试用 "Chart Patterns All in One" 并获得奖励。试用后,请发送消息给我以领取奖励。 购买后留言即可获得8个高质量的指标作为赠品。 Chart Patterns All-in-One 指标帮助交易者可视化技术分析中常用的各种图表形态。它帮助识别潜在的市场行为,但不保证盈利。建议在购买前在模拟模式下测试该指标。 当前优惠 : “Chart Patterns All in One” 指标享受 50% 折扣。 包含的形态 : 1-2-3 形态 :通过三个关键点(高点或低点)检测市场反转。 买入 :连续两个低点后出现较低的高点。 卖出 :连续两个高点后出现较高的低点。 可视化 :线条和箭头连接识别的点。 双顶和双底 :当价格形成两个连续的高点(双顶)或低点(双底)且它们大致相等时,表明反转趋势。 双顶 :看跌反转。 双底 :看涨反转。 可视化 :线条连接峰值或低谷,箭头标记反转点。 三顶和三底 :与双顶/双底类似,但有三个连续的高点或低点,信号更强的反转趋势。 三顶 :看跌反转。 三底 :看涨反转。 可视化 :线条和箭头标记形态。 三角形 :在趋势延续前识别
Currency Strength Exotics
Bernhard Schweigert
4.87 (31)
目前8折优惠! 对任何新手或专家交易者来说都是最好的解决方案! 这个指标是专门用来显示任何符号的货币强度,如异国货币对、商品、指数或期货。它是同类产品中的第一个,任何符号都可以添加到第9行,以显示黄金、白银、石油、DAX、US30、MXN、TRY、CNH等的真实货币强度。这是一个独特的、高质量的、负担得起的交易工具,因为我们已经纳入了一些专有的功能和一个新的公式。想象一下,你的交易将如何改善,因为你能够准确地确定新趋势或剥头皮机会的触发点? 用户手册:点击这里   https://www.mql5.com/en/blogs/post/708876 它适用于所有时间框架。你将很快能够看到TREND! 根据新的基础算法设计,它使识别和确认潜在交易变得更加容易。这是因为它以图形方式显示了8种主要货币和一种符号的强弱。 该指标显示了8种主要货币(澳元加元瑞士法郎欧元英镑日元新西兰美元)的强弱线,再加上一个符号! 该指标显示了符号的真实价值。例如:对于XAUUSD(黄金):价格以美元报价。如果黄金在上涨,你怎么能知道是黄金的强势还是美元的弱势?只有当黄金走强时,我们才会进行交易。该指
Easy Breakout
Mohamed Hassan
5 (9)
After your purchase, feel free to contact me for more details on how to receive a bonus indicator called VFI, which pairs perfectly with Easy Breakout for enhanced confluence!   Easy Breakout is a powerful price action trading system built on one of the most popular and widely trusted strategies among traders: the Breakout strategy ! This indicator delivers crystal-clear Buy and Sell signals based on breakouts from key support and resistance zones. Unlike typical breakout indicators, it levera
Black dragon indicator
Ramil Minniakhmetov
4.86 (118)
趋势检测指标将补充任何策略,也可用作独立工具。 使用该指标的建议,您可以在评论 #8 中下载 好处 易于使用,不会因不必要的信息而使图表过载; 可用作任何策略的过滤器; 具有内置的动态支撑和阻力水平,可用于获利和设置止损; 指标在烛台关闭后不会改变颜色;  适用于股票市场、指数、石油、黄金和所有时间范围; 具有吐司通知、邮件通知、推送通知和声音提醒功能。 我的其他开发可以在这里找到: https://www.mql5.com/zh/users/mechanic/seller 输入参数 Alert - 开/关。警报; Push Notification - 开/关。推送通知; Mail - 开/关电子邮件通知; Fibo 1,2,3,4,5,6,7,11,21,31,41,51,61,71 - 动态支撑和阻力位的设置。
Gold Venamax MT4
Sergei Linskii
5 (1)
Gold Venamax   - 這是最好的股票技術指標。 此指標演算法分析資產的價格變動並反映波動性和潛在的進入區域。 指標特點: 這是一個帶有 Magic 和兩個趨勢箭頭塊的超級指標,可實現舒適且有利可圖的交易。 圖表上顯示用於切換方塊的紅色按鈕。 Magic 在指標設定中進行設置,以便您可以將指標安裝在顯示不同區塊的兩個圖表上。 Gold Venamax 可以放置在具有不同箭頭緩衝區(GV 和 SD)的兩個圖表上。 為此,您需要在設定中選擇不同的 Magic,例如,一個具有 Magic = 999,另一個具有 Magic = 666。接下來,您可以使用圖表上的紅色按鈕選擇箭頭緩衝區。 進入的最佳訊號 = 遵循兩個緩衝區的訊號箭頭(GV 和 SD)+ 所有三個 MA 線(紅色或藍色)的方向 + TMA 通道邊界(下或上) 。 TMA 通道邊界(下限或上限)也可用於鎖定利潤和/或以較短的停損位進行逆勢風險交易。 此指標的優點: 1. 此指示器產生高精度訊號。 2. 確認 SD 緩衝區的箭頭訊號為非重繪。只有當趨勢強勁時,GV 緩衝區的確認箭頭訊號才能重建。 3. 您可以
Golden Trend Indicator
Noha Mohamed Fathy Younes Badr
4.9 (10)
Golden Trend indicator  is The best indicator for predicting trend movement this indicator never lags and never repaints and never back paints    and give  arrow buy and sell    before the candle appear  and it will help you and  will make your trading decisions clearer its work on all currencies and  gold and crypto and all time frame This unique  indicator uses very secret algorithms to catch the  trends, so you can trade using this indicator and see the trend clear on charts  manual guide and
Trend Screener
STE S.S.COMPANY
4.78 (93)
趋势指标,趋势交易和过滤的突破性独特解决方案,所有重要趋势功能都内置在一个工具中! 它是 100% 非重绘多时间框架和多货币指标,可用于所有符号/工具:外汇、商品、加密货币、指数、股票。 限时优惠:支撑和阻力筛选指标仅售 50美元,终身有效。(原价 250 美元)(优惠延长) 趋势筛选器是有效的指标趋势跟踪指标,它在图表中提供带有点的箭头趋势信号。 趋势分析器指标中可用的功能: 1.趋势扫描仪。 2. 具有最大利润分析的趋势线。 3.趋势货币强度计。 4. 带有警报的趋势反转点。 5. 带有警报的强趋势点。 6. 趋势箭头 每日分析示例,每日信号表现...等与我们的趋势筛选指标,可以在这里找到: 点击这里 限时优惠:Trend Screener Indicator 仅售 50 美元且终身可用。原价 125$) 通过访问我们的 MQL5 博客,您可以找到我们所有的高级指标以及分析示例、每日信号表现...等。 : 点击这里 我们的趋势系统由 2 个指标组成: 1. Trend Screener Indicator:显示趋势仪表盘、图表中的趋势线、入场点...等。 2. Trend
首先,值得强调的是,这个交易工具是非重绘、非重画和非滞后的指标,非常适合专业交易。 在线课程,用户手册和演示。 智能价格行动概念指标是一个非常强大的工具,既适用于新手,也适用于经验丰富的交易者。它将超过20个有用的指标合并到一个指标中,结合了高级交易思想,如内圈交易员分析和智能资金概念交易策略。该指标侧重于智能资金概念,提供有关大型机构交易方式的见解,帮助预测它们的动向。 它在流动性分析方面尤其擅长,有助于理解机构的交易方式。它擅长预测市场趋势,并仔细分析价格波动。通过将您的交易与机构策略对齐,您可以更准确地预测市场走向。该指标多才多艺,擅长分析市场结构,识别重要的订单区块,并识别各种模式。 它擅长识别BOS和CHoCH等模式,理解动量的转变,并突出显示供需强劲的关键区域。它还擅长发现强大的不平衡,并分析价格创造更高高点或更低低点的模式。如果您使用斐波那契回撤工具,该指标可以满足您的需求。它还可以识别相等的高点和低点,分析不同的时间框架,并通过仪表板显示数据。 对于使用更高级策略的交易者,该指标提供了工具,如公平价值差指标和优惠和折扣区域的识别。它特别关注高时间框架订单区块,并
Gold Stuff
Vasiliy Strukov
4.86 (249)
Gold Stuff 是专为黄金设计的趋势指标,也可用于任何金融工具。 该指标不会重绘,也不会滞后。 推荐时间框架 H1。 在它指标工作全自动专家顾问 EA Gold Stuff。 你可以在我的个人资料中找到它。 重要! 购买后立即与我联系,以获得说明和奖金!   您可以免费收到我们的强力支持和趋势扫描指标的副本,请私信。大部头书! 购买后立即联系我以获得设置和个人奖励!   设置 绘制箭头 - 打开关闭。 在图表上绘制箭头。 警报 - 打开关闭声音警报。 电子邮件通知 - 打开关闭。 电子邮件通知。 Puch-notification - 打开关闭。 推送通知。 接下来,调整色域。 Gold Stuff 是专为黄金设计的趋势指标,也可用于任何金融工具。 该指标不会重绘,也不会滞后。 推荐时间框架 H1。 在它指标工作全自动专家顾问 EA Gold Stuff。 你可以在我的个人资料中找到它。 购买后立即联系我以获得设置和个人奖励!   设置 绘制箭头 - 打开关闭。 在图表上绘制箭头。 警报 - 打开关闭声音警报。 电子邮件通知 - 打开关闭。 电子邮件通知。 Puch
TPSpro RFI Levels
Roman Podpora
4.85 (27)
指示       俄罗斯 -        英语   建议 与指示器一起使用     -       TPSpro 趋势专业版 -   MT4版本       交易中的一个关键要素是做出买卖交易工具决定的区域或水平。尽管主要参与者试图隐藏他们在市场中的存在,但他们不可避免地会留下痕迹。我们的任务是学习如何识别这些痕迹并正确解释它们。 主要功能: 向卖家和买家显示活跃区域! 该指标显示所有正确的初始买入和卖出脉冲水平/区域。激活这些水平/区域后,开始寻找切入点,水平会改变颜色并填充特定阴影。此外,还会显示箭头,以便更直观地了解情况。 显示更高时间范围内的级别/区域(MTF 模式) 添加了使用更高时间间隔显示级别/区域的功能。此外,该指标还具有自动趋势检测功能(   TPSproTREND PRO   )。 用于交易的单独专业的逐步算法。 该算法专为日内交易而设计,既可顺势交易,也可逆势交易。每个活动模板均提供详细说明。 适用于多种时间范围 。 TPSpro RFI 水平指标可用于图表上的任何时间范围,从一分钟(M1)开始一直到每月(MN)。 图形和声音警报。 该指标提供图形和声音指示,
Bull versus Bear
Mohamed Hassan
4.5 (18)
Send us a message after your purchase to receive more information on how to get your  BONUS  for FREE  that works in great combination with Bull vs Bear ! Bull versus Bear is an easy-to-use Forex indicator that gives traders clear and accurate signals based on clear trend retests . Forget about lagging indicators or staring at charts for hours because  Bull vs Bear provides real-time entries with no lag and no repaint, so you can trade with confidence. Bull vs Bear  helps you enter trades durin
Beast Super Signal
Dustin Vlok
4.73 (89)
正在寻找可以帮助您轻松识别有利可图的交易机会的强大外汇交易指标? Beast Super Signal 就是您的不二之选。 这个易于使用的基于趋势的指标持续监控市场状况,寻找新的发展趋势或跳入现有趋势。当所有内部策略一致且彼此 100% 融合时,Beast Super Signal 会发出买入或卖出信号,无需额外确认。当您收到信号箭头警报时,只需买入或卖出。 购买后给我留言,让我加入我的私人 VIP 群组! (仅限购买完整产品)。 购买后给我发消息以获取最新的优化设置文件。 此处提供 MT5 版本。 在此处 获取 Beast Super Signal EA。 查看评论部分以查看最新结果! Beast Super Signal 根据您偏好的 1:1、1:2 或 1:3 风险回报率建议入场价、止损和获利水平,让您放心交易。这个 Beast Super Signal 是 100% 不可重新绘制的,这意味着它永远不会重新计算或重新绘制,每次都能为您提供可靠的信号。 Beast Super Signal 指标适用于所有时间范围,包括货币对、指数、商品和加密货币对。 Beast Su
Advanced Currency IMPULSE with ALERT
Bernhard Schweigert
4.9 (484)
目前31%的折扣!! 对任何新手或专家交易者来说都是最好的解决方案! 这个指标是一个独特的、高质量的、负担得起的交易工具,因为我们已经纳入了一些专有的功能和一个秘密的公式。只需一张图表,它就能给出所有28种货币对的警报。想象一下,你的交易将如何改善,因为你能够准确地确定新趋势或剥头皮机会的触发点 建立在新的基础算法上,它使识别和确认潜在交易变得更加容易。这是因为它以图形方式显示了一种货币的强势或弱势是否正在加速,并测量了这种加速的速度--把它想象成你汽车中的速度表。当你加速时,事情显然会发生得更快,这在外汇市场上也是一样的,即如果你配对的货币正在向相反的方向加速,你就会发现一个潜在的有利可图的交易。 货币动量的垂直线和箭头将指导你的交易! 动态的市场斐波那契23水平被用作警报触发器,将适应市场活动。如果冲动触及黄色触发线,您将在MetaTrader或您的电子邮件或推送警报中收到警报。然后你就知道作为一个交易员应该做什么。货币对和方向已经给出。只要点击警报按钮,就可以切换到该货币对或打开一个新的图表,以便进一步分析。警报级别可以通过用户输入来改变,可以选择3个敏感度级别。 尽
Special offer : ALL TOOLS , just $35 each! New tools   will be   $30   for the   first week   or the   first 3 purchases !  Trading Tools Channel on MQL5 : Join my MQL5 channel to update the latest news from me 通过 Inversion Fair Value Gaps Indicator 解锁 ICT 的 反转公平价值缺口 (IFVG) 概念的强大功能!这款尖端工具将公平价值缺口 (FVG) 提升到新的水平,通过识别并显示反转 FVG 区域——价格修复后形成的关键支撑和阻力区域。无论您是短线交易者、波段交易者还是长期投资者,IFVG 指标都能为实时决策提供宝贵的见解。 查看 MT5 版本:  Inversion Fair Value Gaps MT5 查看更多产品:   所有 产品 Some Usage Tips for Inversion Fair Value Gaps Mu
PZ Harmonacci Patterns
PZ TRADING SLU
3.17 (6)
可以说,这是您可以为MetaTrader平台找到的最完整的谐波价格形成自动识别指标。它检测19种不同的模式,像您一样认真对待斐波那契投影,显示潜在的反转区域(PRZ),并找到合适的止损和获利水平。 [ 安装指南 | 更新指南 | 故障排除 | 常见问题 | 所有产品 ] 它检测19种不同的谐波价格形态 它绘制了主要,衍生和互补的斐波那契投影(PRZ) 它评估过去的价格走势并显示每个过去的形态 该指标分析其自身的质量和性能 它显示合适的止损和获利水平 它使用突破来表明合适的交易 它在图表上绘制所有样式比率 它实现了电子邮件/声音/视觉警报 受斯科特·M·卡尼(Scott M. Carney)的书的启发,该指标旨在满足最纯粹和最熟练的交易者的需求。但是,它采取了一种使交易更容易的方式:在向交易发出信号之前,它会等待Donchian朝正确方向突破,从而使交易信号非常可靠。 斐波那契投影与向量无关 它实现了电子邮件/声音/推送警报 它绘制了ABCD投影 重要提示: 为了符合 Scott M. Carney先生 的商标申诉,某些图案名称已重命名为不言自明的替代方式, Scott M.
Special offer : ALL TOOLS , just $35 each! New tools   will be   $30   for the   first week   or the   first 3 purchases !  Trading Tools Channel on MQL5 : Join my MQL5 channel to update the latest news from me 推出革命性的 RSI Kernel Optimized with Scanner,一款重新定义传统 RSI 分析的尖端工具,集成了强大的核密度估计(KDE)算法。这款先进的指标不仅提供实时市场趋势的见解,还包括一个仪表板,可同时扫描多个货币对和时间框架。让我们深入了解为什么这款工具是您交易工具箱中的重要补充。 See more MT5 version at:   RSI Kernel Optimized with Scanner for MT5 See more products at:   https://www.mql5.com/en/users/ndhsfy/se
System Trend Pro
Aleksandr Makarov
5 (2)
System Trend Pro - This is the best trend trading indicator!!! You can get this indicator for free -  Quantum Entry PRO The indicator no repaint!!!   The indicator has   MTF   mode, which adds confidence to trading on the trend (   no repaint   ). How to trade? Everything is very simple, we wait for the first signal (big arrow), then wait for the second signal (small arrow) and enter the market in the direction of the arrow. (See screens 1 and 2.) Exit on the opposite signal or take 20-30 pips
Legacy of Gann
Pavel Zamoshnikov
4.83 (12)
The indicator very accurately determines the levels of the possible end of the trend and profit fixing. The method of determining levels is based on the ideas of W.D.Gann, using an algorithm developed by his follower Kirill Borovsky. Extremely high reliability of reaching levels (according to K. Borovsky  - 80-90%) Indispensable for any trading strategy – every trader needs to determine the exit point from the market! Precisely determines targets on any timeframes and any instruments (forex, met
Automated Trendlines
Georgios Kalomoiropoulos
5 (16)
趋势线是外汇交易中最重要的技术分析工具。不幸的是,大多数交易者没有正确绘制它们。自动趋势线指标是专业交易者的专业工具,可帮助您可视化市场的趋势运动。 有两种类型的趋势线看涨趋势线和看跌趋势线。 在上升趋势中,外汇趋势线是通过价格变动的最低摆动点绘制的。 连接至少两个“最低点”将创建一条趋势线。 在下跌趋势中,趋势线是通过价格走势的最高摆动点绘制的。 连接至少两个“最高点”将创建一条趋势线。 趋势线何时突破? 当看跌蜡烛收于看涨​​趋势线下方并且蜡烛的高点在趋势线上方时,看涨趋势线会被打破。 当看涨蜡烛收于看跌趋势线上方并且蜡烛的低点低于趋势线时,看跌趋势线会被打破。 趋势线何时删除? 当一根完整的蜡烛在看涨趋势线下方形成时,看涨趋势线将被删除。 当完整的蜡烛在看跌趋势线上方形成时,看跌趋势线将被删除。 您可以从输入参数更改看涨和看跌趋势线的颜色和宽度。
Advanced Currency Strength28 Indicator
Bernhard Schweigert
4.9 (652)
目前26%的折扣 任何新手或专家交易者的最佳解决方案! 这个指标是一个独特的、高质量的、可负担得起的交易工具,因为我们纳入了一些专有的功能和一个新的公式。只需一个图表,你就可以读出28个外汇对的货币强度!想象一下,你的交易将如何得到改善,因为你的交易是在你的手中进行的。想象一下,你的交易将如何改善,因为你能够准确地确定新趋势或剥头皮机会的触发点? 用户手册:点击这里  https://www.mql5.com/en/blogs/post/697384 这是第一本,原版的! 不要买一个毫无价值的崇拜者的克隆品。 特别的 子窗口中的箭头显示强劲的货币势头GAP将指导你的交易! 当基础货币或报价货币处于超卖/超买区域(外盘斐波那契水平)时,在个人图表的主窗口中出现警告信号。 当货币力量从外围区间回落时,回撤/反转警报。 十字星模式的特别警报 可选择多个时间框架,以快速查看趋势! 货币强度线在所有的时间框架中都非常平稳,当使用较高的时间框架来识别总体趋势,然后使用较短的时间框架来确定精确的入口时,效果非常好。你可以根据自己的意愿选择任何时间框架。每个时间框架都由其自身进行了优化。
作者的更多信息
DailyHighLow
Komi Eyram F Kahoho
请不要忘记给指标评分,以帮助我提高其可见性。 DailyHighLow 指标是专为 MetaTrader 4 (MT4) 平台设计的强大工具,旨在帮助交易者跟踪每日的价格波动。该指标可以自动绘制趋势线,基于自定义时间段内的最高价和最低价,为需要准确市场信息的交易者提供清晰的视觉辅助。 主要特点: 趋势线个性化设置: 根据您的交易偏好,调整趋势线的颜色、样式和宽度,包括破位线和未破位线。 动态更新: 自动根据最新的市场数据调整趋势线,并使用明显的视觉标记来显示破位情况。 灵活参数设置: 选择显示趋势线的天数,设置破位后趋势线的结束时间,并为最高价和最低价自定义趋势线的外观。 清晰的视觉效果: 通过不同的颜色和线条样式轻松区分破位和未破位的趋势线,使您可以一目了然地识别市场的关键水平。 此指标非常适合希望通过清晰且可自定义的趋势线来增强技术分析的交易者,无论是分析短期趋势还是长期市场动向,DailyHighLow 指标都能为您的交易策略提供宝贵的信息支持。
FREE
TradingSessionVisualizer – 交易者的必备工具! 在深入了解此指标的功能之前,请 评分 此产品, 留下评论 以分享您的体验,并 订阅 我的页面,以便随时了解最新的发布和工具。您的支持非常宝贵,帮助我不断改进我的创作! 描述: TradingSessionVisualizer 是一款强大的 MetaTrader 4 指标,旨在为您的图表提供清晰且可自定义的主要交易时段可视化。该工具允许您轻松区分亚洲、伦敦和纽约交易时段,帮助您更好地理解这些关键时期的市场走势。 主要功能: 交易时段显示: 使用彩色矩形在图表上清晰地可视化亚洲、伦敦和纽约的交易时段。 可自定义参数: 调整每个时段的颜色、线条宽度以及矩形是否填充。 动态显示: 指标会根据您选择显示的天数自动调整(最多可显示 3 天)。 易于管理: 该代码有效管理图形对象,删除旧的对象并更新新的对象。 指标参数: 天数数量: 显示最多 3 天的时段。 颜色和样式: 自定义时段的颜色和矩形边框样式。 矩形填充: 选择矩形是否应填充或仅显示边框。 使用方法: 安装: 下载并将指标安装到 MetaTrader 4 的指标文件
FREE
FVG Analyzer
Komi Eyram F Kahoho
FVG Analyzer 是一款专为 MetaTrader 4 设计的自定义指标,用于识别和突出价格图表上的公允价值缺口(Fair Value Gaps, FVG)。该工具帮助交易者轻松识别出发生价格缺口的区域,为基于这些缺口的潜在交易机会提供支持。 主要特点: FVG 检测 : 看涨 FVG :识别出下一根蜡烛的最高价低于前一根蜡烛的最低价的看涨缺口。 看跌 FVG :识别出下一根蜡烛的最低价高于前一根蜡烛的最高价的看跌缺口。 高亮显示 : 在图表上绘制彩色矩形以表示 FVG。 提供了在 FVG 部分填充时改变矩形颜色的选项,基于预设的颜色设置。 在 FVG 内部包含填充线,可以根据颜色、厚度和样式进行调整。 设置参数 : 蜡烛数量 :定义用于检测 FVG 的蜡烛数量。 最小 FVG 宽度 :设置检测 FVG 所需的最小缺口宽度(以点为单位)。 颜色和样式 :设置看涨和看跌 FVG 的颜色,以及填充线的属性。 颜色变化 :启用或禁用在 FVG 部分填充时改变颜色的选项。 填充百分比 :定义 FVG 内部的可见填充百分比。 对象管理 : 在新蜡烛形成时自动删除过时的 FVG 对象,以保
OrderBlock Analyzer
Komi Eyram F Kahoho
OrderBlock Analyzer 是一个定制的MetaTrader 4 (MT4) 指标,用于在价格图表上检测并标记订单块(Order Blocks)。此工具帮助交易者识别关键的市场结构,显示可能的反转或延续区域。OrderBlock Analyzer 基于市场行为自动绘制订单块,并通过颜色区分看涨和看跌块。 主要功能: 检测和绘制看涨和看跌订单块。 实时更新图表上的订单块,以便快速识别潜在的交易机会。 自定义订单块的颜色、填充线和线条样式。 灵活设置填充线的显示和厚度。 此指标适用于各类交易者,尤其适合趋势交易和反转交易策略。 ............................................
Liquidity Zone Detector
Komi Eyram F Kahoho
Liquidity Zone Detector 是一款高级技术指标,旨在通过使用 ZigZag 指标来识别和标注市场中的关键流动性区域。该工具通过在 ZigZag 检测到的高点和低点绘制趋势线来定位可能存在显著流动性的价格水平。Liquidity Zone Detector 帮助交易者根据流动性的累积或释放发现潜在的反转或趋势延续区域。 主要特点: 自动识别流动性区域 :在 ZigZag 指标识别的高点和低点绘制趋势线。 高级定制 :可配置流动性线的颜色、厚度和样式。 动态颜色变化 :当流动性水平被突破时,可选择更改线条颜色。 可调 ZigZag 参数 :调整 ZigZag 的深度、偏差和回溯步长以获得更精确的检测。 Liquidity Zone Detector 是分析市场结构并识别可能发生显著价格变动的关键区域的交易者的必备工具。
在深入了解此指标的功能之前,请记得对该产品进行评分,留下评论以分享您的经验,并订阅我的页面以获取最新更新和新工具的通知。您的支持是无价的,帮助我不断改进我的创作! 描述: TradingSessionPipsVisualizer 是一款强大的 MetaTrader 4 指标,旨在视觉上呈现主要交易时段。此工具使您能够轻松区分各种交易时段,如亚洲、伦敦、纽约、悉尼和法兰克福,从而帮助您更好地理解这些关键时期的市场走势。 主要功能: 交易时段可视化:   清晰地在图表上可视化亚洲、伦敦、纽约、悉尼和法兰克福的交易时段,通过彩色矩形显示。 可自定义参数:   根据您的偏好调整每个时段矩形的颜色、线宽和填充选项。 动态显示:   指标会根据您选择的显示天数自动调整,天数不限。 轻松管理:   高效管理图形对象,通过删除旧对象并更新新对象来实现。 指标设置: 天数数量:   显示不限天数的时段。 颜色和样式:   自定义每个时段矩形的颜色和线条样式。 矩形填充:   选择填充矩形或仅显示边框。 使用方法: 安装:   下载并将指标安装到 MetaTrader 4 的指标目录中。 配置:   在指
筛选:
Kamil Kayahan
161
Kamil Kayahan 2025.01.22 19:06 
 

用户没有留下任何评级信息

[删除] 2024.11.02 17:47 
 

用户没有留下任何评级信息

[删除] 2024.11.02 00:49 
 

用户没有留下任何评级信息

回复评论
版本 2.5 2024.12.26
Easy selection of the markers....
版本 2.0 2024.10.03
V2.00

*définition de l'emplacement voulu possible
*bug lors du changement du timeframe corrigé
*changement de la flèche d'entrée en ligne horizontal pour facilite les déplacements...
版本 1.1 2024.09.10
1.01