• 概述
  • 评论
  • 评论

Mt5 Market Profile

Market Profile

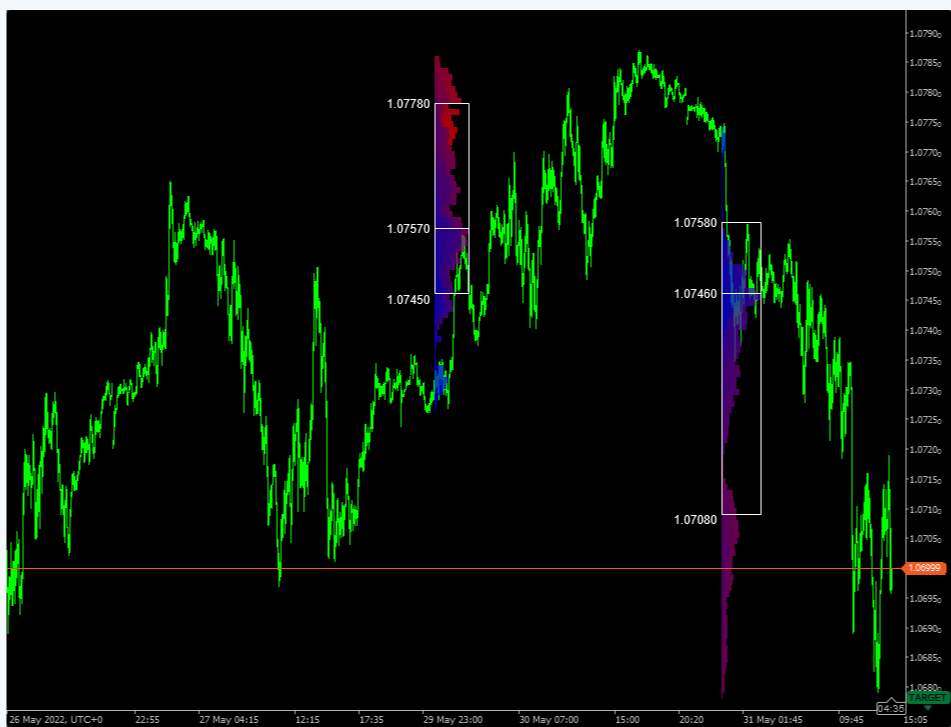
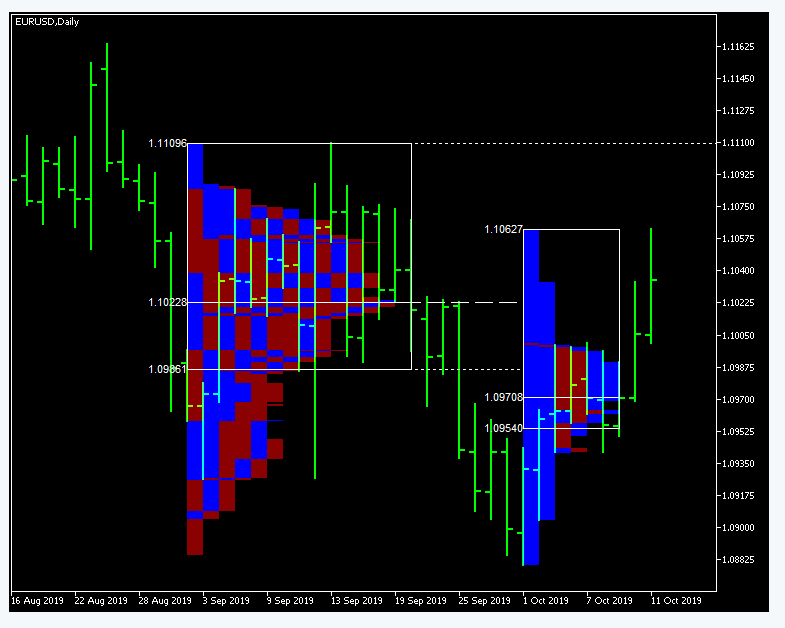
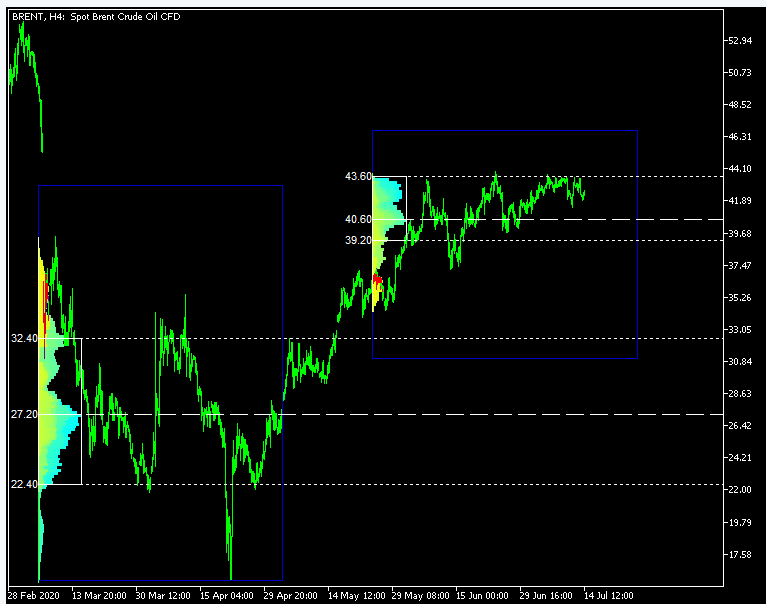
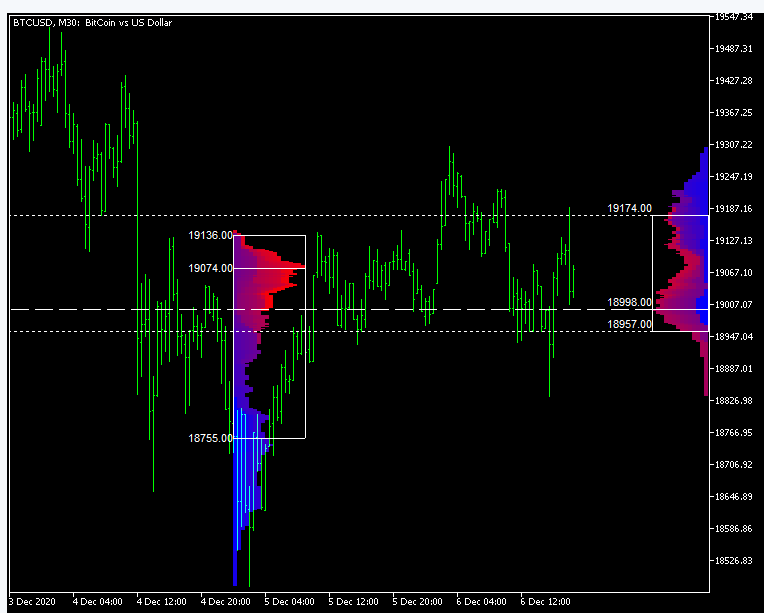
Introducing the Market Profile MetaTrader Indicator—your gateway to mastering market dynamics with precision and insight. This powerful tool delivers a classic Market Profile analysis, revealing price density over time and highlighting crucial levels, including the value area and control value for any trading session. 


Compatible with timeframes from M1 to D1, it adapts to daily, weekly, monthly, or even intraday sessions, offering you unmatched flexibility. Lower timeframes provide granular detail, while higher timeframes ensure clearer visibility. You can even draw custom market profiles using a free-draw rectangle on any timeframe, and choose from six vibrant color schemes to visualize the profile blocks. Whether you prefer a simple color histogram or a dynamic color representation based on market trends, this indicator has you covered.


With no reliance on standard indicators, this tool focuses solely on pure price action, available for MetaTrader 4, MetaTrader 5, and cTrader platforms. Plus, stay ahead of market moves with built-in alerts for key price levels like the Value Area high and low, Median, and Single Print zones. Embrace the power of detailed market analysis and elevate your trading strategy today!                                                                                                                                                                                                  

Input parameters

Main                                                                                                                                                                                                                                                                                                                                  **Session (default = Daily):** Choose the trading session for your Market Profile analysis, ranging from Daily, Weekly, Monthly, Intraday, to Rectangle. To use the Rectangle session, simply add a rectangle chart object named with "MPR" to your chart. Press 'r' on your keyboard to automatically create a correctly named rectangle.


**StartFromDate (default = __DATE__):** If `StartFromCurrentSession` is set to false, the indicator will begin drawing profiles from this specified date and extend backwards. For example, setting it to 2018-01-20 with `SessionsToCount` set to 2 will generate profiles for 2018-01-20 and 2018-01-19.


**StartFromCurrentSession (default = true):** When set to true, the indicator starts drawing profiles from the current session. If set to false, it uses the date specified in `StartFromDate` to begin drawing.


**SessionsToCount (default = 2):** Defines the number of trading sessions for which to display Market Profiles.


**SeamlessScrollingMode (default = false):** When enabled, this mode ignores the `StartFromDate` and `StartFromCurrentSession` settings, allowing the indicator to calculate and display sessions based on the current position of the chart. This feature facilitates infinite scrolling to explore historical sessions.


**EnableDevelopingPOC (default = false):** If activated, multiple horizontal lines will illustrate the evolution of the Point of Control throughout the session.


**EnableDevelopingVAHVAL (default = false):** When enabled, this feature draws multiple horizontal lines to show the development of the Value Area High and Low during the session.


**ValueAreaPercentage (default = 70):** Sets the percentage of the session's TPOs to be included in the Value Area.                                                                                                                                                             

Looks and colors

  • ColorScheme (default = Blue to Red) — color scheme for profile's blocks:
    • blue to red
    • red to green
    • green to blue
    • yellow to cyan
    • magenta to yellow
    • cyan to magenta
  • SingleColor (default = clrBlue) — if ColorScheme is set to Single Color, this color will be used to draw market profiles.
  • ColorBullBear (default = false) — if true, the color of the profile blocks depends not on the age of the origin bar but on its direction.
  • MedianColor (default = clrWhite) — the color of the control value (median).
  • ValueAreaSidesColor (default = clrWhite) — the color of the value area side borders.
  • ValueAreaHighLowColor (default = clrWhite) — the color of the value area top and bottom borders.
  • MedianStyle (default = STYLE_SOLID) — the Point of Control (median) line style.
  • MedianRayStyle (default = STYLE_DASH) — the Point of Control (median) ray line style.
  • ValueAreaSidesStyle (default = STYLE_SOLID) — the style of the value area side borders.
  • ValueAreaHighLowStyle (default = STYLE_SOLID) — the style of the value area top and bottom borders.
  • ValueAreaRayHighLowStyle (default = STYLE_DOT) — the style of the value area top and bottom rays.
  • MedianWidth (default = 1) — the Point of Control (median) line width.
  • MedianRayWidth (default = 1) — the Point of Control (median) ray line width.
  • ValueAreaSidesWidth (default = 1) — the width of the value area side borders.
  • ValueAreaHighLowWidth (default = 1) — the width of the value area top and bottom borders.
  • ValueAreaRayHighLowWidth (default = 1) — the width of the value area top and bottom rays.
  • ShowValueAreaRays (default = None) — can be set so that the value area's High and Low price levels are projected to the right side of the chart. Can be set to previous session, current, previous and current, all previous, or all.
  • ShowMedianRays (default = None) — can be set so that the median is projected to the right side of the chart. Can be set to previous session, current, previous and current, all previous, or all.
  • RaysUntilIntersection (default = Stop_No_Rays) — defines the way median and value area rays will be cut off when they meet the next trading session's price range:
    • Stop_No_Rays — no rays are stopped anywhere.
    • Stop_All_Rays — all rays are stopped at an intersection with the price of another session.
    • Stop_All_Rays_Except_Prev_Session — all rays except the previous session's rays are stopped at an intersection with the price of another session.
    • Stop_Only_Previous_Session — only rays of the previous session are stopped at an intersection with the price of another session.
  • HideRaysFromInvisibleSessions (default = false) — if true, rays from sessions starting behind the left edge of the screen won't be displayed until you scroll back to them.
  • TimeShiftMinutes (default = 0) — time shift for the sessions, in minutes. Positive value will move the session start to the left; negative — to the right.
  • ShowKeyValues (default = true) — if true, Value Area High, Value Area Low, and Point of Control are displayed on the left of the market profile.
  • KeyValuesColor (default = clrWhite) — the color for Value Area High, Value Area Low, and Point of Control printout.
  • KeyValuesSize (default = 8) — the font size for Value Area High, Value Area Low, and Point of Control printout.
  • ShowSinglePrint (default = No) — can be set to Leftside or Rightside and will mark the single print profile — a part of the profile, which is only one TPO wide.
  • SinglePrintRays (default = false) — if true, single print edges are marked with rays.
  • SinglePrintColor (default = clrGold) — the color for single print marking if ShowSinglePrint isn't set to No.
  • SinglePrintRayStyle (default = STYLE_SOLID) — the single print ray line style.
  • SinglePrintRayWidth (default = 1) — the single print ray line width.
  • ProminentMedianColor (default = clrYellow) — the color for the prominent median (PPOC) if ProminentMedianPercentage is set to 100 or less.
  • ProminentMedianStyle (default = STYLE_SOLID) — the style for the prominent median (PPOC) if ProminentMedianPercentage is set to 100 or less.
  • ProminentMedianWidth (default = 4) — the width for the prominent median (PPOC) if ProminentMedianPercentage is set to 100 or less.
  • RightToLeft (default = false) — if true, the current session's market profile has its histogram drawn from right to left. In case Session is set to Rectangle, market profiles of all sessions are drawn right-to-left.

Performance

  • PointMultiplier (default = 0) — the higher it is, the wider are the profile's price boxes and the fewer are the chart objects. You can use it to reduce the indicator's load on CPU. When the value is zero, an adaptive multiplier is used — the indicator attempts to calculate the optimal value automatically.
  • ThrottleRedraw (default = 0) — a delay in seconds that will be applied before each redraw of the profiles. You can use it to reduce the indicator's load on CPU.
  • DisableHistogram (default = false) — if true, no market profile histogram is drawn, but Value Area and Median are still marked. This makes indicator work extremely fast, but is less useful for thorough market analysis.

Alerts

  • AlertNative (default = false) — if true, the indicator will issue the platform's native pop-up alert when some alert conditions are met.
  • AlertEmail (default = false) — if true, MetaTrader's email alerts will be sent when some alert conditions are met. Email should be properly configured in MetaTrader via Tools->Options->Email
  • AlertPush (default = false) — if true, MetaTrader's push notification alerts will be sent to your mobile device when some alert conditions are met. Notifications should be properly configured in MetaTrader via Tools->Options->Notifications. This alert type is not available in the cTrader version of the indicator.
  • AlertArrows (default = false) — if true, MetaTrader will draw arrows on the chart when some alert conditions are met.
  • AlertCheckBar (default = Previous) — controls the bar to check the alert conditions on. Current — the indicator will check the current unfinished bar; expect a lot of alerts. Previous — the indicator will check the previous (closed) bar; alerts will be delayed but more concise.
  • AlertForValueArea (default = false) — if true, alerts will be issued whenever a Value Area ray (high or low) is crossed by the price.
  • AlertForMedian (default = false) — if true, alerts will be issued whenever a Median ray is crossed by the price.
  • AlertForSinglePrint (default = false) — if true, alerts will be issued whenever a Single Print ray is crossed by the price.
  • AlertOnPriceBreak (default = false) — if true, alerts will be issued when the price breaks any of the trigger levels but then returns back behind it.
  • AlertOnBarClose (default = false) — if true, alerts will be issued when the bar opens on one side the trigger level and closes on the other side of it.
  • AlertOnGapCross (default = false) — if true, alerts will be issued when the trigger level appears inside a price gap between the last two bars.
  • AlertArrowCodePB (default = 108) — arrow code for price break alert arrows.
  • AlertArrowCodeCC (default = 110) — arrow code for candle close alert arrows.
  • AlertArrowCodeGC (default = 117) — arrow code for gap crossover alert arrows.
  • AlertArrowColorPB (default = clrRed) — arrow color for price break alert arrows.
  • AlertArrowColorCC (default = clrBlue) — arrow color for candle close alert arrows.
  • AlertArrowColorGC (default = clrYellow) — arrow color for gap crossover alert arrows.
  • AlertArrowWidthPB (default = 1) — arrow width for price break alert arrows.
  • AlertArrowWidthCC (default = 1) — arrow width for candle close alert arrows.
  • AlertArrowWidthGC (default = 1) — arrow width for gap crossover alert arrows.

Intraday sessions

  • EnableIntradaySessionN (default = true) — if true and Session is set to Intraday, then the indicator will attempt to drawn the intraday market profile #N on the chart.
  • IntradaySessionNStartTime (default = "HH:MM") — start time in HH:MM format for the intraday session #N.
  • IntradaySessionNEndTime (default = "HH:MM") — end time in HH:MM format for the intraday session #N.
  • IntradaySessionNColorScheme (default = Blue_to_Red) — color scheme for the intraday session #N.

Miscellaneous

  • SaturdaySunday (default = Normal sessions) — how to treat Saturday and Sunday sessions:
    • Normal sessions — Saturday and Sunday will be treated as normal sessions with their own daily and intraday sessions.
    • Ignore Saturday and Sunday — Saturday and Sunday candlesticks will be ignored.
    • Append Saturday and Sunday — Saturday candlesticks will be appended to the Friday session; Sunday candlesticks will be appended to the Monday session.
  • DisableAlertsOnWrongTimeframes (default = false) — if true, no pop-up alerts will appear on using Market Profile with wrong timeframe/session combination.
  • ProminentMedianPercentage (default = 101) — percentage of TPOs out of all possible that should occur inside a median for it to be considered prominent (PPOC). For example, if you set it to 50%, a median will be marked as prominent if it contains at least 24 TPOs in a daily session on M30 timeframe. If it is set to 101, no prominent median is possible.


推荐产品
BoxChart MT5
Evgeny Shevtsov
5 (7)
The market is unfair if only because 10% of participants manage 90% of funds. An ordinary trader has slim changes to stand against these "vultures". This problem can be solved. You just need to be among these 10%, learn to predict their intentions and move with them. Volume is the only preemptive factor that faultlessly works on any timeframe and symbol. First, the volume appears and is accumulated, and only then the price moves. The price moves from one volume to another. Areas of volume accumu
Blahtech Market Profile MT5
Blahtech Limited
5 (9)
Was: $249  Now: $99   Market Profile defines a number of day types that can help the trader to determine market behaviour. A key feature is the Value Area, representing the range of price action where 70% of trading took place. Understanding the Value Area can give traders valuable insight into market direction and establish the higher odds trade. It is an excellent addition to any system you may be using. Inspired by Jim Dalton’s book “Mind Over Markets”, this indicator is designed to suit the
Blahtech Supply Demand MT5
Blahtech Limited
4.54 (13)
Was: $299  Now: $99   Supply Demand uses previous price action to identify potential imbalances between buyers and sellers. The key is to identify the better odds zones, not just the untouched ones. Blahtech Supply Demand indicator delivers functionality previously unavailable on any trading platform. This 4-in-1 indicator not only highlights the higher probability zones using a multi-criteria strength engine, but also combines it with multi-timeframe trend analysis, previously confirmed swings
VolumeProfile MT5
Robert Hess
4.14 (7)
Description: The Volume Profile displays detailed informations of historical trading activities at certain price levels (Market Profile). Locate the areas with the best prices in the market and get an advantage over other market participants. Features: Customizable Market Profile Shows the "fair" Value Area with 70% of all Volume Shows critical low volume zones Shows VPOC, VAL and VAH Points integrated resource management to reduce the load while working with multiple charts Works on all tim
Volume by Price MT5
Brian Collard
3.25 (4)
The Volume by Price Indicator for MetaTrader 5 features Volume Profile and Market Profile TPO (Time Price Opportunity). Volume and TPO histogram bar and line charts. Volume Footprint charts. TPO letter and block marker collapsed and split structure charts. Static, dynamic and flexible range segmentation and compositing methods with relative and absolute visualizations. Session hours filtering and segment concatenation with Market Watch and custom user specifications. Graphical layering, positio
本指标可以让您享受两个最流行的产品来分析在感兴趣的价位的请求量和市场成交量: 真实市场深度图表 真实报价足迹成交量图表 本产品结合两个指标的效力,并以单个文件提供。 反危机出售。今日低价。赶紧! 真实的 COMBO 市场深度功能和报价成交量图表,完全等同于原始指标。您将享受这两款产品结合为单一超级指标的力量!下面是您将得到的功能: 真实市场深度图表 股民专用工具现已在 MetaTrader 5 上可用。 真实市场深度图表 指标在图表上以直方条的形式显示可视化的市场深度,并在实时模式下刷新。 利用 真实市场深度图表 指标您可以正确评估市场请求并从图表上看到大的市场。这可以 100% 的精确剥头皮和设置持仓止损。 指标以两种相应颜色的水平直方条形式显示买和卖的请求 (买-卖)。价格图表上给定级别的显示条和它们的长度与请求的交易量相应。此外, 它指示买卖请求的最大交易量。 此指标显示买卖请求总数量作为堆积面积图。这可以评估当经过下一价位时将会执行的请求总量。买卖请求总数量也显示在图表上。 省缺, 指标显示在图表背景上, 且它不会干扰任何其它指标。当使用指标交易时, 建议使用实际交易量。
该指标建立当前报价,可以与历史报价进行比较,并在此基础上进行价格走势预测。指示器有一个文本字段,用于快速导航到所需日期。 选项: 符号 - 选择指标将显示的符号; SymbolPeriod - 选择指标从中获取数据的时段; IndicatorColor - 指示器颜色; HorisontalShift - 由指标绘制的报价移动指定的柱数; Inverse - true 反转引号,false - 原始视图; ChartVerticalShiftStep - 图表垂直移动(键盘上的向上/向下箭头); 接下来是文本字段的设置,您可以在其中输入日期,您可以通过按“回车”立即跳转到该日期。 接下来是文本字段的设置,您可以在其中输入日期,您可以通过按“回车”立即跳转到该日期。
Market Profile Heat indicator  — is a classic Market Profile implementation that can show the price density over time, outlining the most important price levels, value area, and control value of a given trading session. This indicator can be attached to timeframes between M1 and D1 and will show the Market Profile for daily, weekly, monthly, or even intraday sessions. Lower timeframes offer higher precision. Higher timeframes are recommended for better visibility. It is also possible to use a f
Moving VVC mt5
Andriy Sydoruk
The   Visual Volatility Clustering   indicator clusters the market based on volatility. The indicator does not redraw and gives accurate data, does not use closing prices. Uses the opening prices or the highs or lows of the previous completed bar. Therefore, all information will be clear and unambiguous. The essence of the indicator is to divide the price market into certain areas according to a similar type of volatility. This can be done in any way. In this example, the indicator is configure
Before installing the HeatMap indicator make sure you are using a broker that gives you access to the Depth of market (DOM) !! This indicator creates a heatmap on your chart allowing you to see the buy or sell limit orders easily and in real time. You have the possibility to change the setting and the colors of the HeatMap in order to adapt to all markets and all charts. Here is an example of a setting you can use with the NASDAQ100 on the AMPGlobal broker :  https://www.youtube.com/watch?v=x0
A "Volume Profile" is an advanced charting indicator that displays total volume traded at every price level over a user specified time period. The main components of the volume profile are POC ( Point Of Control - the price level, at which the maximum number of contracts were executed during a selected period), VAH ( Value Area High - the highest price in the Value Area) and VAL ( Value Area Low - the lowest price in the Value Area). When we settled on the original indicator, we spent a lot o
该指标的独特之处在于交易量核算算法:在所选时段内直接进行累积,而无需参考当天的开始。可以从计算中排除最后的柱线,那么当前数据对之前形成的显着水平(交易量)的影响较小。 为了更精确的计算,默认使用 M1 图表中的数据。规范了价格量的分配步骤。默认情况下,显示的右边框设置为用于分析的数据开头对应的栏,但如果需要,可以设置为您需要的栏。显示的音量带的长度(右边界)由系数调节,也可以向左或向右移动到 0(当前)条或参照当前条进行镜像。 参数: Accumulation period -  累积量计算周期 Number of excluded last bars - 从计算中排除的最后一根柱线的数量   Accumulation price step - 按价格参数的成交量总和步骤 Graph length multiplier -  显示数据的长度比例 Use data from timeframe - 用于分析的图表(时间范围) Graph show shift - 开始显示数据的移位,如果留为0,则数据将从分析数据周期开始时间对应的条开始显示; “-1”——显示在左侧; “-2” - 显示
Ultimate Candle Patterns
Wojciech Daniel Knoff
This is a multi-symbol and multi-timeframe table-based indicator designed for a candlestick patterns detection with 46 patterns for META TRADER 5. Each formation has own image for easier recognition. Here you find most popular formations such as "Engulfing", "Hammer", "Three Line Strike", "Piercing" or Doji - like candles. Check my full list of patterns on my screenshots below. Also you can not only switch all bearish or bullish patterns from input, but also select formation for a specified symb
Market profile was developed by Peter Steidlmayer in the second half of last century. This is a very effective tool if you understand the nature and usage. It's not like common tools like EMA, RSI, MACD or Bollinger Bands. It operates independently of price, not based on price but its core is volume. The volume is normal, as the instrument is sung everywhere. But the special thing here is that the Market Profile represents the volume at each price level. 1. Price Histogram The Price Histogram
AW Candle Patterns
AW Trading Software Limited
AW 蜡烛形态指标是高级趋势指标与强大的蜡烛形态扫描仪的组合。它是识别和突出显示 30 个最可靠的烛台形态的有用工具。此外,它是一个基于彩色条的电流趋势分析器,带有   可调整大小和定位的插件多时间框架趋势面板。根据趋势过滤调整模式显示的独特能力。 优点: 轻松识别蜡烛形态 不重绘结果 内置多时间趋势面板 禁用模式类型(1、2、3 根蜡烛) 显示形态时趋势过滤的调整 显示模式列表: 锤模式 固定/固定 看跌 Harami / 看涨 Harami 看跌 Harami Cross / 看涨 Harami Cross 枢轴点反转向上/枢轴点反转向下 双柱低位收盘价较高/双柱低位收盘价较低 收盘价反转向上 / 收盘价反转向下 中性条 /     两个中性条 双内/内/外 向上推力杆/向下推力杆 晚星/晨星 晚上十字星 / 早上十字星 吞没看跌线/吞没看涨线 镜子酒吧 流星 乌云盖顶 十字星 输入变量: Main settings Trend Filtering Mode - Adjustment of trend filtering when displaying patterns Pa
Market Profile MetaTrader System  — is a classic Market Profile implementation that can show the price density over time, outlining the most important price levels, value area, and control value of a given trading session. This indicator can be attached to timeframes between M1 and D1 and will show the Market Profile for daily, weekly, monthly, or even intraday sessions. Lower timeframes offer higher precision. Higher timeframes are recommended for better visibility. It is also possible to use a
VR Grid Mt5
Vladimir Pastushak
3.43 (7)
VR 网格指示器 设计 用于创建具有用户定义设置的图形网格。与 标准网格 不同,VR 网格用于构建 圆形关卡 。根据用户的选择,轮次级别之间的步长可以是任意的。此外,与其他指标和实用程序不同,即使时间段发生变化或终端重新启动,VR Grid 也能保持网格的位置 。 设置、设置文件、演示版本、说明、问题解决,可以从以下位置获取 [博客] 您可以在以下位置阅读或撰写评论 [关联] 版本为 [MetaTrader 4] 垂直级别 基于实际时间间隔并 忽略缺失 或不存在的周期。因此,级别之间的步长严格对应于用户选择的值。 使用 VR 网格指标时,交易者 可以更改任何级别的垂直线和水平线的样式 、颜色和粗细。这使您可以控制金融工具的 回合水平 。 整数位是 以两个或多个零结尾 的价格(例如:1.23500、5.65900、1923.200)。人们相信,这样的水平 经常充当 作为支撑或阻力的强点。 Horizontal line settings Horizontal line step Horizontal line color Horizontal line style Horizon
FREE
To get access to MT4 version please click here . This is the exact conversion from TradingView: " WaveTrend" by LazyBear. This is a light-load processing and non-repaint indicator. All input options are available. Buffers are available for processing in EAs. You can message in private chat for further changes you need. The filling area option is omitted to fit into MT5 graphics.
Volume Profile For MT5
Abdelkhabir Yassine Alaoui
Volume Profile is a very useful indicator . it allows you to spot the price levels where important price action took place. It is similar to support and resistance levels but with a different logic. ( Check Out  Fixed Range Volume Profile MT5  ) One of the first thing that traders mark up when analyzing a chart is support and resistance. Volume Profile can be used for doing that too. The indicator scans the defined number of previous bars and calculates the volume of activity at each price
Initial Balance MT5
Ricardo Almeida Branco
The Initial Balance (Initial Balance / Initial Balance) is a concept related to the study of volume (to learn more, study about Market Profile and Auction Market Theory. You can find some videos in English when searching for "Initial Balance Market Profile"). The IB defines a range in which prices were negotiated in the first hour of trading.The amplitude of the range is important and the break in the range defined by the Initial Balance may have occurred due to the movement of several players
VP hidden
Emr Aljnaby
4 (6)
The indicator works to convert normal volume into levels and determine financial liquidity control points. It is very similar in function to Fixed Volume Profile. But it is considered more accurate and easier to use than the one found on Trading View because it calculates the full trading volumes in each candle and in all the brokers present in MetaTrade, unlike what is found in Trading View, as it only measures the broker’s displayed prices. To follow us on social media platforms: tel
FREE
Profile Map MT5
Dmitriy Sapegin
5 (5)
Market Profile helps the trader to identify the behavior if major market players and define zones of their interest. The key feature is the clear graphical display of the range of price action, in which 70% of the trades were performed. Understanding of the location of volume accumulation areas can help traders increase the probability of success. The tool can be used as an independent system as well as in combination with other indicators and trading systems. this indicator is designed to suit
The   Visual Volatility Clustering   indicator clusters the market based on volatility. The indicator does not redraw and gives accurate data, does not use closing prices. Uses the opening prices or the highs or lows of the previous completed bar. Therefore, all information will be clear and unambiguous. The essence of the indicator is to divide the price market into certain areas according to a similar type of volatility. This can be done in any way. In this example, the indicator is configure
Z Score Plus MT5
Eduardo Da Costa Custodio Santos
CVD SmoothFlow Pro
Thalles Nascimento De Carvalho
CVD SmoothFlow Pro - 适用于任何资产的无限量分析! CVD SmoothFlow Pro 是寻求精确和无限量分析的交易者的终极解决方案。该专业版利用累计成交量 delta (CVD) 并结合高级噪声过滤,为交易任何金融资产提供所需的灵活性和精确度。 CVD SmoothFlow Pro 提供了什么? 清晰分析 :过滤市场噪声,突显任何金融资产中的重要成交量变动。 ️ 精确计算 :监测买卖差异,提供外汇、指数、加密货币等资产的成交量行为的详细视图。 直观界面 :提供易于理解和高效的分析,数据呈现清晰明了。 趋势识别 :更自信地识别市场趋势,帮助做出明智决策。 实际应用: 实时监测任何资产中买卖双方的平衡。 基于成交量识别趋势反转。 精确过滤,关注外汇、指数、加密货币等资产中的重要变动。 无限制的专业版! 专业版提供无限制的所有功能访问权限,让您能够对任何金融资产进行详细和无限量的分析。
Forex Volume MT5
KEENBASE SOFTWARE SOLUTIONS
KT Forex Volume shows the buying and selling volume of a currency pair in the form of a colored histogram. The volume is made of buying and selling transactions in an asset. In FX market: If the buying volume gets bigger than the selling volume, the price of a currency pair would go up. If the selling volume gets bigger than the buying volume, the price of a currency pair would go down. Features Avoid the bad trades by confirming them using the tick volume data. It helps you to stay on the si
VWAP Daily
Anton Polkovnikov
Weighted average price indicator or VWAP. The well-known standard VWAP with the beginning of the day is added with the function of selecting the periodization. It can be calculated both every day and on other periods. Also the indicator allows to exclude the volume from the calculation, which will allow using it on the cryptocurrencies and forex. There is an alert for a VWAP price crossing. There are 1 and 2 standard deviation. Settings: Volume: turning volume on and off in the calculation mecha
Mean Reversion Supply Demand Indicator Mean Reversion Supply Demand is the indicator to detect the important supply demand zone in your chart. The concept of supply demand trading relies on the quantity mismatching between buying and selling volumes in the financial market. Typically, supply demand zone serves to predict the turning point. The wave pattern, for any supply demand zone to work as an successful trade, looks like the price must touch the base zone, move away and then return to zone
VPO Profile MT5
Kyra Nickaline Watson-gordon
5 (2)
Definition : VPO is a Volume Price Opportunity. Instead of using bars or candles with an Open, High, Low, and Close price, each "bar" in a Market Profile is represented by horizontal bars against the price It is called Market Profile terminology. In other words volume-price-opportunity (VPO) profiles are histograms of how many volumes were traded at each price within the span of the profile. By using a VPO chart, you are able to analyze the amount of trading activity, based on volume, for eac
该产品的买家也购买
TPSpro RFI Levels MT5
Roman Podpora
4.73 (11)
指示       俄罗斯 -        英语   建议 与指示器一起使用     -       TPSpro 趋势专业版 -   MT4版本       交易中的一个关键要素是做出买卖交易工具决定的区域或水平。尽管主要参与者试图隐藏他们在市场中的存在,但他们不可避免地会留下痕迹。我们的任务是学习如何识别这些痕迹并正确解释它们。 主要功能: 向卖家和买家显示活跃区域! 该指标显示所有正确的初始买入和卖出脉冲水平/区域。激活这些水平/区域后,开始寻找切入点,水平会改变颜色并填充特定阴影。此外,还会显示箭头,以便更直观地了解情况。 显示更高时间范围内的级别/区域(MTF 模式) 添加了使用更高时间间隔显示级别/区域的功能。此外,该指标还具有自动趋势检测功能(   TPSproTREND PRO   )。 用于交易的单独专业的逐步算法。 该算法专为日内交易而设计,既可顺势交易,也可逆势交易。每个活动模板均提供详细说明。 适用于多种时间范围 。 TPSpro RFI 水平指标可用于图表上的任何时间范围,从一分钟(M1)开始一直到每月(MN)。 图形和声音警报。 该指标提供图形和声音指示
Atomic Analyst MT5
Issam Kassas
4.42 (19)
首先值得强调的是,该交易指标是非重绘、非延迟的指标,这使其成为手动和机器人交易的理想选择。 用户手册:设置、输入和策略。 Atomic Analyst是一种PA价格行动指标,利用价格的力量和动量来寻找市场上更好的机会。配备了高级过滤器,可帮助去除噪音和假信号,并提高交易潜力。使用多层复杂的指标,Atomic Analyst扫描图表,并将复杂的数学计算转化为任何初学者都能理解并用来做出一致交易决策的简单信号和颜色。 “Atomic Analyst”是专为新手和经验丰富的交易者量身定制的综合交易解决方案。它将高级指标和一流功能融合为一体的交易策略,使其成为所有类型交易者的多功能选择。 日内交易和剥头皮策略:专为快速准确的日内交易和短期交易而设计。 日内和摆动交易策略:可用作追求价格大幅波动的日内和摆动交易者的可靠工具。 多货币和市场:凭借其可靠的精度,在不同的工具和市场上运作。 多个时间框架:可在多个时间框架上使用,性能良好。 稳定性:所有指标均不重绘、不重绘和不滞后,确保可靠的信号。 信号清晰度:提供箭头信号,用于清晰的入场和出场点。 实时警报:通过交易入场、SL和TP警报通知交
首先,值得强调的是,这个交易系统是一个非重绘、非重画和非滞后的指标,这使得它非常适合手动和机器人交易。 在线课程,手册和下载预设。 “智能趋势交易系统 MT5”是专为新手和经验丰富的交易者量身定制的综合交易解决方案。它结合了超过 10 个优质指标,具有 7 多个强大的交易策略,使其成为适用于各种市场条件的多功能选择。 趋势跟随策略:提供精确的入场和止损管理,以有效地跟随趋势。 反转策略:识别潜在的趋势反转,使交易者能够利用区域市场的机会。 剃头策略:专为快速准确的日内交易和短期交易而设计。 稳定性:所有指标都不会重绘、不会重画和不会滞后,确保可靠的信号。 定制:支持自定义策略,以满足个人交易偏好。超过 7 种策略和组合可帮助您找到最佳策略。 信号清晰度:提供箭头信号,以指示清晰的入场和退出点。 实时警报:通过交易进出警报使交易者保持了解。 深入分析:提供更高时间框架的趋势分析和实时交易监控。 自适应颜色编码:利用蜡烛颜色编码来显示成交量、趋势和反转蜡烛信号。通过蜡烛颜色分析市场方向。 “智能趋势交易系统 MT5”赋予交易者必要的工具,以便在各种市场条件下做出明智和战略性的交易决策。无论
Quantum Trend Sniper
Bogdan Ion Puscasu
4.8 (49)
介绍   量子趋势狙击指标 ,突破性的 MQL5 指标,正在改变您识别和交易趋势反转的方式!由拥有超过13年交易经验的资深交易员团队开发,     量子趋势狙击指标   旨在通过其创新的方式以极高的准确度识别趋势反转,将您的交易之旅推向新的高度。 ***购买量子趋势狙击指标,即可免费获得量子突破指标!*** 当量子突破指标识别出趋势反转时,它会向您发出警报和信号箭头,并建议您三个止盈水平。 它既适合新手交易者,也适合专业交易者。 量子 EA 通道:       点击这里 MT4版本:       点击这里 建议: 时间范围: 所有时间范围。为了获得最佳结果,我们建议在 M15、M30 和 H1 时间范围内使用它。 货币对:欧元兑美元、英镑兑美元、澳元兑美元、欧元兑英镑、, EURAUD,  XAUUSD 账户类型:ECN、Raw 或 Razor,点差极低 经纪时间:任意 经纪商:IC Markets、Pepperstone with Raw 和 Razor 的点差最低 建议止损:50 点 建议止盈水平:20 点、50 点和
该仪表盘显示所选符号的最新可用谐波形态,因此您可以节省时间并提高效率 /  MT4 版本 。 免费指标:  Basic Harmonic Pattern 指标列 Symbol:   显示所选符号 Trend:     看涨或看跌 Pattern:    形态类型(Gartley、蝴蝶、蝙蝠、螃蟹、鲨鱼、Cypher 或 ABCD) Entry:     入口价格 SL: 止损价 TP1: 第一止盈价 TP2: 第二次获利价格 TP3: 第三次获利价格 Current price:    当前价格 Age (in bars):   最后绘制的模式的年龄 主要输入 Symbols :   从 "28 种主要货币对 "或 "选定符号 "中选择。 Selected Symbols :   希望监控的符号,用逗号分隔("EURUSD,GBPUSD,XAUUSD")。如果您的经纪商为货币对设置了后缀或前缀,您必须在以下两个参数中添加(货币对前缀或货币对后缀)。 Max Iteration:   调整模式的最大迭代次数(如果该值越小,则模式越少,性能越快;如果该值越大,则模式越多,性能
FX Power MT5 NG
Daniel Stein
5 (5)
通过 mql5 和 Telegram 上 的晨间简报获取每日市场更新,包括详细信息和屏幕截图 ! FX Power MT5 NG 是我们长期以来非常受欢迎的货币强度计算器 FX Power 的下一代产品。 这款下一代强度计算器能提供什么?您所喜爱的原版 FX Power 的所有功能 附加功能 黄金/XAU 强度分析 更精确的计算结果 可单独配置的分析周期 可自定义计算限制,以获得更好的性能 为希望查看更多信息的用户提供特殊的多实例设置 无尽的图形设置,可在每个图表中设置您最喜欢的颜色 无数的通知选项,让您再也不会错过任何重要信息 采用 Windows 11 和 macOS 风格的全新圆角设计 神奇的移动指标面板 FX Power 主要功能 所有主要货币的完整强势历史 所有时间框架内的货币强弱历史 所有经纪商和图表的计算结果完全相同 100% 可靠的实时计算 -> 无重绘 可通过下拉列表选择分析时段 通过自定义模式单独配置分析时段 可在一个图表中使用多个实例 可移动 FX Power 显示屏(通过拖放) 适用于高分辨率 QHD、UHD 和 4K 显示器 自动终端配置 针对平板电脑
首先,值得强调的是,这个交易工具是非重绘、非重画和非滞后的指标,非常适合专业交易。 在线课程,用户手册和演示。 智能价格行动概念指标是一个非常强大的工具,既适用于新手,也适用于经验丰富的交易者。它将超过20个有用的指标合并到一个指标中,结合了高级交易思想,如内圈交易员分析和智能资金概念交易策略。该指标侧重于智能资金概念,提供有关大型机构交易方式的见解,帮助预测它们的动向。 它在流动性分析方面尤其擅长,有助于理解机构的交易方式。它擅长预测市场趋势,并仔细分析价格波动。通过将您的交易与机构策略对齐,您可以更准确地预测市场走向。该指标多才多艺,擅长分析市场结构,识别重要的订单区块,并识别各种模式。 它擅长识别BOS和CHoCH等模式,理解动量的转变,并突出显示供需强劲的关键区域。它还擅长发现强大的不平衡,并分析价格创造更高高点或更低低点的模式。如果您使用斐波那契回撤工具,该指标可以满足您的需求。它还可以识别相等的高点和低点,分析不同的时间框架,并通过仪表板显示数据。 对于使用更高级策略的交易者,该指标提供了工具,如公平价值差指标和优惠和折扣区域的识别。它特别关注高时间框架订单
AT Forex Indicator MT5
Marzena Maria Szmit
5 (4)
The AT Forex Indicator MT5 is a sophisticated trading tool designed to provide traders with a comprehensive analysis of multiple currency pairs. This powerful indicator simplifies the complex nature of the forex market, making it accessible for both novice and experienced traders. AT Forex Indicator uses advanced algorithms to detect trends, patterns and is an essential tool for traders aiming to enhance their forex trading performance. With its robust features, ease of use, and reliable signal
TrendMaestro5
Stefano Frisetti
note: this indicator is for METATRADER4, if you want the version for METATRADER5 this is the link:  https://www.mql5.com/it/market/product/108106 TRENDMAESTRO ver 2.4 TRENDMAESTRO recognizes a new TREND in the bud, he never makes mistakes. The certainty of identifying a new TREND is priceless. DESCRIPTION TRENDMAESTRO identifies a new TREND in the bud, this indicator examines the volatility, volumes and momentum to identify the moment in which there is an explosion of one or more of these data a
TPA True Price Action indicator reveals the true price action of the market makers through 100% non-repainting signals strictly at the close of a candle! TPA shows entries and re-entries, every time the bulls are definitely stronger than the bears and vice versa. Not to confuse with red/green candles. The shift of power gets confirmed at the earliest stage and is ONE exit strategy of several. There are available now two free parts of the TPA User Guide for our customers. The first "The Basics"
FxaccurateLS
Shiv Raj Kumawat
WHY IS OUR FXACCCURATE LS MT5 THE PROFITABLE ? PROTECT YOUR CAPITAL WITH RISK MANAGEMENT Gives entry, stop and target levels from time to time. It finds Trading opportunities by analyzing what the price is doing during established trends. POWERFUL INDICATOR FOR A RELIABLE STRATEGIES We have made these indicators with a lot of years of hard work. It is made at a very advanced level. Established trends provide dozens of trading opportunities, but most trend indicators completely ignore them!
Advanced Supply Demand MT5
Bernhard Schweigert
4.5 (14)
任何新手或专业交易者的最佳解决方案! 该指标是一款独特、高质量、且价格合理的交易工具,因为我们已经整合了许多专有功能和新公式。 依据此更新,您将能够显示双重时间帧区域。 您不仅可以显示一个较高的时间帧,还可以同时显示图表时间帧,加上更高的时间帧:显示嵌套时区。 供需双方所有交易者都会喜欢它。 :) 重要信息披露 高级供需的最大潜力,请访问 https://www.mql5.com/zh/blogs/post/720245   想象您的交易如何得以改善,是因为您能够精准定位入场或目标位吗? 构建于新的底层算法,它可以更轻松地识别出买卖双方之间的潜在失衡。 这是因为它以图形方式展示供需最强劲区域,及其过去的表现(显示旧区域)。 这些功能旨在帮助您更轻松地发现最佳入场区域和价位。 现在您可以针对您的交易品种和时间帧来优化和编辑区域强度! 高级供需指标适用于所有产品和时间帧。 它是一个新的公式,非常新的功能是两个区域强度函数可由用户输入进行调整! 这在交易中是一大优势。 当您学习如何使用专有功能,例如带有价格游离最小 X 因子的区域强度时,您能够判断该区域强劲与否。 供需区域用作警报触发器
Entry Points Pro for MT5
Yury Orlov
4.46 (124)
这款指标用于 MT5,可提供准确的入场交易信号,且无重绘。 它可应用在任何金融资产:外汇、加密货币、贵金属、股票、指数。 它将提供极其精准的评估,并告诉您何时开仓和平仓的最佳时机。 观看 视频 (6:22),其中包含一个仅处理单一信号的示例,该信号即可值回指标购价! 大多数交易者在 Entry Points Pro 指标的帮助下,在第一个交易周内即改善了他们的交易结果。 订阅我们的 Telegram 群 ! Entry Points Pro 指标的益处。 入场信号无重绘 如果信号出现,并得到确认,则它不会再消失;不像是重绘指标,它会导致重大的财产损失,因为它们可以在显示信号后再将其删除。 无差错开仓 指标算法可令您找到入场交易(买入或卖出资产)的理想时机,从而提高每位交易者的成功率。 Entry Points Pro 可操作任何资产 它允许您在 MT5 平台上交易任何经纪商的加密货币、股票、贵金属、指数、大宗商品和货币。 提供任何方向的信号 Entry Points Pro 指标提供针对任意价格走势的入场交易信号 - 上涨、下跌或横盘(横向)。
Matrix Arrow Indicator MT5
Juvenille Emperor Limited
5 (12)
矩阵箭头指标 MT5   是一种独特的 10 合 1 趋势,遵循   100% 非重绘多时间框架指标 ,可用于所有符号/工具: 外汇 、 商品 、 加密货币 、 指数 、 股票 。 Matrix Arrow Indicator MT5 将在其早期阶段确定当前趋势,从多达 10 个标准指标中收集信息和数据,它们是: 平均定向运动指数 (ADX) 商品渠道指数 (CCI) 经典 Heiken Ashi 蜡烛 移动平均线 移动平均收敛散度 (MACD) 相对活力指数 (RVI) 相对强弱指数 (RSI) 抛物线SAR 随机振荡器 威廉姆斯的百分比范围 当所有指标给出有效的买入或卖出信号时,相应的箭头将打印在图表上,在下一根蜡烛/柱线开盘时,指示强劲的上升趋势/下降趋势。用户可以选择使用哪些指标,并可以单独调整每个指标的参数。 Matrix Arrow Indicator MT5 仅从选定的指标中收集信息,并仅根据其数据打印箭头。   Matrix Arrow Indicator MT5   还可以为所有新信号发送终端、推送通知或电子邮件警报。无论您是黄牛、日内交易者还是波段交易者, Mat
PZ Swing Trading MT5
PZ TRADING SLU
5 (4)
Swing Trading 是第一个旨在检测趋势方向的波动和可能的反转波动的指标。它使用在交易文献中广泛描述的基准摆动交易方法。该指标研究多个价格和时间向量,以追踪总体趋势方向,并检测市场超卖或超买并准备好进行修正的情况。 [ 安装指南 | 更新指南 | 故障排除 | 常见问题 | 所有产品 ] 市场波动的利润不会被窃取 指示器始终显示趋势方向 彩色价格带代表机会基准 彩色虚线表示可能的反转波动 该指标分析其自身的质量和性能 它实现了一个多时间仪表板 可定制的趋势和波动周期 它实现了电子邮件/声音/推送警报 指示器为非重涂或重涂 什么是摇摆交易 摇摆交易是一种尝试在一天到一周内从证券中获得收益的交易方式,尽管某些交易最终可以保持更长的寿命。摇摆交易者使用技术分析来买入弱点和卖出力量,并有耐心等待这些机会的发生,因为在发生一波抛售浪潮之后购买证券而不是陷入抛售更有意义。 机会基准 关于历史数据的大量研究证明,适合于波动交易的市场倾向于在基线价格带上下交易,基线价格带由图表显示,使用平均真实区间计算得出。波动交易者使用基线,该策略是购买常态和卖出躁狂,或做空常态并掩盖沮丧。
FX Volume MT5
Daniel Stein
4.93 (14)
通过 mql5 和 Telegram 上 的 " 晨间简报 "获取每日市场更新,包括详细信息和屏幕截图 ! 外汇交易量(FX Volume)是第一个也是唯一一个从经纪商角度真正洞察市场情绪的交易量指标。 直接在您的图表上看到这些信息是真正改变游戏规则和突破性的交易解决方案。 受益于独特的市场数据洞察,如 比率(Ratios )显示货币多头和空头头寸的比率(百分比 比率变化 显示所选时间段内的多头比率及其百分比变化 总交易量 显示货币的总交易量(多头和空头),以手为单位 多头 交易量显示货币所有多头头寸的交易量 空头 交易量显示所有货币空头头寸的交易量 净多头 显示净多头交易量,即所有多头头寸减去所有空头头寸(以手为单位)。 净多头百分比 显示货币净多头交易量的变化 请阅读我们的基本教程 -> "如何使用外汇交易量进行交易 " 获取更多信息,如常见问题、交易技巧和教程视频,请访问我们的 外汇交易量公共信息频道 请 安装并运行 SI Connect 以建立与我们数据中心的持续连接 背景信息 我们都知道,外汇是一个分散的市场。这就是为什么我们必须打破常规思维,开发一个独
可以说,这是您可以为MetaTrader平台找到的最完整的谐波价格形成自动识别指标。它检测19种不同的模式,像您一样认真对待斐波那契投影,显示潜在的反转区域(PRZ),并找到合适的止损和获利水平。 [ 安装指南 | 更新指南 | 故障排除 | 常见问题 | 所有产品 ] 它检测19种不同的谐波价格形态 它绘制了主要,衍生和互补的斐波那契投影(PRZ) 它评估过去的价格走势并显示每个过去的形态 该指标分析其自身的质量和性能 它显示合适的止损和获利水平 它使用突破来表明合适的交易 它在图表上绘制所有样式比率 它实现了电子邮件/声音/视觉警报 受斯科特·M·卡尼(Scott M. Carney)的书的启发,该指标旨在满足最纯粹和最熟练的交易者的需求。但是,它采取了一种使交易更容易的方式:在向交易发出信号之前,它会等待Donchian朝正确方向突破,从而使交易信号非常可靠。 斐波那契投影与向量无关 它实现了电子邮件/声音/推送警报 它绘制了ABCD投影 重要提示: 为了符合 Scott M. Carney先生 的商标申诉,某些图案名称已重命名为不言自明的替代方式, Scot
XQ Indicator MetaTrader 5
Marzena Maria Szmit
3 (2)
Step into the realm of Forex trading with confidence and precision using XQ, a cutting-edge Forex indicator designed to elevate your trading game to unprecedented heights. Whether you're a seasoned trader or just stepping into the world of currency exchange, XQ Forex Indicator empowers you with the insights and signals needed to make informed trading decisions. The signal conditions are a combination of three indicators, and XQ Forex Indicator only display  medium and long-term trends . The ind
Noize Absorption Index
Ekaterina Saltykova
Noize Absorption Index - is the manual trading system that measures the difference of pressure between bears forces and bulls forces. Green line - is a noize free index that showing curent situation. Zero value of index shows totally choppy/flat market.Values above zero level shows how powerfull bullish wave is and values below zero measures bearish forces.Up arrow appears on bearish market when it's ready to reverse, dn arrow appears on weak bullish market, as a result of reverse expectation.
Golden Spikes Premium
Kwaku Bondzie Ghartey
5 (1)
Golden Spikes Detector Acknowledgement and Dedications:  The name of this indicator was Inspired by an Original; Mr Grant Koopman; a Knowledgeable and experienced Synthetics trader. I dedicate this indicator to Mr Grant.  Overview: The Golden Spikes Premium is a groundbreaking trading indicator meticulously crafted for the Boom and Crash indices on the Deriv market. Tailored to meet the needs of discerning traders, this powerful tool operates exclusively on the one-minute timeframe, providin
Gold Trend 5
Sergei Linskii
5 (1)
黄金趋势 - 这是一个很好的股票技术指标。该指标算法分析资产的价格走势,并反映波动性和潜在进入区。 最佳指标信号: - 卖出 = 红色柱状图 + 红色短指针 + 同方向黄色信号箭头。 - 买入 = 蓝色柱状图 + 蓝色多头指针 + 同方向水蓝色信号箭头。 该指标的优点 1. 该指标生成的信号准确度高。 2. 只有当趋势发生变化时,才能重新绘制已确认的箭头信号。 3. 您可以在任何经纪商的 MetaTrader 5 交易平台上进行交易。 4. 您可以交易任何资产(货币、金属、加密货币、股票、指数等)。 5. 最好在 H1 时间框架(中期交易)上进行交易。 6. 在指标设置中可更改个别参数(TF、颜色等),以便每位交易者都能轻松定制适合自己的指标。 7. 该指标既可作为交易系统的主要补充,也可作为独立的交易系统使用。   注意:交易的入市准确性和盈利能力仅取决于交易者的技能。任何指标都只是交易者的助手,而非行动指南。 MetaTrader 4 黄金趋势指标版本  祝大家交易好运,稳定盈利!
该仪表盘可根据您对所选符号的交易策略,以剥头皮和长期模式在图表上发现并显示供需区。此外,仪表盘的扫描模式可帮助您一目了然地检查所有需要的符号,不错过任何合适的仓位/ MT4 版本 免费指标: Basic Supply Demand 功能 允许您查看多个货币对的交易机会,为您提供所有货币对的清晰简明视图,并根据其与供需区的接近程度进行排序 可定制设置,从颜色到检测参数,满足您的特定需求 主要输入 Indicator mode : 选择指标模式或具有新功能的面板模式 Symbols : 从 "28 种主要货币对 "或 "选定符号 "中进行选择 Selected Symbols : 您希望监控的符号,用逗号分隔("EURUSD,GBPUSD,XAUUSD")。如果您的经纪商对货币对有后缀或前缀,您必须在以下两个参数中添加(货币对前缀或货币对后缀) Trading Style : 选择剥头皮或长期模式 Allowed Deviation : 该参数允许修改需求或供应区域的精确度(数值越小,精确度越高) Zone   thickness : 通过该参数可以修改需求和供应
Price Action Finder Multi MT5
Siarhei Vashchylka
5 (5)
The Price Action Finder Multi indicator is an indicator of entry points that searches for and displays Price Action system patterns on dozens of trading instruments and on all standard time frames: (m1, m5, m15, m30, H1, H4, D1, Wk, Mn). The indicator places the found patterns in a table at the bottom of the screen. By clicking on the pattern names in the table, you can move to the chart where this pattern is located. Manual (Be sure to read before purchasing) | Version for MT4 Advantages 1. Pa
Automated Trendlines MT5
Georgios Kalomoiropoulos
趋势线是外汇交易中最重要的技术分析工具。不幸的是,大多数交易者没有正确绘制它们。自动趋势线指标是专业交易者的专业工具,可帮助您可视化市场的趋势运动。 有两种类型的趋势线看涨趋势线和看跌趋势线。 在上升趋势中,外汇趋势线是通过价格变动的最低摆动点绘制的。 连接至少两个“最低点”将创建一条趋势线。 在下跌趋势中,趋势线是通过价格走势的最高摆动点绘制的。 连接至少两个“最高点”将创建一条趋势线。 趋势线何时突破? 当看跌蜡烛收于看涨​​趋势线下方并且蜡烛的高点在趋势线上方时,看涨趋势线会被打破。 当看涨蜡烛收于看跌趋势线上方并且蜡烛的低点低于趋势线时,看跌趋势线会被打破。 趋势线何时删除? 当一根完整的蜡烛在看涨趋势线下方形成时,看涨趋势线将被删除。 当完整的蜡烛在看跌趋势线上方形成时,看跌趋势线将被删除。 您可以从输入参数更改看涨和看跌趋势线的颜色和宽度。
MetaForecast M5
Vahidreza Heidar Gholami
5 (2)
MetaForecast能够根据价格数据中的谐波来预测和可视化任何市场的未来走势。虽然市场不总是可预测的,但如果价格中存在模式,MetaForecast可以尽可能准确地预测未来。与其他类似产品相比,MetaForecast通过分析市场趋势可以生成更精确的结果。 输入参数 Past size (过去的尺寸) 指定MetaForecast用于创建生成未来预测模型的柱数量。该模型以一条黄色线绘制在所选柱上。 Future size (未来的尺寸) 指定应预测的未来柱数量。预测的未来以粉色线表示,并在其上绘制了蓝色回归线。 Degree (程度) 此输入确定了MetaForecast将在市场上进行的分析级别。 Degree 描述  0 对于程度0,建议使用较大的值来设置“过去的尺寸”输入,以覆盖价格中的所有高峰、低谷和细节。  1 (建议的) 对于程度1,MetaForecast可以理解趋势,并通过较小的“过去的尺寸”生成更好的结果。  2 对于程度2,除了趋势,MetaForecast还可以识别反转点。对于大于1的程度,必须使用较高的“细节”和“噪音减少”输入值。  大于2 不建议使用大
Market Overview MT5
Mehran Sepah Mansoor
使用我们的市场强度和情绪指标优化您的交易决策,不再逆势交易! 我们的指标专为重视准确及时信息的严肃交易者精心设计,以非常简单的方式提供 28 种主要货币对的鸟瞰图。该工具可根据货币对的受欢迎程度、看涨或看跌趋势的强度以及买方和卖方的百分比 (MT4 版本) 对货币对进行排名。 功能特点 实时趋势强度: 准确评估每种货币对的趋势强度,为识别交易机会提供可靠指导。 买卖双方分析: 通过我们对每种货币对的买卖双方实力排名,即时洞察市场动态,让您预测重要走势。 交易者兴趣: 获取每种货币对的交易者兴趣和活动数据,帮助您更好地了解新兴趋势和潜在转折点。 直观且可定制的仪表盘: 我们的仪表板易于使用,您可以根据自己的喜好自定义显示,让您对相关信息一目了然。 实时更新: 实时更新让您随时了解市场变化,确保您不会错过任何有利可图的机会。 指标栏 Symbol:  点击此栏,符号将按字母顺序排序。 Popularity:  点击此栏,将按照交易者对该交易货币对的兴趣顺序进行排序。 Strength:  点击此栏,货币对将按照趋势排序(正数表示上升趋势,负数表示下降趋势)。 Bu
Boom and Crash Trend Detector is a  Non-Repaint   MT5 trading system usually being sold for 50 0$ . Most people use this for Deriv but can be used to forex too. The boom and crash spike indicator is a spike detecting software, with Multiple features, these features include. Spike Alert ( from 10 to 100-second warning before spike) Continues spike Alert (for double or continuous spikes at a time) supports all Boom/crash Indices M6 time frame works best here . Bigger time frame trend pointer f
Order Block Hunter MT5
Noha Mohamed Fathy Younes Badr
5 (1)
Order block hunter indicator is the best indicator for  hunt the order blocks that area where there has been a large concentration of limit orders waiting to be executed Order blocks are identified on a chart by observing previous price action and looking for areas where the price experienced significant movement or sudden changes in direction .This indicator does that for you by using very complicated codes and helps you to take the best areas To buy and sell because it make marks at the best a
我们创新的基本烛台形态仪表盘专为自动识别图表上的盈利烛台形态而设计。该仪表盘使用先进的算法实时扫描价格图表,并检测从经典到复杂的各种烛台形态。此外,它还有一个易于使用的界面,允许您在不同的时间框架上对检测到的形态进行可视化,从而轻松做出明智的决策/ MT4 版本 免费指标:   Basic Candlestick Patterns 包括谐波形态 看涨形态 Hammer  Inverse hammer Bullish engulfing Morning star 3 White soldiers 看跌形态 Hanging man Shooting star Bearish engulfing Evening star 3 Black crows 指标列 Symbol:   将显示所选符号 Pattern:   形态类型(锤子型、反向锤子型、看涨吞没型......) Bar:   自检测到该形态以来所经过的柱状图数量 Age (in minutes):   自检测到该形态以来的年龄 主要输入 Symbols :   从 "28 种主要货币对 "或 "选定符号
作者的更多信息
Mt5TradeCopier
Mcblastus Gicharu Ndiba
Forex Trade copier MT5.  It copies forex trades, positions, orders from any accounts to any other account,  MT5 even multiple accounts. The unique copying algorithm exactly copies all trades from the master account to your client account. It is also noted for its high operation speed and Tough error handling. It also can copy from demo account to live account too. It is one of the best free trade copiers that can do ,  MT5 or to multiple accounts  MT5 to multiple accounts  Features of Trade Copi
Price update indicator
Mcblastus Gicharu Ndiba
Price update  indicator  — can issue any type of alert when the price reaches certain levels set by a trader. There are three types of price levels: the first one is used when the price rises above certain level (displayed with the green line on the chart), the second one is used when the price falls below certain level (displayed with the red line on the chart), and the third one is used when the price reaches the certain level exactly (displayed with the yellow line). Three alert types include
Mt5TradeAssistant
Mcblastus Gicharu Ndiba
Trade Assistant Introducing the Trade Assistant MetaTrader Indicator—a revolutionary tool that brings clarity and precision to your trading strategy by seamlessly integrating three powerful indicators: the Stochastic Oscillator, RSI (Relative Strength Index), and CCI (Commodity Channel Index). This versatile, multi-timeframe indicator provides you with a comprehensive view of trend directions across every significant timeframe, from M1 to MN1. No matter which timeframe you choose to analyze, the
Daily Performance Tracker
Mcblastus Gicharu Ndiba
Daily Performance Tracker (MetaTrader indicator) calculates the currency rate change relative to the previous day's close and displays it as a percentage in the main chart window. It also offers the option to show weekly and monthly percentage changes. You can customize colors to differentiate between positive and negative price movements. Additionally, a small, customizable arrow visually indicates the price direction. If your broker operates in a non-standard time zone, the Time Shift paramete
筛选:
无评论
回复评论