Boom 900 precision spike deector
- 指标
- David Chokumanyara
- 版本: 1.0
- 激活: 5
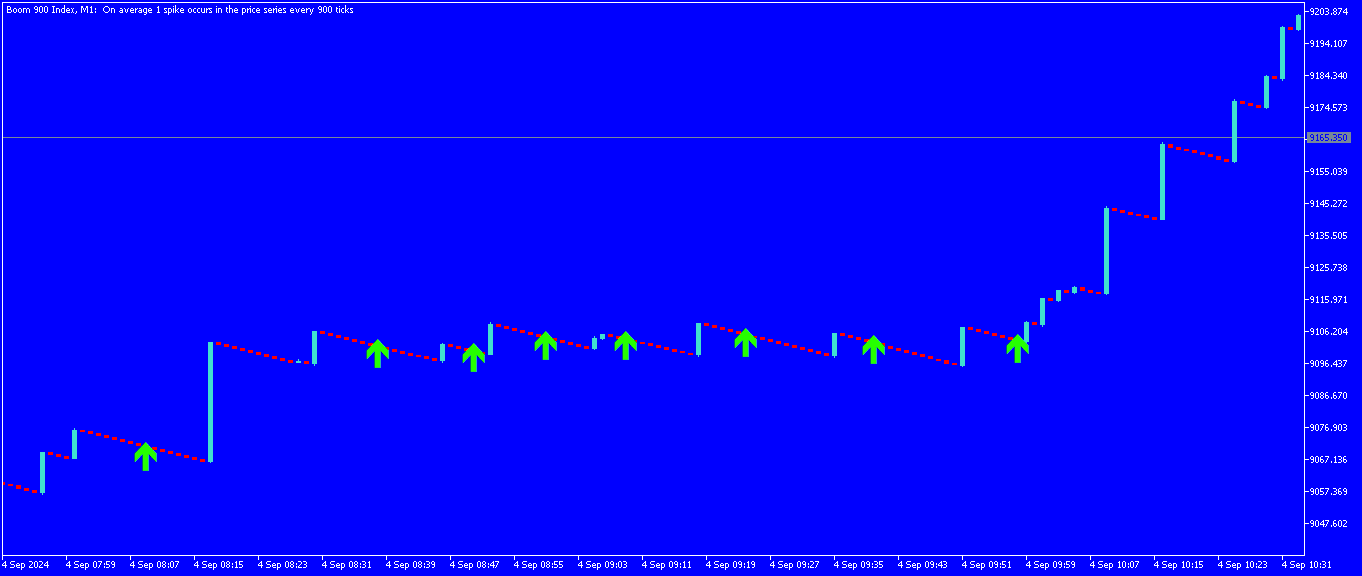
Boom 900 Precision Spike Detector
The Boom 900 Precision Spike Detector is a powerful tool designed to help traders accurately identify spike opportunities in the Boom 900 market. With advanced features and precise alerts, this indicator takes the guesswork out of trading, enabling you to maximize your profits with confidence.
Key Features:
- Non-Repainting Signals: Get reliable signals without repainting, ensuring your trading decisions are based on accurate, real-time data.
- Audible Alerts: Stay informed with sound alerts that notify you instantly when a signal is detected.
- Email and Push Notifications: Receive alerts directly to your device, so you never miss a trade setup.
- Works on M1 Timeframe: Optimized for the M1 timeframe, making it perfect for scalpers and short-term traders.
How to Use the Spike Detector:
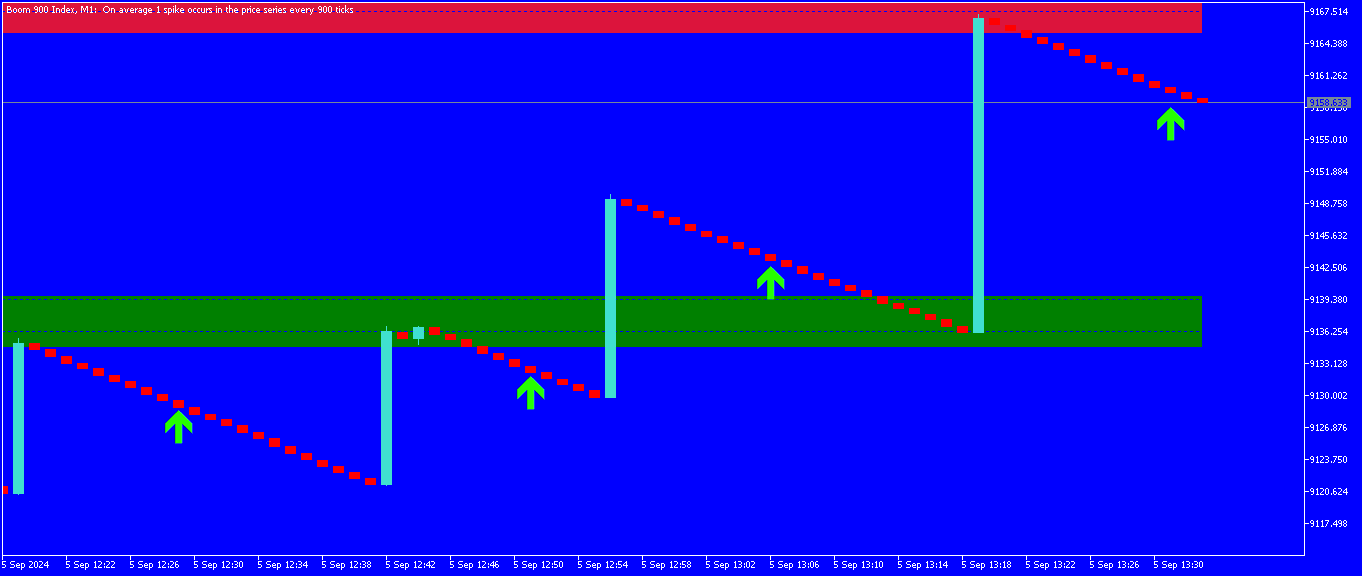
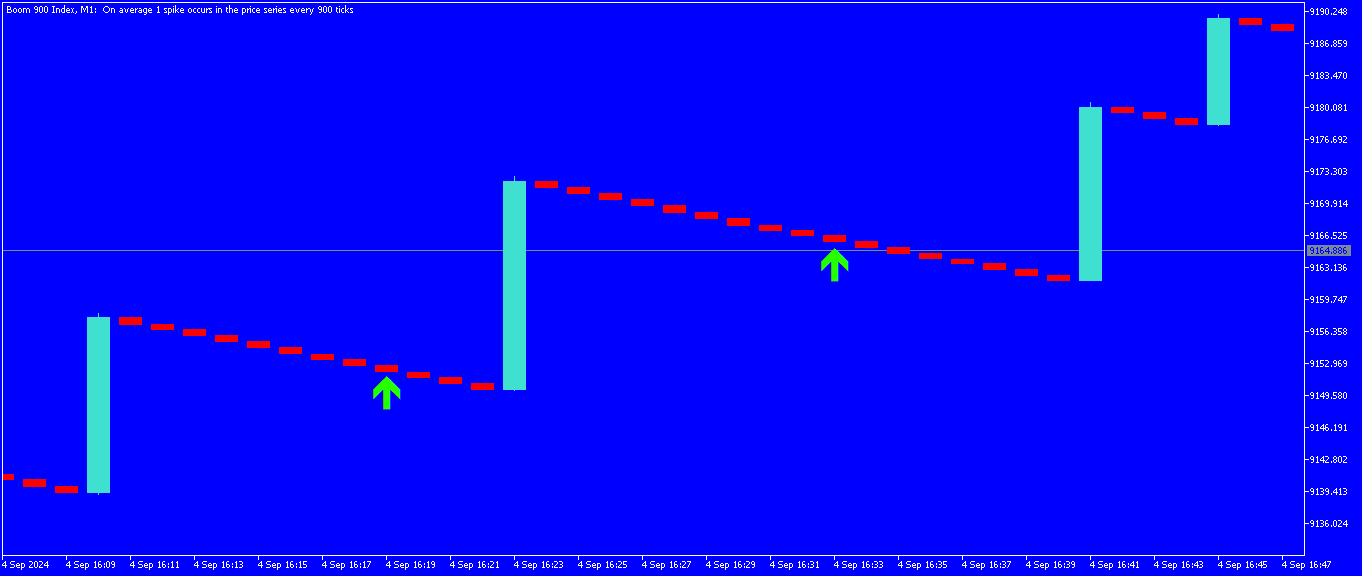
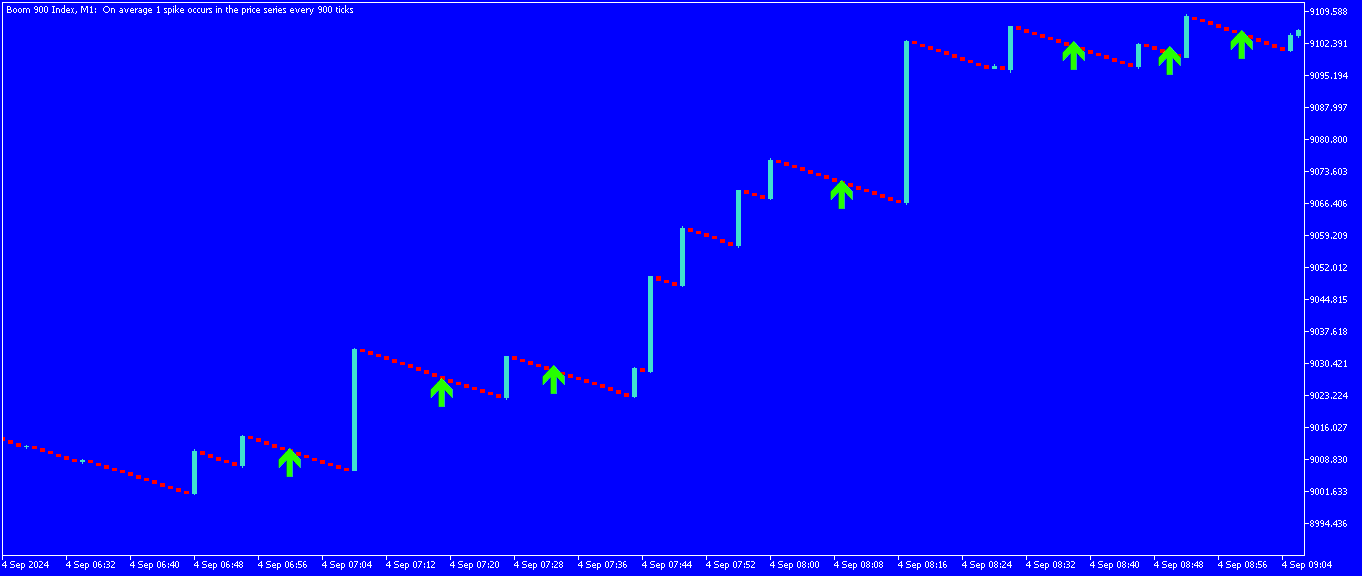
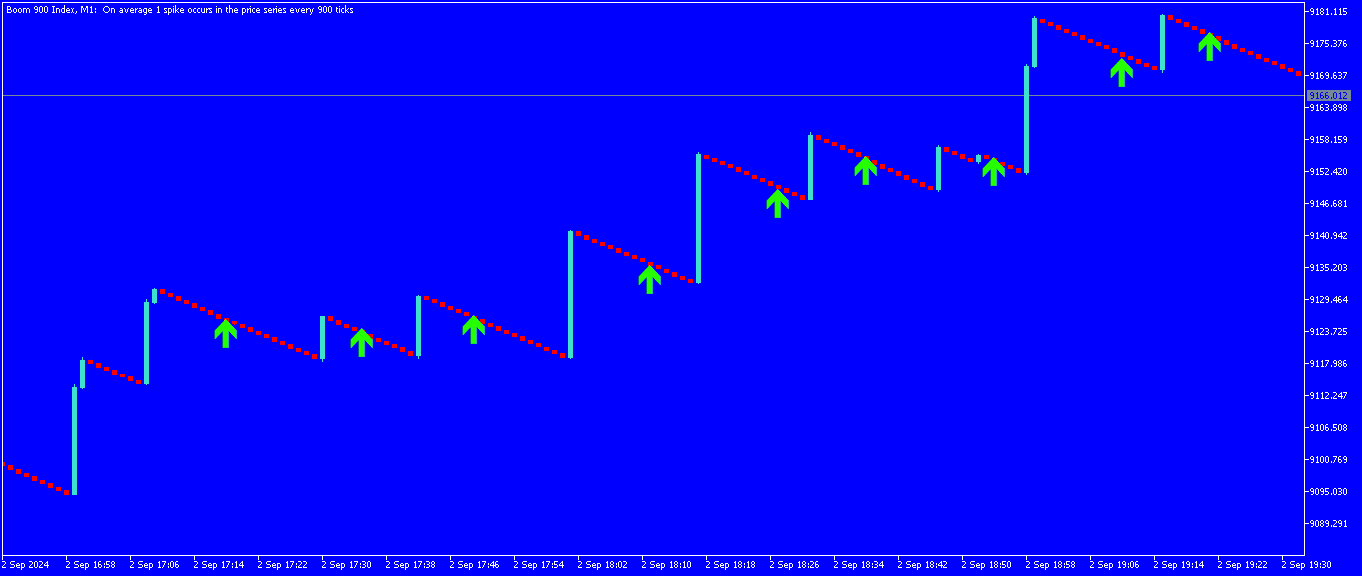
- Lime Arrow Signal:
- When a lime arrow appears, open a buy position.
- Set your stop loss to cover 10 M1 candles, or alternatively, close the trade after 10 minutes if no spike occurs.
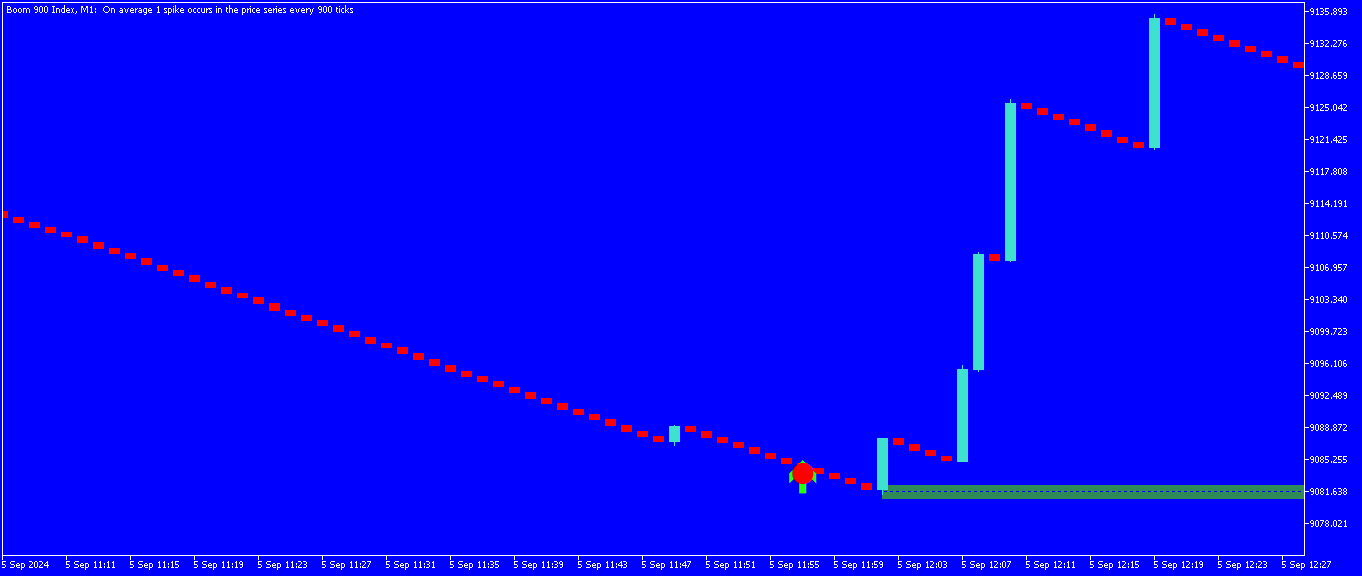
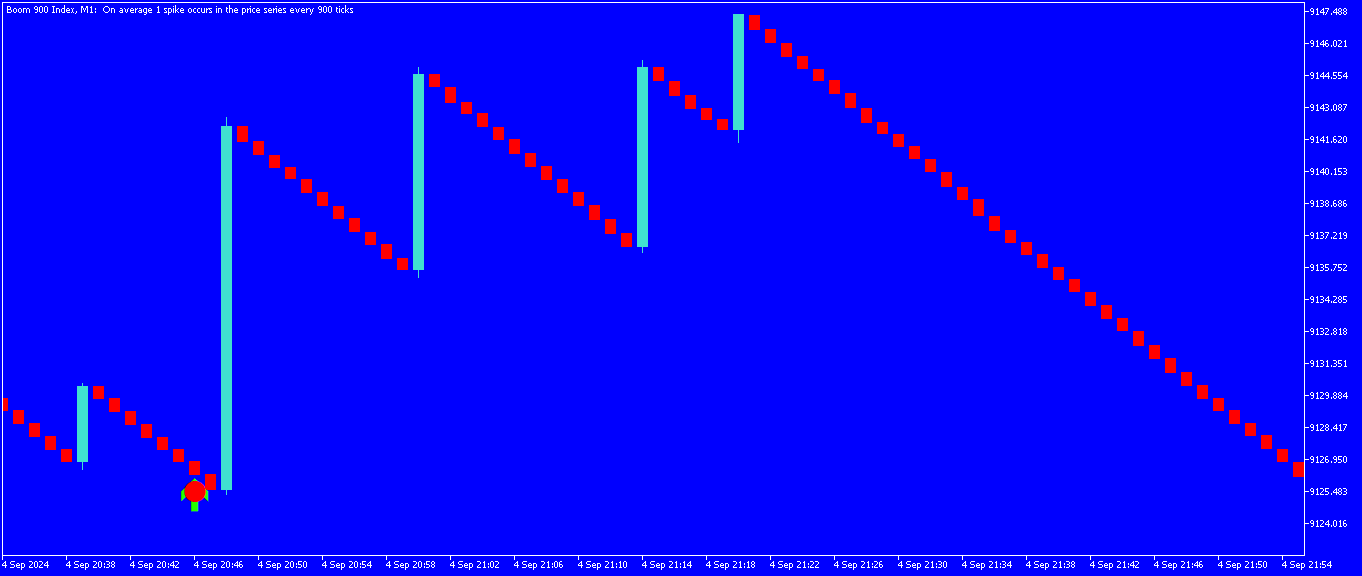
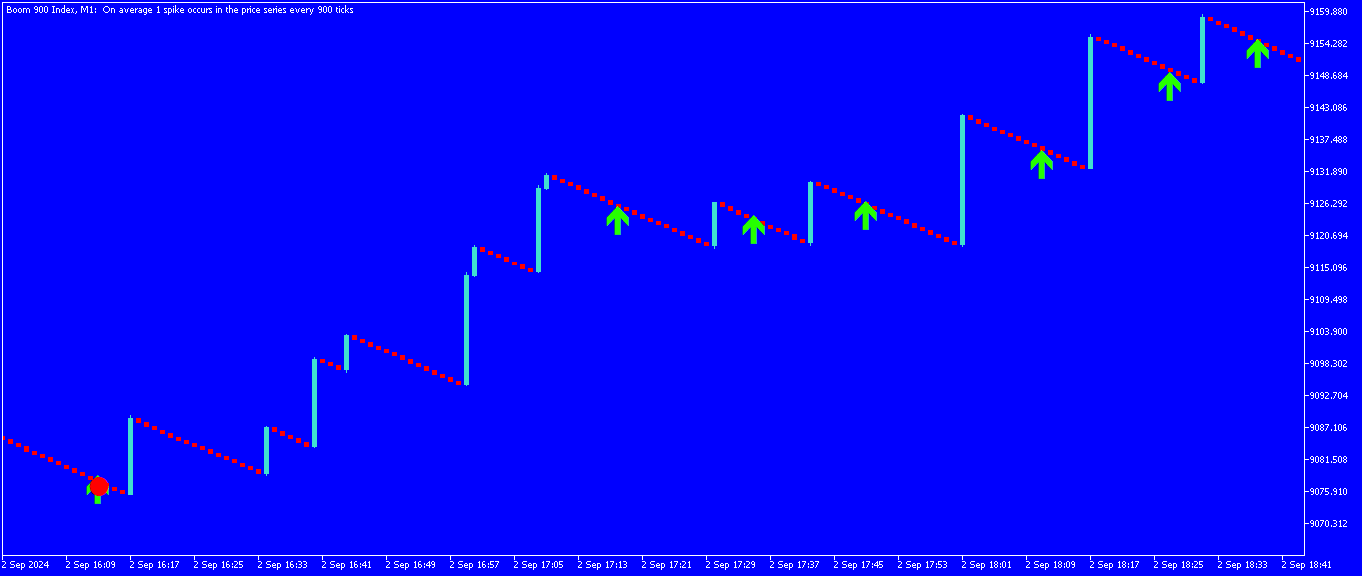
- Lime Arrow with Red Dot (Reversal Signal):
- When the lime arrow is accompanied by a red dot, this signals a strong reversal.
- Hold the trade for at least three spikes before closing the position.
- The lime arrow with the red dot is a strong and reliable signal for catching reversals.
This Precision Spike Detector is specifically designed to help traders capture the best opportunities with minimal risk. Whether you're looking to scalp quick spikes or catch powerful reversals, this tool is your perfect trading companion